Figure S1
(a) A TEM image of the unlabelled chromosome. The circle represents an area irradiated by an electron beam for ED. (b) Line profile along the line at α=262˚ from the diffraction pattern from the circle area in (a).
Figure S2
(a) A TEM image of the unlabelled chromosome. The circle represents an area irradiated by an electron beam for ED. (b) Line profile along the line at α=336˚ from the diffraction pattern from the circle area in (a).
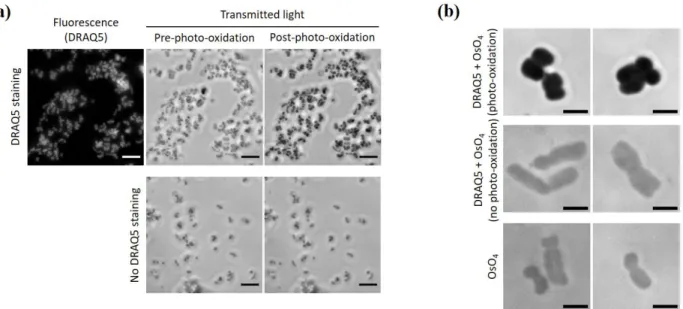
Fig. S3 ChromEM staining in isolated chromosomes (a) Isolated chromosomes either with or without DRAQ5 staining were visualized under optical microscope (40Х objective lens) before and after photo-oxidation. Scale bar = 5 µm (b) Isolate chromosomes visualized with transmitted light under optical microscope (100Х objective lens) after OsO4 intensification. Scale bar = 2 µm