Publisher’s version / Version de l'éditeur:
Journal of Applied Physics, 107, 4, pp. 043514-1-043514-5, 2010-02-22
READ THESE TERMS AND CONDITIONS CAREFULLY BEFORE USING THIS WEBSITE. https://nrc-publications.canada.ca/eng/copyright
Vous avez des questions? Nous pouvons vous aider. Pour communiquer directement avec un auteur, consultez la première page de la revue dans laquelle son article a été publié afin de trouver ses coordonnées. Si vous n’arrivez pas à les repérer, communiquez avec nous à [email protected].
Questions? Contact the NRC Publications Archive team at
[email protected]. If you wish to email the authors directly, please see the first page of the publication for their contact information.
NRC Publications Archive
Archives des publications du CNRC
This publication could be one of several versions: author’s original, accepted manuscript or the publisher’s version. / La version de cette publication peut être l’une des suivantes : la version prépublication de l’auteur, la version acceptée du manuscrit ou la version de l’éditeur.
For the publisher’s version, please access the DOI link below./ Pour consulter la version de l’éditeur, utilisez le lien DOI ci-dessous.
https://doi.org/10.1063/1.3310319
Access and use of this website and the material on it are subject to the Terms and Conditions set forth at
An open-photoacoustic-cell method for thermal characterization of a
two-layer system
Astrath, Nelson G. C.; Astrath, Francine B. G.; Shen, Jun; Lei, Chao; Zhou,
Jianqin; Liu, Zhong Sheng (Simon); Navessin, Titichai; Baesso, Mauro L.;
Bento, Antonio C.
https://publications-cnrc.canada.ca/fra/droits
L’accès à ce site Web et l’utilisation de son contenu sont assujettis aux conditions présentées dans le site LISEZ CES CONDITIONS ATTENTIVEMENT AVANT D’UTILISER CE SITE WEB.
NRC Publications Record / Notice d'Archives des publications de CNRC:
https://nrc-publications.canada.ca/eng/view/object/?id=596cc457-7303-413f-95fb-4fccb57a9f2e https://publications-cnrc.canada.ca/fra/voir/objet/?id=596cc457-7303-413f-95fb-4fccb57a9f2e
An open-photoacoustic-cell method for thermal characterization
of a two-layer system
Nelson G. C. Astrath,1,2,a兲Francine B. G. Astrath,1Jun Shen,1,a兲Chao Lei,1Jianqin Zhou,1 Zhong Sheng 共Simon兲 Liu,1 Titichai Navessin,1 Mauro L. Baesso,2 and
Antonio C. Bento2 1
Institute for Fuel Cell Innovation, National Research Council of Canada, 4250 Wesbrook Mall, Vancouver, British Columbia V6T 1W5, Canada
2
Departamento de Física, Universidade Estadual de Maringá, Avenida Colombo 5790, 87020-900 Maringá, Paraná, Brazil
共Received 1 September 2009; accepted 14 January 2010; published online 22 February 2010兲 In the present work, we use an open-photoacoustic-cell 共OPC兲 operating at high frequency to measure thermal properties of two-layer system samples. Photothermal deflection technique is also employed to measure the samples. The effective thermal diffusivity measured using the OPC method is interpreted using the concept of effective thermal resistance for a series two-layer system. The results show the reliability of the photoacoustic method for a complete thermal characterization of the samples. In addition, by varying the sample effective thickness, the thermal diffusivity and conductivity of each layer are precisely determined. The effective thermal diffusivity, thermal conductivity, and specific heat of a porous catalyst layer 共thickness varying from 13 to 53 m兲 deposited on an aluminum foil 共53 m in thickness兲 were thus measured and found to be 共3.7⫾ 0.3兲 ⫻ 10−3 cm2/s,共7.5⫾ 0.7兲 ⫻ 10−3 W / cm K, and共1.6⫾ 0.2兲 J / gK, respectively.
关doi:10.1063/1.3310319兴
I. INTRODUCTION
Photothermal 共PT兲 techniques have been shown to be highly sensitive tools to determine thermo-optical properties of solid samples.1–5PT techniques are based on the photoin-duced heat generation by nonradiative decay process follow-ing optical energy absorption of a sample, and the heat can cause a number of different effects, which provide various detection mechanisms. The information of the temperature rise in the sample as well as its thermo-physical parameters can be obtained with these detection methods.1–13One of the vastly used PT techniques is the photoacoustic 共PA兲 spectroscopy.1–8 Since the PA signal responds only to the absorbed light, the effects of scattered light play no signifi-cant roles in measurements. Apart from several different ap-paratus for PA detection, the simplicity and the usefulness of the open-PA-cell 共OPC兲 make this technique easily appli-cable to thermal characterization of solid materials such as measuring thermal diffusivity and thermal conductivity.9 Based upon the effective sample model widely used in heat transfer problems, the OPC has been used to investigate thermal properties of two-layer systems of variable thickness.10–15 This investigation makes the technique par-ticularly interesting to investigate layered systems such as, for instance, porous catalyst layers共CL兲 in fuel cell devices. This work is motivated by the need to characterize the thermal conductivity of a CL, a thin layer of porous compos-ite materials made of nanocarbon particles, nano Pt particles and proton-conducting ionomer materials. Inside the CL heat is produced by electrochemical reactions and electric
resis-tance. The heat has to be transferred out partly through water-evaporation and heat conduction. Thus, the CL’s ther-mal conductivity is an important parameter for a fine balance of water and temperature inside it.16–18 But measuring the thermal conductivity of the CL poses a challenge because of its thinness and porosity.
In this work, we use an OPC technique, operating up to 3.3 kHz, to measure the thermal properties of a two-layer system, a thin porous CL deposited on an aluminum foil. The effective thermal diffusivity measured using this high sensi-tive OPC method is interpreted using the concept of effecsensi-tive thermal resistance for a series two-layer system. This implies that the thermal diffusivity of the composite sample depends not only on the thermal diffusivity of its constituent materials but also on the ratio of their thermal conductivities. In addi-tion, by varying the sample effective thickness, the thermal diffusivity and conductivity of each layer can be precisely determined. We also use PT deflection technique as a complementary technique to confirm our results. Our results demonstrate the reliability of the PA method for complete thermal characterization of a sample.
II. THEORY
Considering the one-dimensional thermal diffusion mod-els of Rousset10and Perondi,11which was developed on con-sidering the Rosencwaig and Gersho photoaocoustic theory6 for an opaque sample, the pressure fluctuation pth in the air
chamber of a PA cell, as described in details in Ref. 11, is given by
a兲Authors to whom correspondence should be addressed. Electronic ad-dresses: [email protected] and [email protected].
pth⬇ ␥P0I0 lgT0kssg exp关j共t−/2兲兴 sinh共lss兲 . 共1兲
␥is the specific heat ratio of the gas in the chamber; P0and
T0are the ambient pressure and temperature, respectively. I0 is the absorbed light intensity;= 2f and f is the modula-tion frequency. li, ki, and␣iare the thickness, thermal
con-ductivity, and thermal diffusivity of material i, respectively. Here the subscript i denotes the sample共s兲 and the gas 共g兲 medium.i=共1 + j兲ai, and ai=共f /␣i兲1/2is the thermal
diffu-sion coefficient of material i. It is assumed that all light is absorbed at the sample surface, and that the heat flux into the surrounding gas is negligible. For a thermally thin sample 共i.e., Re关lss兴 = lsasⰆ1兲, the amplitude of the PA signal,
which is proportional to the nontemporal terms in the pres-sure fluctuation equation, decreases as f−3/2 as the modula-tion frequency increases.11On the other hand, for a thermally thick sample 共i.e., Re关lss兴 = lsasⰇ1兲, the amplitude of the
PA signal decreases as the modulation frequency increases as
f−1exp共−l
s
冑
f /␣s兲.11
However, in the case of plate-shaped solid samples sur-rounded by air with the edges tightly fixed in the PA cell, there may be contribution to the PA signal from the ther-moelastic bending if sample is heated by a concentrated beam like a laser spot and, for some particular condition also sample thermal expansion cannot be neglected. Both contri-butions are especially found in the thermally thick condition for lsasⰇ1.
9–11
The thermoelastic bending is essentially due to the temperature gradient inside the sample along the thick-ness axis共z axis兲, which leads the thermal expansion to de-pend on z. This z-dede-pendence of the displacement along the radial direction induces a bending of the sample in the z direction that acts as a mechanical piston, thereby contribut-ing to the PA signal. The contribution from the sample bend-ing to the PA signal is calculated by solvbend-ing the thermoelastic equations, described in details in Refs.10and11. It has been shown11 that for samples with lateral dimensions much greater than its thickness, the thermoelastic bending contri-bution is dominant over the sample thermal expansion. For an optically opaque sample, the thermal diffusion, Eq. 共1兲, and the thermoelastic contributions to the PA signal can be written as P= pth+ pel= C1ej共t−/2兲 sg
再
1 sinh共lss兲 +C1C2 s2g冋
cosh共sls兲 − 共sls/2兲sinhsls− 1 sinhsls册
冎
共2兲 in which C1=␥P0I0/共T0kslg兲 and C2 = 3R⬘
4T 0␣T冑
␣s/␣g/共R2ls 3兲. Here, R⬘
is the radius of the sample and R is the radius of the PA chamber in front of the microphone.␣Tis the sample thermal expansion coefficient.The first term in Eq.共2兲is due to the air contribution whereas the second represents the thermoelastic one. The effective thermal diffusivity of the two-layer system共␣s兲 then can be
attained using the OPC method by fitting the experimental data to Eq.共2兲, although additional considerations need to be taken in order to distinguish the thermal diffusivity of each layer.
To specify the thermal diffusivity of each layer in a two-layer system, let us consider a two-two-layer system consisting of material 1 of thickness l1and of material 2 with thickness l2, both having the same cross section. Yet, ls= l1+ l2denotes the
total sample thickness,␣the thermal diffusivity,the mass density, cv the specific heat at constant pressure, and k the
thermal conductivity of material 共= 1 , 2兲.
From the analogy between thermal and electrical resis-tances widely used in heat transfer problems,12,13 the effec-tive thermal resistance RTof this series two-layer system is RT= ls/k= RT共1兲+ RT共2兲, in which k is the effective thermal conductivity of the composite sample, and RT共兲= l/kis the thermal resistance of the layer . On the other hand, the effective heat capacity of the composite sample is Vc
= V11c1+ V22c2. By substituting these equations into ther-mal diffusivity equation, ␣s= k /c, and one can write the
effective thermal diffusivity of the two-layer system as12
␣s=
冋
x2 ␣1 +共1 − x兲 2 ␣2 + x共1 − x兲冉
␣1 + 1 ␣2冊
册
−1 , 共3兲in which x = l1/共l1+ l2兲 is the thickness fraction of the mate-rial 1 in the composite sample, and = k1/k2. Equation 共3兲 implies that the thermal diffusivity of the composite sample depends not only on the thermal diffusivities of its constitu-ent materials, but also on the ratio of their thermal conduc-tivities .
As another sensitive PT technique, the PT deflection 共PD兲 spectroscopy, or the mirage effect, is used to measure optical and thermal properties of materials19–21in this work. Recently, Fresnel diffraction theory was employed to predict the fundamental and harmonic responses of PD signals,20 which was used for thermal effusivity measurement as de-scribed in details in Ref.21. To determine the thermal effu-sivity of samples, we need to find the temperature rise on the sample surface. For an optically and thermally thick sample 共i.e., Re关lss兴 Ⰷ 1兲, the surface temperature rise can be
sim-plified as 兩兩 ⬇ 共I0/2
冑
2f兲Es−1 共Ref.
21兲 in which Es is the
thermal effusivity of the sample. The signal measured with a position sensor and a lock-in amplifier is proportional to the amplitude of the PD signal, given by SPD⬵x= m1exp共
−m2
冑
f兲 with m1=I0共dn / dT兲ZD/共2冑
␣gEs兲 and m2 = ZS冑
/␣g. is an instrumental factor associated with theposition sensor and the lock-in amplification scale. 共dn / dT兲 is the temperature coefficient of the refractive index of the deflecting medium共e.g., air in this work兲. ZSis the distance
from the axis of the probe beam to the sample surface 共po-rous CL coated side兲; ZD is the distance from the detector
plane to the mirage region.
III. EXPERIMENTAL
In this work, the samples under investigation were two-layer system consisting of a 53-m-thick aluminum foil and a CL of different thicknesses deposited on the Al-foil. The CL ink was prepared with 30 wt % of Nafion ionomer 共5 wt % solution, EW1000, Alfa Aeser兲. The Pt/carbon catalyst used in this work is 46 wt % Pt/graphitized carbon共Tanaka Kikinzoku Kogyo, TEC10EA50E兲 and the baseline ink for-mulation contains 1:1 mixture of methanol/water. The
ture was sonicated in water bath at room temperature for 30 min, and Nafion solution was added drop-wise to the mix-ture. The suspension was homogenized for 60 min. Auto-mated spray coater 共EFD-Ultra TT series兲 was employed to deposit CL onto the Al-foils. Different increments of Pt load-ing and number of scans were used to produce CL samples with thickness from 13 to 53 m, as shown in TableI.
Both OPC and PD methods were employed in a concur-rent arrangement21 to measure the thermal properties of the samples. The experimental setup of the conjugated technique is schematically shown in Fig. 1. A multimode diode-pumped solid-state laser共Melles Griot, Model 85 GLS 309, 532.0 nm兲 was employed to provide the top-hat homoge-neous beam excitation for both OPC and PD measurements. The excitation beam was expanded to produce a top-hat in-tensity profile on the uncoated sample surface for the OPC measurements, and on the CL surface for the PD measure-ments, respectively, using a set of lens, a pupil, and a lens. The diameter of the excitation laser beam on the sample was approximately d⬇ 3 mm, and a mechanical chopper 共EG&G, model 197兲 was used to modulate the excitation laser beam. For the PA measurement, the OPC signal was detected by a Bruel and Kjaer共Model 4943兲 microphone and processed by a lock-in amplifier共EG&G, Model 7265兲. The sample共CL coated side兲 itself was used as the sealing for the PA cell, as indicated in Fig. 1, which was attained using a small amount of vacuum grease. For the PD measurement, a TEM00 Gaussian He–Ne laser at 543.5 nm 共Melles Griot, Model 05LGP193, 1 mW兲, parallel to the sample surface at a distance a from the surface, intercepted the mirage region that located at the probe beam waist.21 The PD signal was detected by a position sensor共ON-TRAK, Model PSM1–10兲,
which was connected to a lock-in amplifier 共EG&G, Model 7265兲. A computer was used to control experimental data collection for both OPC and PD experiments. The modula-tion frequency of the excitamodula-tion laser beam was from 50 to 300 Hz for the PD and 100 to 3.3 kHz for the OPC, respec-tively.
IV. RESONANT OPC RESULTS
The PA cell was a conventional aluminum cell in which a 0.5 in. condenser microphone was mounted in one of its ends, as shown in Fig.1. This B&K microphone has roughly flat frequency response from 10Hz to 3kHz. On the other hand, the frequency response of the PA cell was obtained by running a frequency scan of a 53-m-thick Al sample. This sample is thermally thin 共lsasⰆ1兲 up to 10 kHz, and one
would expect the dependence of the PA signal on the modu-lation frequency to be f−1.5.11
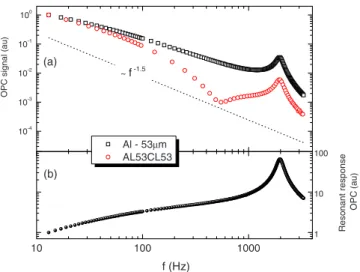
Figure2共a兲shows the frequency dependence of the OPC signal for the 53-m-thick Al and AL53CL53共53-m-thick CL deposited on the Al-foil兲 samples. The dotted line repre-sents the f−1.5frequency dependence. One can see that the Al frequency scan does not follow the f−1.5 dependence, but a
f−1.1 dependence up to 1 kHz and a maximum at approxi-TABLE I. Experimental measurement results.
Samples Thickness共⫾1%兲 x= l1 共l1+ l2兲 ␣s 共10−3 cm2/s兲 ECL 共Ws1/2/cm2K兲 Al l1 共m兲 CL l2
共m兲 OPC method PD method
AL53CL0 53 0 1 920 AL53CL13 53 13 0.803 15.0⫾ 0.9 0.12⫾ 0.02 AL53CL21 53 21 0.716 11.4⫾ 0.5 0.12⫾ 0.01 AL53CL23 53 23 0.697 11.0⫾ 0.2 0.11⫾ 0.01 AL53CL37 53 37 0.589 7.4⫾ 0.5 0.121⫾ 0.009 AL53CL45 53 45 0.540 7.7⫾ 0.2 0.112⫾ 0.007 AL53CL53 53 53 0.500 5.9⫾ 0.2 0.115⫾ 0.009
FIG. 1. A schematic diagram of the combined OPC and PD experimental apparatus. Miand Listand for mirrors and lenses, respectively.
10-4 10-3 10-2 10-1 100 10 100 1000 1 10 100 ~f-1.5 (b) Al - 53µm AL53CL53 OPC s ignal (au) (a) Resonant response OP C (au ) f (Hz)
FIG. 2. 共Color online兲 共a兲 Frequency spectra of the OPC signal for the 53-m-thick Al-foil共open squares兲 and 53-m-thick Al-foil coated with 53-m-thick CL, namely AL53CL53共open circles兲 samples. The doted line represents the f−1.5dependence of the modulation frequency, and共b兲 the resonant response curve for the OPC chamber.
mately 2 kHz. In fact, this response curve represents an OPC signal enhancement due to the resonant characteristics of the PA cell. By normalizing the Al OPC signal by the thermally thin frequency dependence, i.e., f−1.5, the resonant response of the OPC cell was obtained, Fig.2共b兲. It can be seen that the enhancement factor was as high as 100 times at 2 kHz. This response curve was then used to normalize all the OPC scans.
Figure 3 shows the normalized OPC signals for the samples. To test the experimental system and the theoretical model, we have performed a frequency scan in a 380-m-thick Al-foil. At this thickness, this Al-foil sample is thermally thick共lsasⰇ1兲 for frequencies above 200 Hz. The
data fitting of curve 共a兲 to Eq. 共2兲 共solid line兲 provided ␣s
=共0.91⫾ 0.01兲 cm2/s for the Al sample, which is very close to its literature value, 0.92 cm2/s.22In contrast, curves b, c, and d in Fig.3exhibit a different behavior with a change in the frequency dependence of the normalized OPC signal as the CL coating thicknesses increase. This frequency depen-dence is actually characteristic of the thermoelastic contribu-tion to the PA signal at high frequency and represents the change in the thermal diffusivity of the composite sample. Usually this behavior is not seen for thin layers due to the low signals detected in this frequency range, 1.0–3.3 kHz. In fact, the precision of our high frequency scans was possible only because of the signal enhancement factor by the reso-nant cell used in the experiments.
The solid lines in Fig.3correspond to the least-square fit of the data to the theoretical expression obtained from Eq. 共2兲. The fitting for the three samples, 53-m-thick Al-foil coated with 13-m-thick 共AL53CL13兲, 37-m-thick 共AL53CL37兲 and 53-m-thick共AL53CL53兲 layers of CL are shown in Fig. 3, and their effective thermal diffusivities as well as the results for other samples are summarized in Table I.
Figure4shows the␣sof all the samples as a function of
the thickness ratio parameter x, defined as the ratio of the Al
thickness to the total sample thickness 共Al+ CL兲. The best fit of the thermal diffusivity data to Eq. 共3兲 共solid line兲 with ␣1=␣Al, ␣2=␣CL, and = kAl/kCL as adjustable parameters, yielded ␣CL=共3.7⫾ 0.3兲 ⫻ 10−3 cm2/s, ␣Al =共0.92⫾ 0.02兲 cm2/
s, and =共0.31⫾ 0.03兲 ⫻ 103
. The value for ␣Al agrees very well with the literature value for Al. On the other hand, ␣CL has not been measured before, but if compared to the Nafion itself that was measured alone as
␣Nafion= 0.7⫻ 10−3 cm2/s,23 it is one fifth of the CL value, perhaps due to particles of Pt/carbon as doping in the sample. Note that the dotted line represents the expected value for the thermal diffusivity, using Eq. 共3兲, when only the CL com-poses the sample, that is, l1= 0. In addition, from one can calculate the thermal conductivity of the CL, providing kAlis known. Using kAl= 2.37 W / cm K,12 kCL was found to be
kCL=共7.5⫾ 0.7兲 ⫻ 10−3 W / cm K. The specific heat of the CL cCL=共1.6⫾ 0.2兲 J / gK was also calculated using cCL = kCL/CL␣CL and the measured mass density value,
CL共1.22⫾ 0.05兲 g / cm3.
As a supplementary measurement, we conducted PD ex-periments. To eliminate the effect of instrumental factor , the PD signals were normalized using a well-known mate-rial, a piece of glassy carbon共GC兲.21
Then the thermal effu-sivity can be expressed as ECL= m1共GC兲EGC/m1共CL兲. The lit-erature values of thermal properties of the GC are reported in Ref. 21. The different reflections by the calibration and CL samples were taken into account as described in Ref.21.
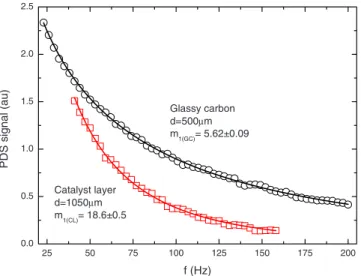
Figure 5 shows two examples of the PD signals of the GC and AL53CL53 samples as a function of the modulation frequency. The distances from the axis of the probe beam to the sample surfaces, d, are indicated. The measurement was performed in the thermally thick 共lsasⰇ1兲 regime. With the
laser exciting directly on to the CL coated side, the effective thermal effusivity measured by the PD technique refers only to the CL sample, and then is independent of the sample thicknesses. The continuous lines in Fig. 5 represent the least-square fitting using SPD= m1exp共−m2
冑
f兲, and the pa-rameters m1obtained from the fittings are also indicated.100 1000 10-3 10-2 10-1 100 101 d c b Aluminum - 380µm AL53CL13 AL53CL37 AL53CL53 Normalized O PC signal (au) f (Hz) a
FIG. 3. 共Color online兲 Normalized OPC signal amplitude as a function of the modulation frequency for 共a兲 the 380-m-thick Al-foil and three 53-m-thick Al-foil coated with 共b兲 13-m-thick 共AL53CL13兲, 共c兲 37-m-thick共AL53CL37兲, and 共d兲 53-m-thick共AL53CL53兲 layers of CL. The solid lines represent the data fitting to Eq.共2兲.
0.0 0.1 0.2 0.3 0.4 0.5 0.6 0.7 0.8 0.9 1.0 0.01 0.1 1 α Al= (0.920±0.002) cm 2 /s α CL= (3.7±0.3)x10 -3 cm2/s λ= (0.31±0.03)x103 αs (c m 2 /s) x= l1/(l1+l2)
FIG. 4. Effective thermal diffusivity data as obtained from the normalized OPC signal amplitude data fitting for the Al-CL samples as a function of the thickness ratio parameter x = l1/共l1+ l2兲. The solid lines represent the data fitting to Eq.共3兲. The dotted line represents the prediction of Eq.共3兲for the case l1= 0.
The effective thermal effusivities of the samples mea-sured by the PD method are listed in TableI. As expected, it does not depend on the sample thickness. Using the values of the effective thermal diffusivity and conductivity mea-sured by the OPC method, one can calculate the thermal effusivity ECL by using ECL= kCL/
冑
␣CL, resulting in ECL =共0.12⫾ 0.01兲 Ws1/2/cm2 K, which is in good agreement with the value obtained by the PD method.
V. CONCLUSION
In this work, we have used high frequency OPC tech-nique to measure the thermal properties of two-layer system samples. We have also used the PD technique to measure thermal effusivity. The effective thermal diffusivity mea-sured using the OPC method was interpreted using the con-cept of effective thermal resistance for a series two-layer system. This implies that the thermal diffusivity of the com-posite sample depends not only on the thermal diffusivity of its constituent materials but also on the ratio of their thermal conductivities. The results show the reliability of the PA method for complete thermal characterization of a sample. In
addition, by varying the sample effective thickness, the ther-mal diffusivity and conductivity of each layer can be pre-cisely determined. This method has been applied to measure a thin porous CL of a fuel cell.
ACKNOWLEDGMENT
The authors thank CAPES, CNPq, and Fundação Araucária-Paraná for the partial financial support.
1
D. Almond and P. Patel, Photothermal Science and Techniques共Chapman & Hall, London, 1996兲.
2
Photoacoustic and Thermal Wave Phenomena in Semiconductors, edited
by A. Mandelis共Elsevier, New York, 1987兲. 3
H. Vargas and L. C. M. Miranda,Phys. Rep.161, 43共1988兲. 4
Progress in Photoacoustic and Photothermal Science and Technology,
ed-ited by A. Mandelis共Elsevier, New York, 1991兲. 5
H. Vargas and L. C. M. Miranda,Rev. Sci. Instrum.74, 794共2003兲. 6
A. Rosencwaig and A. Gersho,J. Appl. Phys.47, 64共1976兲. 7
O. Pessoa, Jr., C. L. Cesar, N. A. Patel, H. Vargas, C. C. Ghizoni, and L. C. M. Miranda,J. Appl. Phys.59, 1316共1986兲.
8
F. J. M. Harren, J. Reuss, E. J. Woltering, and D. D. Bicanic,Appl. Spec-trosc.44, 1360共1990兲.
9
A. C. Bento, H. Vargas, M. M. F. Aguiar, and L. C. M. Miranda, Phys. Chem. Glasses 28, 127共1987兲.
10
G. Rousset, F. Lepoutre, and L. Bertrand,J. Appl. Phys.54, 2383共1983兲. 11
L. F. Perondi and L. C. M. Miranda,J. Appl. Phys.62, 2955共1987兲. 12
A. M. Mansanares, A. C. Bento, H. Vargas, N. F. Leite, and L. C. M. Miranda,Phys. Rev. B42, 4477共1990兲.
13
J. J. Alvarado-Gil, O. Zelaya-Angel, H. Vargas, and J. L. Lucio M.,Phys. Rev. B50, 14627共1994兲.
14
L. Olenka, A. N. Medina, M. L. Baesso, A. C. Bento, and A. F. Rubira,
Braz. J. Phys.32, 516共2002兲. 15
A. Calderón, J. J. Alvarado-Gil, Yu. G. Gurevich, A. Cruz-Orea, I. Delga-dillo, H. Vargas, and L. C. M. Miranda,Phys. Rev. Lett.79, 5022共1997兲. 16
A. Lindermeir, G. Rosenthal, U. Kunz, and U. Hoffmann, J. Power Sources129, 180共2004兲.
17
H. A. Gasteiger, J. E. Panels, and S. G. Yan,J. Power Sources127, 162 共2004兲.
18
S. Gottesfeld and T. A. Zawodzinski, in Advances in Electrochemical
Sci-ence and Engineering, edited by R. C. Alkire, H. Gerischer, D. M. Kolb,
and C. W. Tobias共Wiley, Weinheim, 1997兲, pp. 195–301. 19
A. C. Boccara, D. Fournier, and J. Badoz, Appl. Phys. Lett. 36, 130 共1980兲.
20
J. H. Rohling, J. Shen, J. Zhou, and C. E. Gu,Opt. Lett.31, 44共2006兲. 21
F. B. G. Astrath, N. G. C. Astrath, J. Shen, J. Zhou, and M. L. Baesso,J. Appl. Phys.104, 066101共2008兲.
22
D. R. Lide, CRC Handbook of Chemistry and Physics, 88th ed.共CRC, Cleveland, 1977兲.
23
D. T. Dias, J. Mura, M. L. Baesso, A. N. Medina, A. C. Bento, and J. Shen,J. Phys. IV125, 383共2005兲. 25 50 75 100 125 150 175 200 0.0 0.5 1.0 1.5 2.0 2.5 Catalyst layer d=1050µm m1(CL)= 18.6±0.5 Glassy carbon d=500µm m1(GC)= 5.62±0.09 PDS s ignal (au) f (Hz)
FIG. 5.共Color online兲 Fundamental PD signals vs modulation frequency for the GC and AL53CL53 samples. The continuous lines represent the best curve fitting using SPD= m1exp共−m2冑f兲. The fitted m1sare also indicated.