Publisher’s version / Version de l'éditeur:
Proceedings of the ASME 2015 34th International Conference on Ocean,
Offshore and Arctic Engineering, OMAE2015, May 31-June 5, St. John's,
Newfoundland, Canada, v. 9 Ocean Renewable Energy, 2015-06
READ THESE TERMS AND CONDITIONS CAREFULLY BEFORE USING THIS WEBSITE. https://nrc-publications.canada.ca/eng/copyright
Vous avez des questions? Nous pouvons vous aider. Pour communiquer directement avec un auteur, consultez la
première page de la revue dans laquelle son article a été publié afin de trouver ses coordonnées. Si vous n’arrivez pas à les repérer, communiquez avec nous à [email protected].
Questions? Contact the NRC Publications Archive team at
[email protected]. If you wish to email the authors directly, please see the first page of the publication for their contact information.
NRC Publications Archive
Archives des publications du CNRC
This publication could be one of several versions: author’s original, accepted manuscript or the publisher’s version. / La version de cette publication peut être l’une des suivantes : la version prépublication de l’auteur, la version acceptée du manuscrit ou la version de l’éditeur.
For the publisher’s version, please access the DOI link below./ Pour consulter la version de l’éditeur, utilisez le lien DOI ci-dessous.
https://doi.org/10.1115/OMAE2015-42198
Access and use of this website and the material on it are subject to the Terms and Conditions set forth at
Appraisal of the IEC technical specification for assessment of wave
energy resources
Piche, Steffanie; Cornett, Andrew; Baker, Scott; Nistor, IoanI.
https://publications-cnrc.canada.ca/fra/droits
L’accès à ce site Web et l’utilisation de son contenu sont assujettis aux conditions présentées dans le site LISEZ CES CONDITIONS ATTENTIVEMENT AVANT D’UTILISER CE SITE WEB.
NRC Publications Record / Notice d'Archives des publications de CNRC:
https://nrc-publications.canada.ca/eng/view/object/?id=4cb104cb-e541-4231-a2a3-0f62ea4f65f4 https://publications-cnrc.canada.ca/fra/voir/objet/?id=4cb104cb-e541-4231-a2a3-0f62ea4f65f4Proceedings of the ASME 2015 34th International Conference on Ocean, Offshore and Arctic Engineering
OMAE2015 May 31-June 5, St. John's, Newfoundland, Canada
OMAE2015-42198
APPRAISAL OF THE IEC TECHNICAL SPECIFICATION FOR ASSESSMENT OF
WAVE ENERGY RESOURCES
Steffanie Piche
Department of Civil Engineering University of Ottawa Ottawa, Ontario, Canada
Andrew Cornett
National Research Council Canada Ottawa, Ontario, Canada
Scott Baker
National Research Council Canada Ottawa, Ontario, Canada
Ioan Nistor
Department of Civil Engineering University of Ottawa Ottawa, Ontario, Canada
ABSTRACT
This article describes and presents results from research focused on appraising the new technical specification (TS) for the assessment of wave energy resources developed by technical committee 114 of the International Electro-technical Commission (IEC-TC-114). The new IEC TS is appraised through an extensive pilot application to the waters off the west coast of Vancouver Island, British Columbia, Canada. A series of wave models are developed and used to simulate the wave conditions and estimate the wave energy resource over the study area. The accuracy of the various resource estimates derived from the model outputs is assessed through comparison with measurements from a directional wave buoy. Furthermore, sensitivity analyses are conducted to determine the main sources of error and uncertainty impacting the precision of resource assessments obtained following the IEC methodology. Preliminary results indicate that the IEC TS can be applied to the estimation of wave energy resources with a reasonable level of effort and accuracy.
INTRODUCTION
The International Electro-technical Commission, through Technical Committee 114 (IEC TC-114), is developing a set of technical specifications (precursors to standards) for the nascent marine renewable energy industry. One of these technical specifications (TS) concerns methods for reliably and accurately determining the scale and character of the wave energy resources in a region [1]. The resource assessment
framework described in the TS is based on the numerical modeling of wave conditions, successfully validated by field measurements. The TS proposes different requirements and procedures appropriate for different stages of assessment (reconnaissance, feasibility, and design), depending on the desired accuracy and level of effort. More extensive measurements and more sophisticated, detailed modeling are typically required to increase the accuracy and reliability of the resource assessment.
The new IEC TS for wave energy resource assessment is based on a relatively limited amount of research and industry experience. The proposed suite of methods have only been partially applied in real world situations [2, 3], and it is uncertain to what extent the prescribed methodologies will lead to the desired outcomes and levels of precision.
The research described in this article is being led by the National Research Council of Canada, and conducted in collaboration with the Department of Civil Engineering at the University of Ottawa. The main goal is to appraise the new IEC TS for the assessment of wave energy resources through application of the methodology set out in the TS to a pilot site in the Pacific Ocean near the west coast of Canada. A key aim of this research is to determine whether the desired outcomes and level of precision are obtained when the methods described in the TS are followed. This will be supplemented by conducting a sensitivity analysis to identify how the precision and reliability of a wave energy resource assessment is influenced by the details of the wave modeling process.
IEC RESOURCE ASSESSMENT METHODOLOGY
The IEC TS for wave energy resource assessment establishes a framework for modeling, analyzing, and reporting the potential wave energy resources at sites suitable for development. This TS requires the complex modeling of wave conditions, successfully validated by field measurements [1]. The TS acknowledges that the required quality and resolution of the essential bathymetric, wind, and wave data will vary depending on the stage of resource assessment being undertaken. As such it outlines three stages of assessment based on the level of accuracy required: a preliminary reconnaissance stage geared to identifying potential sites in a larger region, a more detailed feasibility stage for assessing the potential at these sites with greater certainty, and the final design stage to support the detailed design of a wave energy project. More extensive measurements and more sophisticated, detailed modeling are generally required in order to obtain wave energy predictions with an increased reliability and accuracy.
The general methodology outlined by the TS can be divided into seven steps as shown in Figure 1. The study planning step involves selecting the study area and declaring the intended stage or type of resource assessment (reconnaissance, feasibility or design). The next step involves collecting and screening the bathymetric, wind, current, tidal, and wave data required to conduct numerical simulations of wave propagation across the study area and validate the model output. The setup of the numerical model is dependent on the class of resource assessment targeted. Higher class assessments will require finer mesh resolutions and may require higher resolution bathymetry and wind data and more detailed boundary conditions. The TS requires that the model output is successfully validated through comparison with measured wave data at one or more locations. The model may need to be refined until the desired level of precision is obtained and the validation criteria specified in the TS are achieved. The final steps of the assessment methodology involve hindcasting the wave conditions for a suitable period (ideally ten years), calculating a standard set of energy resource parameters from the modeled spectra, estimating the degree of uncertainty and reporting and archiving the results as per the TS guidelines.
The wind data used to force the wave model is recommended to have a temporal resolution of 3hr for both the reconnaissance and feasibility stages, and 1hr for the design stage model. The spatial wind resolution recommended for the reconnaissance, feasibility, and design stages is 100km, 50km, and 25km, respectively. Parametric boundary conditions (i.e. wave spectra specified in terms of significant wave height, Hs,
peak period, Tp, and a dominant direction) are considered
acceptable for reconnaissance stage assessments only; however full spectral boundary conditions are recommended for all stages of assessment. A large set of physical processes, such as whitecapping, wave breaking, triad interactions, etc., are required to be considered at all stages of assessment, with the exception of depth-induced wave breaking and bottom friction which are not required at the reconnaissance stage [1]. Finally,
the minimum spatial mesh resolution is 5km for the reconnaissance stage, 500m for the feasibility stage, and 50m for the design stage.
In the TS, the total uncertainty of the resource assessment (Figure 1) is divided into three categories: the measurement uncertainty, the modeling uncertainty, the uncertainty due to long term variability. The TS recommends the calculation of these uncertainties based on the procedures defined in [4].
FIGURE 1.SIMPLIFIED WAVE RESOURCE ASSESSMENT PROCEDURE
PILOT APPLICATION OF THE IEC-TS Methodology
The new IEC TS for wave energy resource assessment has been applied to assess the wave energy resource on the western coast of Vancouver Island, near the community of Ucluelet, British Columbia, Canada (see Figure 2).
FIGURE 2.STUDY LOCATION
The wave energy resource in this region has previously been investigated by several authors, including [5-7]. The current work expands upon these studies by conducting multiple resource assessments following the new IEC TS and investigating the main sources of error in the wave and energy estimations that are obtained. In this study a series of wave propagation models based on the SWAN model [8] have been developed and used to estimate the wave conditions and wave energy resource across the study area. The resource assessments derived from the SWAN model outputs are compared with data from both directional and non-directional wave measurement buoys. The main source of comparison is a directional wave buoy known as Beverley deployed by the West Coast Wave Initiative (WCWI) [9] near the community of Ucluelet, ~6 km from shore in 45 m water depth (Latitude: 48°52.82', Longitude: 125°37.08').
Three different SWAN models are being developed and used to predict the temporal and spatial variation in the coastal wave conditions for a period of 10 years from 2005 to 2014. The three models feature varying levels of detail, sophistication, and computational effort. The SWAN models corresponding to the reconnaissance and feasibility stages of resource assessment feature unstructured grids (generated using the Blue Kenue software [10]), covering a 280 km stretch of the Pacific coast of North America, with focus on the waters near the community of Ucluelet. The model domains were developed so that the water depth along the offshore boundary was at least 200 m, and the boundary included several points where wave data hindcasted by the WaveWatch-III model [11,12] was available. The reconnaissance model grid features 4,300 nodes with a 1.5 km grid resolution around the region of interest; whereas the feasibility grid has 16,000 nodes and a 500m grid resolution around the study site (as per the IEC TS recommendations described above). The design model grid, which is currently in
development, will cover a smaller area with a finer resolution. The reconnaissance and feasibility model grids are shown in Figure 3.
The boundary conditions for both the reconnaissance and feasibility models were developed from information in the WaveWatch III (WW3) global wave hindcast database created by the Marine Modeling Branch of the National Oceanographic and Atmospheric Administration (NOAA-MMB) [11, 12]. Both models were forced using a temporally varying wind field combined with a temporally varying estimation of the directional wave spectrum along the model boundaries. As the reconnaissance model was intended to be relatively simple, a spatially-constant wind field was specified at three hour intervals across the domain. The wave boundary conditions were specified at three locations along the offshore boundary in terms of the significant wave height, the peak wave period, and the dominant direction (all from WW3); combined with an assumed JONSWAP spectral shape and a cos4(Ɵ-Ɵ
0) directional
spreading function. The more detailed feasibility model was forced using a spatially and temporally varying wind field specified every three hours at a spatial resolution of ~50km. The wave boundary conditions for the feasibility model were developed by synthesizing directional wave spectra from the partitioned data contained in the WW3 database and were specified at the same three locations used in the reconnaissance model. The spectra at these three boundary locations were interpolated through SWAN in order to provide wave spectra along the entire boundary. The partitioned data includes significant wave height, peak wave period, and dominant direction for up to nine distinct wave systems (seas or swells). A spreading function and spectral shape was assumed for each partition, and the full directional spectrum was developed by summing the contributions from each partition. The directional spectra synthesized in this manner generally feature multiple
x
lobes of wave energy propagating in different directions, which is a more realistic representation of typical wave conditions found in nature. Therefore the feasibility model is able to represent combined seas and swells approaching the coast from different directions at each time step, while the simpler reconnaissance model cannot.
FIGURE 3.SWAN MODEL MESH: A) RECONAISSANCE MODEL; B)
FEASIBILITY MODEL
In the reconnaissance model, directional wave spectra were resolved using 25 frequencies and 24 directional bins, while the feasibility model used 41 frequencies and a total of 36 directional bins. The frequency bin sizes were variable, based on a logarithmic distribution. Both models were run in non-stationary mode.
Preliminary Results
Following the recommendations of the IEC TS [1], the wave energy resources at various reference sites have been characterized in the terms of the following parameters:
Spectral estimate of significant wave height, Hm0
Energy period, Te
Peak period, Tp
Average zero-crossing wave period, Tz
Spectral width, ε0
Omni-directional wave power, J
Maximum directionally resolved wave power, Jθmax
Direction of maximum wave power, θJmax
Directionality coefficient, d
FIGURE 4.PREDICTED WAVE HEIGHTS FOR 18:00, MAY 14TH,2013:
A) RECONNAISSANCE MODEL; B) FEASIBILITY MODEL
A)
B)
B) A)
FIGURE 5.MEASURED AND MODELED WAVE SPECTRA AT STN BEVERLEY FOR 18:00,MAY 14TH 2013: A)BUOY MEASUREMENTS; B) RECONNAISSANCE MODEL; C) FEASIBILITY MODEL.
For the reconnaissance stage of assessment, model validation is required through comparison with the measured Hm0, Te, and J, while the feasibility and design stages add
validation against the wave direction (θJmax), the spectral width,
ε0, and the directionality coefficient, d. Identical procedures
were developed to calculate these key resource parameters from both the wave buoy data and the SWAN model output. Several statistical measures, including bias, root-mean-square error (RMSE), scatter index (SI), and the coefficient of determination (R²) were adopted in order to assess and quantify the validity and predictive skill of the reconnaissance and feasibility models.
Typical outputs (Hm0) from the reconnaissance and
feasibility models for a single time step are compared in Figure 4. Figure 5 compares the measured and modeled directional spectra at the Beverley buoy for the same time step.
Figure 6a compares the measured and modelled significant wave height at Station Beverley during May and June 2013, while Figure 6b and Figure 6 compare the omni-directional wave power and the energy period for the same time period. These results indicate that the feasibility model generally provides a more accurate estimation of the directional wave conditions throughout the study area, as expected, due to its greater resolution and more realistic boundary conditions. However, this increased accuracy comes at the expense of greater computational cost since the run time for the feasibility model is roughly eight times greater.
From these results it was possible to obtain preliminary statistics that help to quantify the accuracy and performance of the reconnaissance and feasibility stage models. These statistics are shown in Table 1, where it can be seen that the feasibility model outperforms the reconnaissance model, as expected. The feasibility results show a relatively constant level of accuracy for the different months, while the accuracy of the reconnaissance model varies greatly from month to month. This
indicates a larger uncertainty for resource estimates derived from the reconnaissance model outputs. Additionally, while the wave height and power show comparable levels of accuracy, the accuracy of the energy period is much lower, though it does show improvement in the feasibility model. Investigations into the low accuracy of the energy period are ongoing.
FIGURE 6.MEASURED AND MODELED WAVE CONDITIONS AT STN BEVERLEY: A)HM0; B)J; C)TE
A)
B)
C)
TABLE 1.R² VALUES FOR RECONNAISSANCE AND FEASIBILITY MODELS
Reconnaissance Feasibility April 2013
Wave Height 0.855 N/A
Power 0.780 N/A
Energy Period 0.249 N/A May 2013 Wave Height 0.539 0.825 Power 0.176 0.739 Energy Period 0.334 0.434 June 2013 Wave Height 0.661 0.856 Power 0.634 0.873 Energy Period 0.327 0.474
The TS sets out a set of validation criteria based the' weighted mean systematic error and the weighted mean random error which are calculated from the bias and standard deviation in each cell of an omni-directional Hm0-Te scatter table. The
maximum acceptable systematic and random errors for the wave height, power, and energy period are shown in Table 2; while the calculated values for reconnaissance and feasibility models at the Beverley site are listed in Table 3. It should be noted that the TS validation criteria reflect what is currently considered achievable, and will be revised once additional experience is gained in the industry.
TABLE 2.IECMINIMUM VALIDATION CRITERIA
Reconnaissance Feasibility Weighted Mean Systematic Error
Wave Height 10 5
Power 25 12
Energy Period 10 5
Weighted Mean Random Error
Wave Height 15 10
Power 35 25
Energy Period 15 10
TABLE 3.ERROR VALUES FOR RECONNAISSANCE AND FEASIBILITY MODELS
Reconnaissance Feasibility Weighted Mean Systematic Error (%) Wave Height 2.18 -0.40
Power 6.51 0.07
Energy Period 0.28 0.66 Weighted Mean Random Error (%)
Wave Height 5.82 1.65
Power 19.75 3.31
Energy Period 3.20 3.62
The results in Table 3 were obtained from March - June 2013 for the reconnaissance model, and from May - September 2013 for the feasibility model. These errors indicate that both
models easily meet the minimum validation criteria, potentially indicating the possibility for refinement of the validation criteria or methodology.
Sensitivity analysis
The IEC TS allows for considerable latitude in methodology, particularly at the reconnaissance and feasibility stages. A sensitivity analysis is being undertaken to identify the main sources of error and modeling uncertainty impacting wave energy resource assessments conducted in accordance with the new IEC TS. The sensitivity analysis will help in identifying the relative importance of various factors and in developing guidance for users of the TS on how to improve accuracy and certainty.
The sensitivity of the wave model's predictive skill has so far been assessed for the following parameters:
The manner in which wind forcing is applied in the model; The frequency resolution within the wave model;
The directional resolution within the wave model; The resolution of the model grid near the study area; Model physics such as wave breaking and bottom friction; The spreading function assumed along the offshore
boundary; and,
The spectral shape assumed along the offshore boundary. Due to space constraints, the sensitivity of the simple reconnaissance model outputs to only of these four factors will be discussed in this paper: the way in which wind forcing is applied; whether wave breaking is modeled; whether the effects of bottom friction are simulated; and whether triad interactions are included.
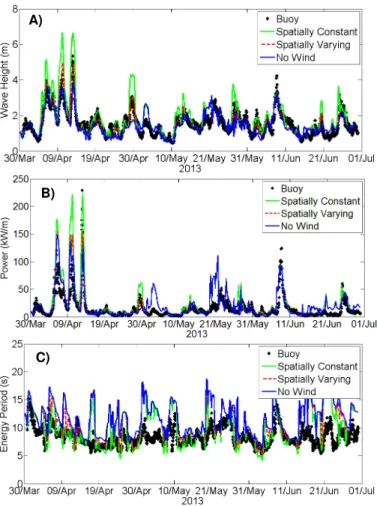
The results in Figure 7 show how the inclusion of a spatially and/or temporally varying wind can result in improved estimates of wave height, wave power, and energy period at the Beverley buoy, especially when compared to the case when no wind is applied (modeled as a constant wind of 0 m/s). The assumption of a constant wind speed tends to result in the wave height and power being over-estimated, while the assumption of no wind can result in an under-estimation of the wave height and the wave power, with the opposite occurring for the energy period. The R2 values plotted in Figure 8 serve as an indicator
of the accuracy of the SWAN model output compared against observations from the Beverley buoy. Also shown in this figure is the average simulation time per month for the three different wind scenarios. Surprisingly, the scenario in which a zero wind speed was modeled had the longest computational time despite having the lowest level of accuracy. Alternatively, simulating a spatially and temporally varying wind field resulted in an increase in accuracy for the wave height when compared to the case of a spatially constant wind, and a slight decrease in the accuracy of the wave power and energy period estimations. When considering the validation criteria specified in the TS, it was noted that both the spatially varying and no wind cases resulted in lower errors for both the wave height and power, and higher errors for the energy period, possibly due to the reduction in the peak values seen in the modeled wave height
and power. In all cases the errors remained below maximum allowable thresholds.
FIGURE 7. MEASURED AND MODELED WAVE CONDITIONS AT STN BEVERLEY FOR DIFFERENT WIND INPUTS: A)HM0; B)J; C)TE
FIGURE 8.INFLUENCE OF VARIOUS WIND INPUTS ON PREDICTIVE SKILL FOR WAVE HEIGHT, OMNI-DIRECTIONAL WAVE POWER AND ENERGY
PERIOD
These results suggest that simulating the wind is definitely helpful and worthwhile, but that simulating a spatially varying wind field does not offer significant benefits at the reconnaissance stage in this case. Assuming a spatially-constant wind and a spatially-variable wind yield comparable results in terms of both accuracy and simulation time. A larger data set with many additional months of data is currently being created and analyzed to confirm this preliminary conclusion.
According to the IEC TS, modeling the effects of depth-limited wave breaking and bottom friction is not essential at the reconnaissance stage. Figure 9 and Figure 11 show the variation over time of three key resource parameters derived from the model runs in which wave breaking and bottom friction were included and excluded from the computations. These processes were modeled using the default formulations and parameters provided in SWAN [8]. These results suggest that including depth-limited wave breaking has very little influence on the estimation of both the wave height and wave power as well as the energy period. This result is not overly surprising considering that the buoy is located in 45 m water depth, where the effects of depth-limited wave breaking are negligible. Figure 10 shows that the simulation with wave breaking yields the same level of accuracy with increased computational cost when compared to the case without wave breaking. If shallower water depths are of interest, depth-limited breaking should be included as it does not require a significant computational cost but may increase the model accuracy significantly for sites within the surf zone. However, it is not necessary at the reconnaissance stage for sites located in water depths like those at Station Beverley.
Results from simulations conducted with and without bottom friction are compared in Figure 11. The method chosen to represent bottom friction was the JONSWAP formulation, using default values as specified in the SWAN model [8]. From these figures it can be seen that bottom friction has a small influence on the wave conditions at this site, leading to small reductions in both wave height and wave power. However, including bottom friction in the modeling appears to have negligible influence on the energy period.
Figure 12 shows that including bottom friction in the modeling leads to a slight increase in accuracy (greater R2) for
both the modeled wave power and energy period, with only minimal additional computational effort. This was also confirmed by looking at the TS validation criteria, where the random and systematic errors both decreased when bottom friction was included. Hence, including this parameter in the simulations is recommended, especially for sites located in water depths shallower than at Station Beverley. It should be noted that the importance of bottom friction is expected to be greater for sites fronted by long and shallow foreshores, and especially when the seabed is rough and/or permeable.
A)
B)
FIGURE 9.COMPARISON OF MEASURED AND MODELED WAVE CONDITIONS AT STN BEVERLEY, WITH AND WITHOUT SIMULATION OF
WAVE BREAKING: A)HM0; B)J; C)TE
FIGURE 10.INFLUENCE OF MODELING WAVE BREAKING ON PREDICTIVE SKILL FOR WAVE HEIGHT, OMNI-DIRECTIONAL WAVE POWER AND
ENERGY PERIOD
FIGURE 11.MEASURED AND MODELED WAVE CONDITIONS AT STN BEVERLEY, WITH AND WITHOUT SIMULATION OF BOTTOM FRICTION: A)
HM0; B)J; C)TE
FIGURE 12.INFLUENCE OF MODELING BOTTOM FRICTION ON PREDICTIVE SKILL FOR WAVE HEIGHT, OMNI-DIRECTIONAL WAVE POWER
AND ENERGY PERIOD
A) B) A) B) C) C)
The final sensitivity parameter to be considered in this article concerns the influence of including triad interactions in the SWAN model. Triad interactions are considered to be important in shallower water for steep waves. The IEC TS stipulates that triad interactions are “required to be considered” at the reconnaissance stage. From Figure 13 it can be see that including triad interactions in the SWAN modeling has negligible influence on the prediction of wave height, wave power and energy period time histories at Station Beverley. These results suggest that triad interactions need not be included when performing reconnaissance stage assessments in deep and intermediate water depths, despite the recommendations of the TS. However, a larger data set with results for additional months is currently being created and analyzed to confirm this preliminary conclusion.
FIGURE 13. MEASURED AND MODELED WAVE CONDITIONS AT STN BEVERLEY, WITH AND WITHOUT SIMULATION OF TRIAD INTERACTIONS: A)
HM0; B)J; C)TE
Figure 14 shows the R² values for the three different wave resource parameters (Hm0, J, and Te) obtained with and without
triad interactions. It is clear that including triad interactions in
the SWAN modeling yields no additional accuracy at the reconnaissance stage for this site, but there is a small increase in computational cost. As with wave breaking and bottom friction, the importance of including triad interactions may be greater for other sites, particularly sites in shallow water depths, or at higher stages of resource assessment. These processes should be included whenever their influence has a noticeable impact, but they can be excluded when their influence is negligible.
FIGURE 14.INFLUENCE OF MODELING TRIAD INTERACTIONS ON PREDICTIVE SKILL FOR WAVE HEIGHT, OMNI-DIRECTIONAL WAVE POWER
AND ENERGY PERIOD
CONCLUSIONS
This article presents preliminary results from a multi-year study focused on appraising the suitability of the new IEC technical specification (TS) for the assessment of wave energy resources through a comprehensive pilot application of the TS to a portion of the Pacific Ocean off the west coast of Vancouver Island, Canada. The aim of this research is to investigate whether real-world application of the methods and procedures specified in the TS will lead to resource assessments of the desired reliability and precision. This project also aims to investigate the main sources of error and uncertainty associated with assessing wave energy resources using the IEC framework, and to determine the sensitivity of the resource assessment quality to numerous choices within the TS.
Preliminary results indicate that the TS can be applied with a moderate level of effort to develop reasonable assessments of wave energy resources. For the site of interest considered in this article, it was found that the precision of the resource assessment was sensitive to certain factors such as the manner in which winds were included in the wave modeling, and whether bottom friction was included, but that including both triad interactions and depth-limited wave breaking did not impact the accuracy of the resource assessment. Additional research to assess the performance and suitability of the IEC TS is ongoing and will be presented in future articles. Future
A)
B)
research will also focus on developing recommendations for future versions of the IEC TS and for creating a user’s guide.
The precision of a resource assessment is sensitive to a large number of factors and variables, including the resolution of the model grids used to simulate the wave conditions. Plentiful high-quality input data, reliable field observations, sophisticated modeling tools, and careful attention to detail are essential in order to achieve resource assessments having a high level of precision and accuracy.
ACKNOWLEDGMENT
The authors gratefully acknowledge financial support from Natural Resources Canada, delivered through the eco-Energy Innovation Research and Development Fund.
REFERENCES
[1] International Electro-technical Commission, 2014. Wave Energy Resource Assessment and Characterization. IEC/TS 62600-101.
[2] Cornett, A., M. Toupin, S. Piche, S. Baker, I. Nistor, 2014. Appraisal of IEC Standards for Wave and Tidal Energy Resource Assessment. Proc. 2014 Int. Conf. on Ocean Energy, Halifax, Canada.
[3] Folley, M., Cornett, A., Holmes, B., Lenee-Bluhm, P. and Liria P., 2012. Standardising resource assessment for wave energy converters. Proc. 2012 Int. Conf. on Ocean Energy (ICOE), Dublin, Ireland.
[4] IEC/ISO Guide 98-3: 2008: Guide to the expression of uncertainty of measurement and/or the ASME Standard for Verification and Validation in CFD and heat transfer 20-2009.
[5] Roberston, B., Clayton, H., Buckham, B., 2014. Characterizing the near shore wave energy resource on the west coast of Vancouver Island, Canada. Renewable Energy. 71: 665–678.
[6] Hiles, C., Buckham, B., Wild, P., Robertson, B., 2014. Wave energy resources near Hot Springs Cove, Canada. Renewable Energy. 71: 598–608.
[7] Cornett, A., Zhang, J., 2008. Nearshore Wave Energy Resources, Western Vancouver Island, B.C., National Research Council Technical Report CHC-TR-51. Ottawa, Canada.
[8] The SWAN Team, 2013. SWAN User Manual. Delft University of Technology. The Netherlands.
[9] Buckham, B., 2013. The West Coast Wave Initiative - A Strategic Approach to Wave Energy Development. Presented at the Marine Renewables Canada Annual Conference, Ottawa, Canada, November 2013.
[10] CHC-Canadian Hydraulics Centre, National Research Council, 2011. Blue Kenue Reference Manual.
[11] National Oceanic and Atmospheric Administration. On the WWW. ftp://polar.ncep.noaa.gov/pub/history/waves. [12] Tolman, H. L., 2014. User manual and system
documentation of WAVEWATCH III version 4.18. NOAA / NWS / NCEP / MMAB Technical Note 31.