Charles Thomas Avedisian B.S., Tufts Univ ers it y
1972
Submitted in Partial Fulfillment of the Requirements for the
Degree of Master of Science at the Massachusetts Institute of Technology January, 1974 Signature of Author...-..-. D9p,.tment an ary 25 0 .-. 0 0 * . .. 0 0. ... 0 .0 0 *. 0 0 0 .0 0.0 . 00 00 0 of Mechanical Engineering 1974 Certified by. .,0-.. . ... * .* -- 0 0 0 000 0 0 0 0 0 0 0 0 0 0 0 0 0 Thesis Suipe 1 ? r Accepted by...0... .0. *... ... ... 000000 .0
Chairman, Departmental Committee on Graduate Student §
Archives
APR 1 1974
ABSTRACT
Title of Thesis: Critical Heat Flux in Countercurrent Flow. Name of Author: Charles Thomas Avedisian
Submitted to the Department of Mechanical Engineering on January 25, 1974 in partial
fulfillment of the requirements for the degree of Master of Science.
The results of an experimental program are presented whose purpose was to determine a correlation for Critical Heat Flux -(CHF) in countercurrent flow. The principlei geometry examined was that of a vertical internally heated annulus with a variable
outer shroud diameter. Some data was also taken for flow inside a vertical round tube. Using saturated Freon 113 at atmospheric pressure as the working fluid, the results showed that counter-flow CHF could be uniquely determined by the void fraction, the void being determined from the total measured pressure drop across
the test section. The effects of geometry (varying outer shroud diameter) and flow direction (upflow and counterflow) on CBF were found to be insignificant as long as CBF was correlated with the void fraction. Also, it was found that for voids less
than approximately
40%,
counterflow CF was nearly independent of void and could be approximated by pool boiling from a verti-cal surface.In the high void region (greater than around 80%) CHF cor-responded to flooding, while for voids less than 80% burnout occured as a result of a hydrodynamic instability and was
ac-companied by the onset of film boiling. In the high void region, significant pressure and flow oscillations were observed indi-cating that void measurements were somewhat fortuitous there.
The effects of liquid velocity and flow direction on CF are separately noted, and the limits of the counterflow region defined.
Thesis Supervisor: Peter Griffith
for whom it was a privilege to work, for his consistent encouragement and advice given throughout the course of this investigation.
He also thanks Mr. J.A. Calogerro of the Engineering Projects Laboratory for advice and help given in all phases of the construction
of the apparatus.
The helpful suggestions made by Richard Smith regarding the presentation of the results, and the advice given by David Plummer at various stages
of the apparatus construction, are acknowledged.
Finally, the financial support provided by the Yankee Atomic Electric Company is gratefully acknowledged.
Table of Contents Abstr act .,...,....** * ... * 0 0 0 . .. 0 0 0 0 .0 0 0 0 0. . .0 0 0 00 Acknowledgements . *.. .. ... ... 00 .. * * .. .* 0 0..0 . * . 0 . . . . * * ..o .3 List of Figures... .*..*... **... .. .. ** *.* 5 Nomenclature. 0.0 000 0.0 ,0. 0 * 0 0.. . 0.0 0 0.0 0.000 0 0. 0 ..... * 6 CHAPTER I: Introduction. ... *..* o* * .... 0. 0 .0 .7 1.1 Background of the Problem...7
1.2 Countercurrent Flow...,,... 1.3 Flooding... 0**...0 0... *10
1.4 Critical Heat Flux. ... o.... ... 11
1.5 Work of Others.. . .. ... 12
1.6 Scope of Research... .0. 0.0. . 0 .. 000000 00 .. 0. . 16 CHAPTER II: Experimental Progra. ... ... 19
2.1 Test Section Geometry...,...19
2.2 Choice of WorkingFli...2
2.3 Description of Apparatus and Flow Loop... o ..24
2.3.1 Test Section and Test Tank...27 2.3.2 Instrument at ion... 00 .0 0 0.0.0 00 .0..0. .. 30
2,.4 Experimental Procedures... .32
2.5 CaF Detection... ... o... ... 3..34
2.6 Reproducibility of Data..*...35
CHAPTER III: Results...37
3.1 VoidFraction and Pressure Drop...37
3.2 Flooding... ... *. 0 . . . . .0 .. 0 0 00 . .0 ..0. . .45 . *
3.3
Geometric Effects onCounterflow CHF...493.4 Critical Heat Flux and Void Fraction...53
CHAPTER IV: Conclusions and Recommendations...57
4.1 Conclusions... s.0... ... o.... ... 57
4..2
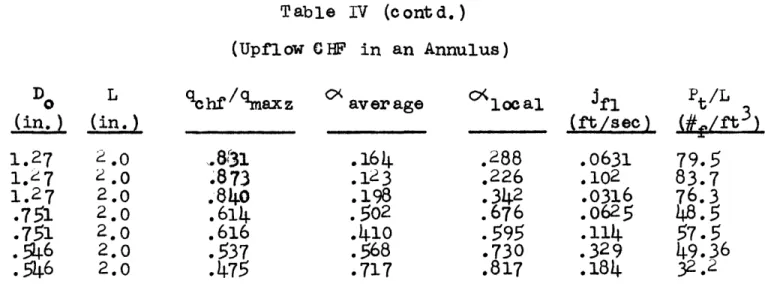
Recoimmendat ions 0 ... 0..0...0 ... 0 0 .... @0 ...6 59 Appendix A: Tables III and IV...*...61Appendix B: Experimental Program to Determine ClBP Inside.64 a Vertical Round Tube B.1 Explanation of Apparatus Design....,... 64 B.2 Experimental Proceduwe and Brief Discussion...67
of Errors References.,...00 ... . ... ... ... 0 0 0.00..70
List of Figures Figure Figure Figure Figure Figure Figure Figure Figure Figure Figure Figure 1 2
3
4
5
67
8 9 10 11 Figure 12 Figure Figure Figure Figure Figure Figure Figure 13 1)4 15 16 1718
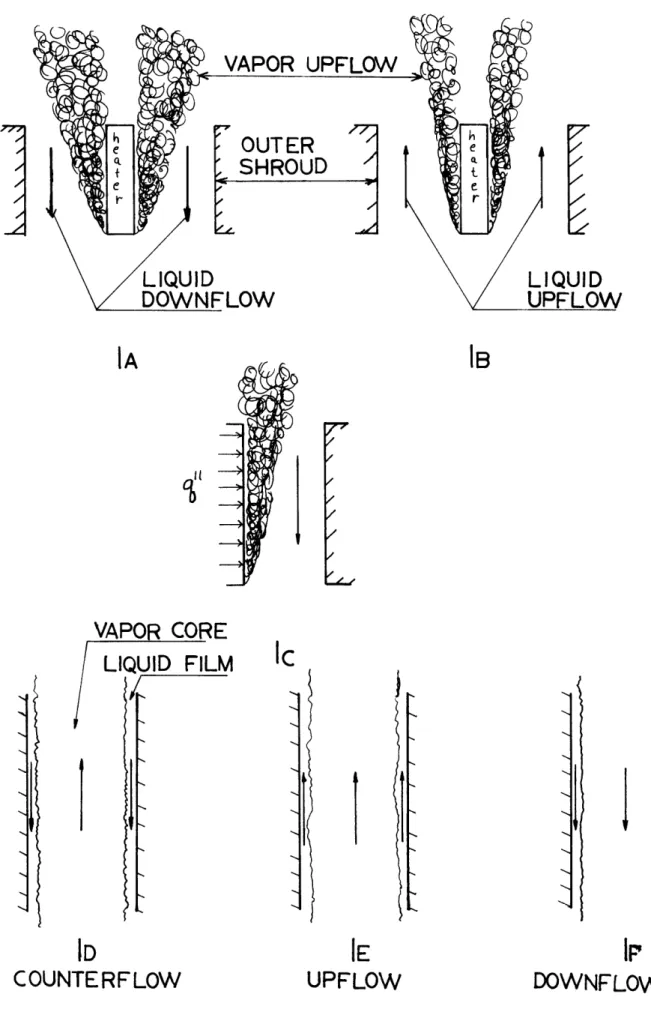
19- Observed Two-Phase Flow Patterns... .. .. ... ... ...72
- Operational Regions in Two-Phase Flow. ... .. .. ,.. .73
- V eloc it y Flux Plane (Zuber -Findlay gr aph) . ... ,.. , 74
- Relat ive Magnitude of C BF in an Annulus and...75
a Round Tube
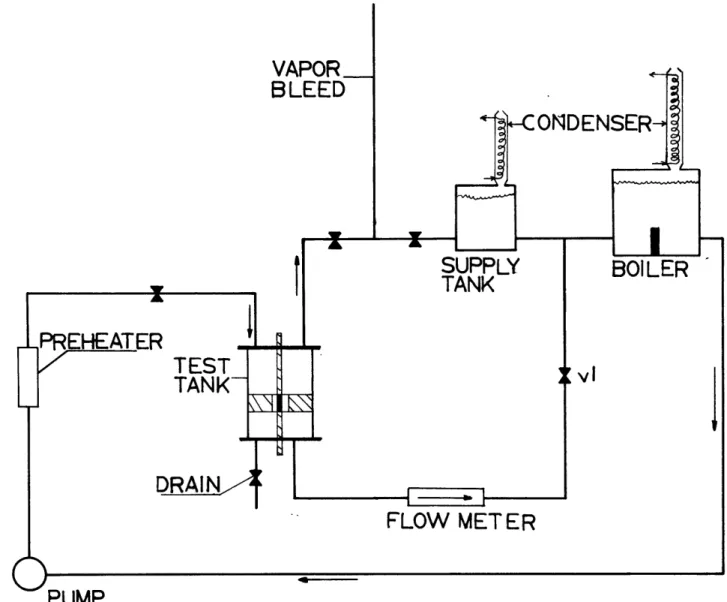
- Schematic of Counterflow Loop...76
- Schematic of Upflow Loop... .77
-Schematic of Duct Flow Loop... ... 78
- Photograph of Test Section and Entire Apparatus.. .79
- Schematic of Test Tank andTest Section...80
Relation Between Pressure Drop and Void Fraction. .81
- Relation between Pool Boiling in Water and Freon..82
113 at Elevated Pressures (using eq. 21)
- Comparison of Voids Predicted from Pressure Drop .83
Data to Voids Predicted from the Drift Flux Model.
- Range of Data Taken in relation to Flooding ..... ..84
-Effect of Heater Size on
CHF..o...
... 85Effect of Varying Outer Shroud Diameter on CBF....86
- Effect of Liquid Velocity on CHF/...,...87
- Effect of Liquid Velocity of Void Fraction...
.88
- Variation of CHP with "in place" quality (eq.
42).89
- Relation between Void Fr action and Counterflow.... 90Nomenclature
A - total flow area
(A
g-f/A~)
A g - vapor flow areaA+ liqinid flow area
- heater diameter
Do '.outer shroud diameter
- acceleration of gravity (4+/s)ec) a< - convers ion fract or (# ~4 - Sa 4)
-fS - latent heat of vaporization
H
- characteristic heater dimension (eq.41)
J%
- superficial vapor velocity (-4+lec)d4
- superf ic ial liquid veloc ity (4/Sec)I)P 63 - constants appearing in eq. 30
L - heated length
P - pressure
- power (6tu/Av)
- heat flux (8/.wv--44')
- heater resistance (electrical) (ohms)
- actual velocity (as opposed to superficial velocity) -t-/r e LkJ - vapor drift velocity (eq. 13)
V
- volume Greek:0(- roidvfradtion
0-
surfact tension ($0/4+)
w- wall shear stressLP-
dens it y- electrical resitivity
- kinematic viscosity
Subscripts
9-
- vapor mL-( - pool boilingX - cross section predicted from
eg. 21
- li(Wid M - momentum
- inlet - fr ict ion
Two phase countercurrent flow with vapor flowing up and li-quid flowing down is an important condition which is likely to occur during a loss of coolant accident (LOCA). During a LOCA, an instantaneous break of a particular size occurs in the pipe which feeds the coolant to or from the pressure vessel. This
results in a rapid depressurization of the reactor core,
typical-ly from around 2 200psia to atmospheric pressure in matter of
se-conds. During this depressurization, the flow is likely to verse several times in a matter of seconds, creating in some re-gions of the fuel bundle, areas where the liquid and vapor will be flowing in opposite directions - countercurrent flow (the
li-quid will be flowing down and the vapor flowing up). It is this possibility of countercurrent flow during flow reversal in a LOCA which determines the importance of understanding the fluid
mecha-nics and heat transfer of this two phase flow condition.
There are other physical situations in which countercurrent flow is of importance. Among them are flow in Wickless heat pipes and film cooling of vertical fuel rods.
1.2 Countercurrent Flow
Countercurrent flow is driven by buoyancy forces due to the density differences between the gas and liquid phases. A very simple example of counter flow is simply boiling off a flat plate vertically oriented in the vicinity of an unheated surface Afig.lc) with the counterflow being due to the upflow of vapor
dis-principle geometry examined here). Fig.la illustrates the ob-served flow pattern in counterflow, while fig.lb shows the up-flow pattern. It is seen that a liquid film is postulated to be present on the heated surface (difficult to see experimentally, however) as well as the unheated surface, and that the upflow of vapor occurs in the region between. In fig.ld counterflow inside
a vertical tube is whown with the liquid flowing down the tube wall and the vapor up the center core (the annular flow regime).
Shown also in figs.le and 1f are the phase separation and flow
directions of upflow and downflow respectively. It is seen in these illustrations that the main difference in upflow, downflow, and
countercurrent flow is simply the direction in which the phases are moving. These flow configurations are related in that at certain liquid an% vapor velocities, upflow, countercurrent flow, or downflow can occur.
In any two phase flow system with: heat addition, the void fraction (volume of vapor divided by total volume) is of great importance because it describes how much vapor (or liquid) is present in the system. By definition,
0(= 1/
1.
For convenience in two phase flow analysis, it is customary to use what are known as "superficial" velocities (j) rather than true velocities (u). The superficial velocities of the vapor and
liquid respectively are found by dividing the measured volume -1-ow rate by the total flow area:
assuming only vapor or liquid is flowing in the total flow area. The superficial velocities are related to the true velocities of the liquid and vapor, uf and u respectively, through the void fraction as follows:
Ja=
c(G4
and J- id
5.
The reason for using superficial velocities is that in writing continuity and momentum equations, the true areas of the vapor
and liquid (A and Af respectively) are unknown. Since, g
A-5=
AA
6,and
A+
=-
(I-c)A
7,
knowledge of the void and the total flow areas provides a con-venient base upon which calculations can be made.
The-volumetric flux density,
j,
is defined as the vectorial sum ofj
and jf:J = J, +J
.
The sign convention used is that the velocity is positive upward for a vertical geometry. Hence, for both phases flowing up
(up-flow), j j
+
(note that the quantities in eq. 9 are scalars). For both phases flowing downward,
.
j-
... J; 10(downflow). And fdr vapor flowing up and liquid flowing down c ountercurrent flow),
-A- Jr
11.
It is clear from eq. 11 that the counterflow region can be de-fined in two ways. The first is that eq. 11 as it stands defines countercurrent flow. That is,
jf
< 0. Then,j
can be either posi-tive or negaposi-tive and still be in the counterflow region. The se-cond definition, attributed to Zuber et. al. (2),, is a further restriction on the first definition. Namely that not only mustif be less than zero (liquid flowing down), but
Iif1must
begrea-ter than
jj.
Hence only those conditions which: 1) have liquid
flowing down and vapor flowing up; and 2) have I
ifI
>I
igj
so that
j in eq, 11 is negative are condidered to be in countercurrent
flow. This can be more easily seen by considering fig. 2 which shows the operational regions of two phase flow (reproduced from reference 2). In region I both up and counterflow can exist since
eqs. 11 and 9 with I g > lifigive positive j (j is positive).
In region II Zuber's definition of counterflow applies where
I
ifI
>I
lg
Iand hence j is
negative (eq.
11) while
jg
is still
posi-tive. Finally in region III, the vapor flow has reversed its dir-ection and is now flowing downward in the direction of the
li-quid flow (jf is negative from the sign convention), and hence both
j
as well asj
are negative. This is the region of downflow (eq. 10). Fig. 3 shows that all the counterflow data taken fell in region I, and that the liquid velocity was not high enough to causej
to be negative (j was always greater than jf).1.3 Flooding
Common to all countercurrent flows is that at high vapor or liquid flow rates, the surface of a liquid film becomes
increas-point at which the pressure rises sharply in the tube (or annulus) with the slightest increase in gas velocity and the liquid be-gins to move in the direction of the gaas flow - flow reversal (3).
Hewitt and Hall-Taylor (4) define flooding as the transition to a region in which both climbing and falling film flow are occur-ing simultaneously. In any case flooding is determined by both the liquid and gas velocities. At any given gas rate, there is a definite liquid rate at which the column will flood and vice-versa. Hewitt and Hall-Taylor (4) have pointed out that the
in-terfaciti shear stress exerted by the gas phase on the liquid film is usually insufficient to cause flow reversal, and that the in-terfacial shear does not significantly influence flooding phe-nomenon.
Flooding can result in either a flow reversal, liquid hold-up, or a flow regime change. In this study flooding corresponded to large pressure fluctuations in the annulus geometry, and for the limited round data taken, to a flow regime change preceeded
by a very turbulent, jiggling, motion of the liquid. These large
pressure fluctuations occured only at high void fractions
(usual-ly greater than 80%).
1.4 Critical Heat Flux
The critical heat flux (CHF) is defined as the maximum in the heat flux (q/A) versus temperature curve (the boiling curve). This --- onditionc*echaracterized by a vapor blanket covering the heated
large temperature excursion. Alternatively, this condition can also be called departure from nucleate boiling (DNB) since nu-cleate boiling usually exists on the heated surface prior to the vapor film formation. The term "burnout" is often applied to
the critical condition and implies a physical destruction of the heater. Since physical burnout never actually occured in this study, CHF is the term used to describe the limiting heat flux.
Since CHP is accompanied by a rapid wall temperature excur-sion, information on the value of the heat flux immediately
preceeding this condition is of great importance. One purpose
of this study was to collect enough data to arrive at a correlation for counterflow CHF.
1.5 Work of Others
Any paper dealing with flooding phenomenon is concerned with countercurrent flow. In the literature there exists many studies on flooding (e.g., Hewitt and Hall-Taylor (4) in their flooding analysis give a good survey of the literature). Little has been written, however, on counterflow CHF or, for that matter, on
heat transfer in countercurrent flow. Dukler (5) numerically solved the governing equations for a film of liquid falling down a vertical heated surface for the velocity distribution and film thickness. Schumann (6),and Griffith,Schumann and Neustal (7)
studied burnout in closed end vertical tubes with the flow rates of liquid and vapor equal at the test section exit (continuity),
flow. In their study CHF was thought to be due to liquid hold-up (flooding) and an attempt was made to verify this by e.omparing vapor velocities measured in separate flooding experiments with vapor velocities calculated from the CHF experiments assuming
equilibrium flow, i.e.,
j
=
q" As. 12.Schuman (6) was only able to conclude that, to an order of mag-nitude, the vapor velocity neccessary to cause flooding could be used to calculate the burnout heat flux using eq. 12. CHP in his experiments was due to liquid starvation arising from flooding at the mouth of the tube. It is important to point out in Schumanns study that he recognized that the motion of the two phases in op-posite directions played a definite role in the burnout of ver-tical tubes closed at the bottom. Countercurrent flow in the exi-periments of Schumann occured as a result of the rising vapor
at the mouth of the tube displacing downward the same Weight flow of liquid. Also, his experimentswere conducted inside tubes which he recognized as producing a very turbulent counterflow motion
of liquid and vapor which resulted in some ambiguity in data
measurements. Similar problems were also encountered in the CHF experiments conducted inside a vertical tube in this program. For the most part CHP experiments reported here occured as a result
of a critical wall flux being exceeded and not a critical vapor flow rate out the mouth of the tube as in Schumann's experiments.
Shires, Pickering and Blacker (8) studied CHF in film co-oling of vertical electrically heated rods enclosed in a larger diameter shroud (essentially an annulus) in which liquid hold-up
(the condition in which a violent disruption occurs on the boun-dary of a liquid film falling onto a hot surface, essentially
stripping the liquid from thavheated surface altogether) were found to cause burnout in their experiments. They correlated CHF with the liquid flow rate at the entrance to the test section and
found that for very low flow rates (less than .Ol# m/sec for wa-ter) CHF was essentially a film dryout phenomenon, while at lar-ger rates burnout was due to liquid hold-up cattsied by flooding in the annular gap. This at least qualitatively agrees with the
findings of Schumann (6) and it should be expected that flooding will play a part in counterflow CHF, at least in some range of flow rates (or void fraction, etc.). Shires, Pickering and
Black-er also developed a flooding correlation for a vBlack-ertical annulus in which they found that tube length had an insignificant effect on flooding. Flooding in their work was defined as the vapor
velocity which caused the liquid film to be stripped off the-heat-ed surface.
Recently Sakhuja (9) examined the role flooding plays in
CHF in wickless heat pipes. The geometry of the wickless heat pipe
is very similar to that of a closed end vertical tube open at the top to a large reservoir, the geometry examined by Schumann. Again, counterflow was eaused by the rising vapor displacing down-ward the same weight flow of liquid. Using Dowtherm A as the working fluid, Sakhuja found that the maximum heat flux was con-strained by flooding. Specifically he expressed his flooding
cor-equation represented theo limiting factor of the range of data taken, and that CHF predicted by the flooding constraint agreed with experimental results. Sakhuja also compared the film
boil-ing constraint (hydrodynamic instability) to floodboil-ing and found that for his data flooding was the limiting consideration (i.e.,
CHF due to flooding would occur before a hydrodynamically induced
C HF).
Several methods exist in the literature for calculating coun-terflo void. Most of the correlations are expressed in terms of superficial velocities. Wallis (1) solved the momentum equations for a vertical falling film, assuming laminar flow, and related the film thickness to the void fraction. Zuber and Findlay (10) developed the Drift Flux Model for determining void, tha. results of which could be applied to any flow regime (slug, bubbly, an-nular) in any flow configuration (upflow, downflow, or countercur-rent flow). The results were expressed in terms of the volumetric flux density (eq. 8) and the vapor drift velocity defined as,
Lkgj =(us
-Qf)
0-,oo=k
1
kj~
13where Griffith has shown that kisk3 is approximately .35 (to be
discussed later) as shown in reference 11. Zuber (2) determined expressions for ugj appropriate for the slug, bubbly, and
an-nular flow regimes. Griffith (11) determined that as long as gravity and inertia forces donimate ugj assumes the form shown '&r-the far right hand side of eq. 13. In any case, by observing
terflow void fraction. This has been done and thb-results will be discussed,
1.6 Scope of Research
The void fraction as defined by eq. 1 gives a direct measure of the amount of vapor , and hence liquid (1 - o, present in a system. Liquid serves as the cooling agent. Reducing the amount of liquid (i.e., the liquid fraction) will also reduce the cri-tical heat flux. The assumption is then that CHF can be correlated with some parameter which gives a measure of the amount of
cool-ant present. Either the flowing quality or the void fraction pro-vides such a measure. But since in countercurrent flow the void
is well defined while the flowing quality(vapor flow rate dividedi
by total flow rate) is not, void fraction was thus the correlating
variable used in counterflow CHF. This heuristic argument formed thebasis for this investigation - to determine what the relation was between C HF and void.
Specifically the purpose of the program was to
experimental-ly determine the following:
1) a correlation for CHP and void fraction in countercurrent
flow;
2) the limits of the counterflow region in terms of liquid and vapor velocities;
3) the relation between counterflow CHF and pool boiling
4) the void range at which counterflow CEF could be
ap-proximated by pool boiling from a vertical surface;
5)
how well void fraction could be computed from pressure drop data, and how measured voids compare to those calculatedus-ing the Drift Flux Model appropriate to countercurrent flow; and 6) how counterflow CHF compares or is related to CHF in up-flow or downup-flow.
To determine the above, the following parameters were varied:
1) the outer diameter of the vertical annulus, holding the diameter of the internally heated cylinder constant;
2) test section length (L in fig. A) and 3) liquid velocity.
The range of operation and test section parameters were the following:
Heated lengths - 1.0 and 2.0 inches;
Liquid mass flux out of test section - 0 to 3.0x10
5#
/hr-ft2 (or 0 to .50ft/sec); Outer shroud diameter - .474in. to5.375
in.;Heater diameter - .40in. (o.d.);
System pressure - approximately latm.; Power - direct current heating ;
Heater material - Inconel 600.
It is to be noted that the liquid velocity specified above is the velocity leaving the annulus (jf in fig. A). This velocity is much easier to vary and measure than the inlet velocity (jf2 in
fig. A) because at the inlet to the annulus, a two phase mixture is present while at the outlet only the single phase liquid is present. The inlet liquid velocity into the test section cannot
be measured a priori using conventional flow meters, but the flow rate out of the test section where only single phase li-quid is present can be measured and kept constant while taking data. In cocurrent upflow experiments the characteristic li-quid velocity is usually the lili-quid entering the test section where single phase liquid is always present. In vertical
counter-flow the characteristic velocity is the velocity at the liquid exit.
CHAPTER II EXPERIMENT AL PROGRAM
2.1 Test Section Geometry
The principle geometry examined here was that of an in-ternally heated vertical annulus. Of course both walls of the annulus could have been heated, but the internally heated annulus simulated adequately the geometry of an isolated fuel rod
in-side a reactor pressure vessel. More specifically, the cornet rod in a rod type fuel bundle is best modeled by a vertically oriented annulus. The problem then was to isolate the boiling characteristics of a single rod and determine to what extent the void fraction could be used to predict CBF in this geometry.
Compared with all other possible fuel cell geometries, the annulus has the highest and in fact the limiting ratio of
unheated to heated surface area (12). It should there-fore give the lowest CHF value since burnout has been found
to be reduced in the presence of an unheated surface. Lienhard and Keeling (13) pointed out that a flat ribbon heater in natural convection boiling induced strong side flows and that when these side flows were blocked by vertical walls, CHF was much lower than when the side flows were allowed. Also, Becker and Hern-borg (14) reported that CBF values in an internally heated ver-tical annulus in upflow were lower than in round tubes or in a
dual heated annulus (both internal cylinder and outer shroud heated). They attributed this difference to the fact that only
pared to other geometries. This is a desirable chatacteristic of this geometry.
In all experiments run, countercurrent flow was set up by the action of rising vapor produced from boiling on a heated surface flowing against a down current of liquid, the down cur-rent being either forced or induced (what Tong (15) describes
as a natural circulation loop).
A program was also run to determine counterflow CHF in a
round tube. The geometry tested was actually an extension on the work performed by Schumann (6) in that the vertical tube was opened at the bottom to permit a net down flow of liquid (when there is no not liquid flow out of the test section - natural convection counterflow boiling - the flow picture is the same as that reported in reference (6)).
The problem with the round tube geometry is that (as Sch-umann verified) with smaller tube diameters (around .50inch i. d.)
flooding is the main cause of CET. That is, low void steady-state CBF data is difficult, if not impossible, to obtain in small diameter tubes. In fact, in order to eliminate the ef-fects of flooding in the round tube experiments (reported in
Appendix B), it was neccessary to have the heated lengths so short that end effects predominated. In any case the flow pat-tern set up in a round tube is one of an annular type flow with a jittering rough liquid film flowing down the tube wall. This
splashing on the heated surface. The result is that CHF as a film boiling phenomenon never occurs. The results of the round tube program nevertheless qualitAtively agreed with the fact that
in the low void region, CHF is usually a result of a hydrodyna-mic instability, while in the high void region (greater than
around 80%) both flooding and film dryout are possible CHF mech-anisms. Also, the results of the round tube program did show that CEF in an annulus was indeed lower that CHF in a round tube. 2.2 Choice of Working Fluid
If one desires to properly simulate the conditions in a reactor core at the onisetof a LOCA, a full scale cluster of electrically heated rods contained in a vessel capable of sus-taining pressures of around 1000psia would have to be built. The
size, high pressure, and power requirements of such a rig would be costly and bulky to operate. For this reason it is desirable to consider the design of a small scale apparatus with lower
power requirements. The criterion which determines the size of this apparatus is governed by the working fluid. Also the tility of the results obtained from the model apparatus depends
on the accuracy of scaling laws which relate the model data to water data obtained under "timilar" conditions but at higher
pres-sure. Freon 113 was chosen as the working fluid because such laws are known, it is safe to work with, and its latent heat of
vaporizarion is relatively low at atmospheric pressure.
While it is not intended here to give a detailed explana-tion of Freon 113-water scaling, a brief discussion follows il-ustrating how the pertinent dimensionless numbers might be
u-tilized to design a model apparatus.
Well known dimensionless groups for scaling were developed
by Zuber (16) assuming equilibrium flow in circular tubes. The
continuity, momentum, and energy equations were linearized and the following dimensionless groups resulted from the analysis:
T = A /W% density ratio 14.,
Z
L /D
15,
Vr = AL/. ratio of vapor drift 16,
velocity to inlet liquid veloc ity
Re
=L..
Reynolds number based on 17,saturated single phase liquid flow
Fr L/ iL Froude number 18,
Sc 4 .. )( subcooling numb er 19,
and P (?"4L phase change number 20.
T, the density ratio in eq. 14, is a measure of the system pres-sure, Pc represents the amount of vapor generated (assuming equilibrium flow). So is a measure of the degree of Lblet subcooling. And Vr is a characteristic of the flow regime.
Orowley and Bergles (17) showed how the above groups could be used as appropriate scaling laws for modelling an apparatus with water as the working fluid by one using Freon 113 with the
power requirements while still maintaining similar dynamic and thermal behavior. In this scaling procedure, the model and pro-totype are geometrically similar since this would help insure that the flow regime is similar. The procedure they used is
detailed in reference 17. Briefly the scaling was achieved by requiring similarity of the dimensionless groups given in eqs.
34
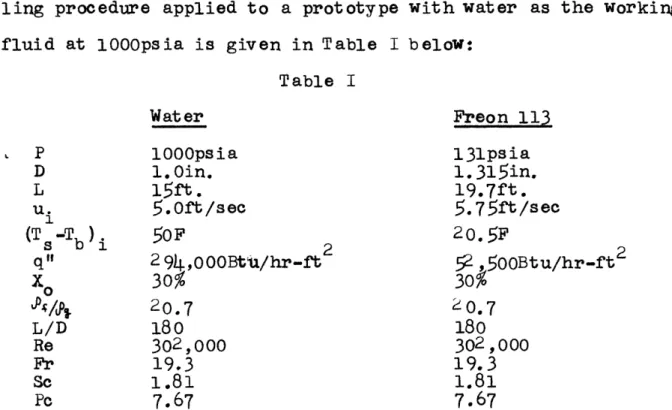
to 20 in both model and prototype. The results of theirmodel-ling procedure applied to a prototype with water as the working fluid at 1000psia is given in Table I below:
Table I Water Freon 113 P 1000psia l3lpsia D 1.0in. 1.315in. L 15ft. 19.7ft. u. 5.0ft/sec
5.75ft/sec
(Ts -T b).50F
20.5F q' 2945,000Bt/hr-ft5,500Btu/hr-ft
I0 30% 30% ,/4 20.7 20.7 L/D 180 180 Re 302,000 302,000 Fr 19.3 19.3 Sc 1.81 1.81Pc
7.67
7.67
From Table I it is seen that the desired scaling has been achieved-a reduction in pressure achieved-and power requirement.
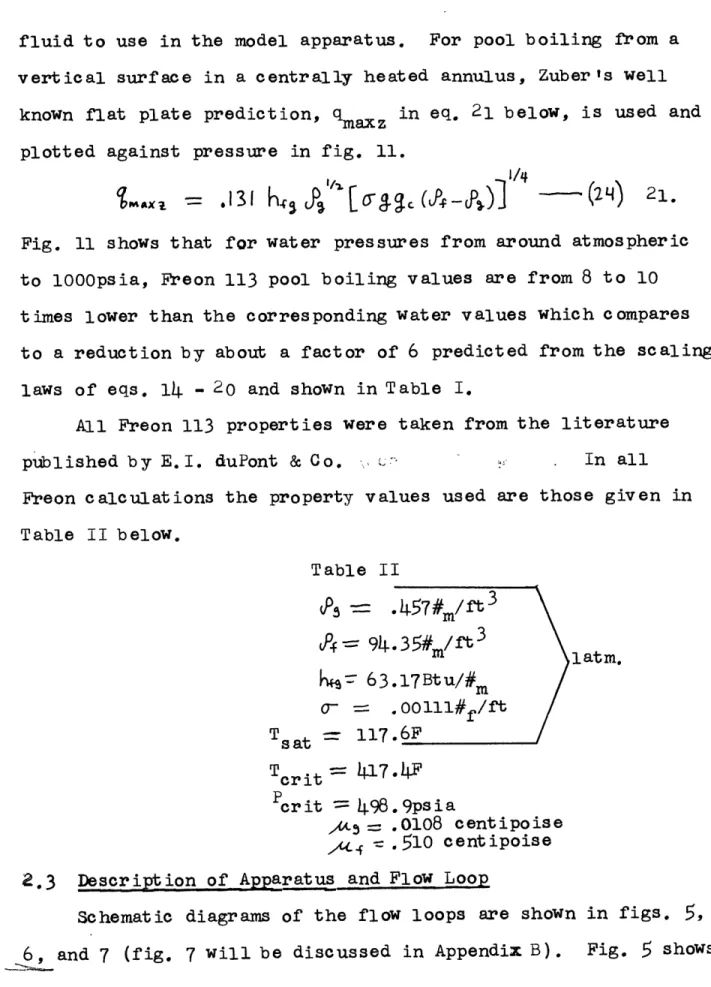
For counterflow in an annulus it has been found that pool boiling from a vertical surface represents an upper limit to CFf. An examination of the relative values of the maximum heat flux in pool boiling for water and Freon 113 can then be expected to give an indication of the power requirements of Freon compared to water and help decide whether Freon 113 would be an appropriate
fluid to use in the model apparatus. For pool boiling from a vertical surface in a centrally heated annulus, Zuberts well known flat plate prediction, qmaxz in eq. 21 below, is used and
plotted against pressure in fig. 11.
'44X
*
131
hkJc5
J.)]1/4 (2 q)21Fig. 11 shows that for water pressures from around atmospheric to 1000psia, Freon 113 pool boiling values are from 8 to 10 times lower than the corresponding water values which compares to a reduction by about a factor of 6 predicted from the scaling laws of eqs. 14 - 20 and shown in Table I.
All Freon 113 properties were taken from the literature
published by E.I. duPont & Co. In all
Freon calculations the property values used are those given in Table II below. Table II dP -== .457#m/ft 3 J= 94.35#m/rt3
ez
63.17Btu/#m
C-==
.00lll#r/ft T=
117.6F TcritPcrit
=498.9psia
,xA .0108 centipoise yft .510 centipoise2.3 Descript ion of Apparatus and Flow Loop
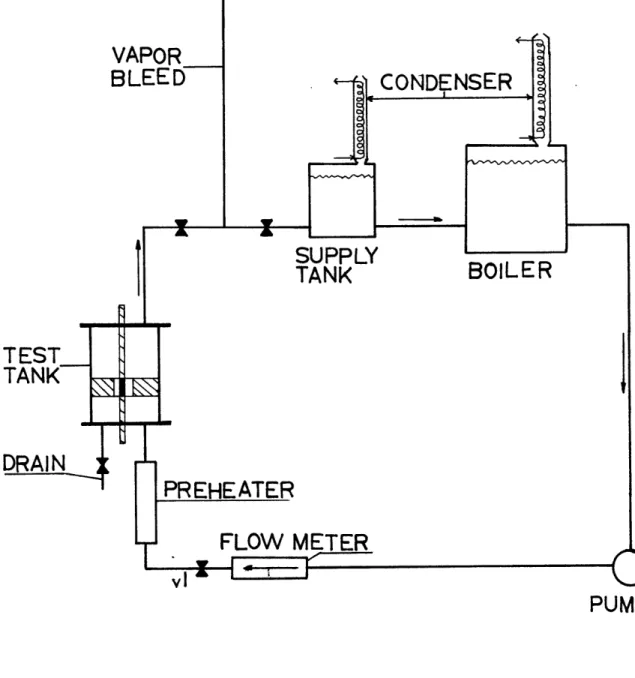
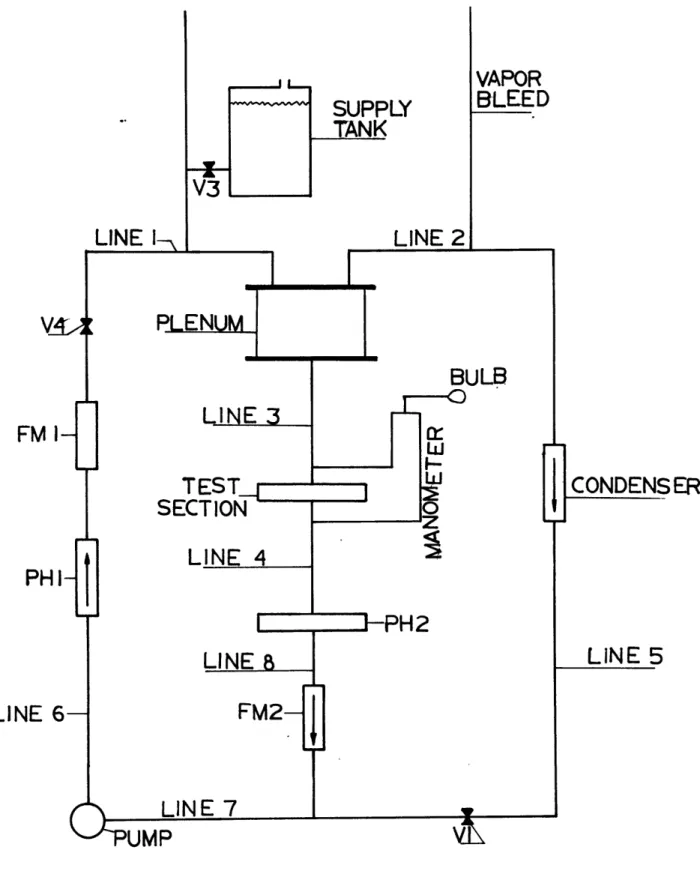
Schematic diagrams of the flow loops are shown in figs.
5,
the loop plumbing for the counterflow experiments, and fig. 6 illustrates the upflow plumbing. Only slight modifications to the counterflow loop were neccessary to reverse the direction of the inlet liquid.
All piping and fittings were inch "poly flow" tubes and
fittings. Flow circulation was provided by an Eastern Industries type P-1 pump. A small wire mesh was fitted inside the pump
inlet to collect particles of dirt, etc. The boiler conlisted of a 10inch i.d. circular steel cylinder. Fitted to the bottom of the cylinder was a Hottwatt (Danvers, Mass.) no. Is754 immersion heater providing the heat required to bring the Freon in the
boiler up to saturation temperature. A Pyrex glass condenser was installed on the cylinder top plate, open to the atmosphere,
and was found sufficient to condense the Freon vapor generated
by the immersion heater.
Rather than directly condense the vapor generated by the test section, a means of simply removing or bleeding the vapor
from the liquid vapor outlet was provided (shown in figs.
5
and6). This method neccessitated that Freon be supplied periodi-cally to the loop to replace the quantity lost by evaporation
(strictly speaking, the loop is not closed). The supply tank served this purpose. When the two phase mixture entered the
sup-ply tank, the vapor would rise and be condensed (or lost to the
atmosphere) by a Pyrex condenser installed at the top. The out-let line of the supply tank was located at the bottom to insure that only single phase liquid would be pumped into the boiler
(the outlet line from the boiler to the pump was also located at the bottom to insure that liquid only would be pumped into the test tank). The supply tank was a 7 inch diameter by l5inch high neoprene clt'cular container with 1/ 2inch "poly flow" fit-tings installed on opposite sides on the bottom.
A preheater was installed at the pump outlet to provide a
fine adjustment of the Freon temperature entering the test tank. This preheater was made from a 1.0inch i.d. by 18 inch long
copper pipe with heating tape (Cenco no.16596-2 , 86watt capacity) wrapped around the surface of the cylinder. The inclusion of
this preheater was neccessary to insure that Freon entering the test tank would be at or close to saturation. It was, however,
neccessary to admit to a certain amount of subcooling in order to avoid boiling in the preheater.
Power to the test section was provided by an L.J. Land & Co. portable d.c. generator. The generator served as a direct cur-rent power supply, as the heater was a resistance type heater. The current to the test section could be regulated through a control console. The volt and current meters provided on the console were not sufficient to provide the desired sensitivity in current readings, however., since the maximum current drawn from the generator was never greater than 350 amps and the meter provided ranged from 0-3000amps. As a result a new 0-350 amp-< Weston ammeter was installed and was sufficient to provide the desired accuracy in current readings (' 2% maximum scale),
all tests were run in the MT Heat Transfer Laboratory. A photograph of the entire flow loop is shown in fig. 8a. 2.3.1 Test Section and Test Tank
Figs. 8b and 9 show a close-up pbhotograph and schematic diagram respectively of the test tank symbolized in figs.5 and 6 (insulation has been removed for clarity in fig.8b). Some difficulty was experienced in the test section design since it was desired to design an annular test section with a variable
outer shroud diameter. The difficulty arose in requiring that the test section be enclosed within and electrically insulated from a container and still provide a means of changing the outer
shroud. The final design consisted basically of two glass cyl-indezo, sandwiched, between three aluminum and brass plate via eight connecting rods. The glass cylinders were 6.0 inch i.d. and
5/16
inch thick. The top and bottom cylinders were 6.0 inches and 2.5 inches long respectively.To provide a means of changing the outer diameter of the test section, a number of aluminum disks,
5.0
inch o.d. with different i.d.'s, were machined with thicknesses equal to the heated lengths examined (1.0 and 2.0 inches). The disks were made to sit on an o-ring which in turn was fitted into a groove cut in an aluminum shelf (see fig. 8b) so that the only flowpermitted was in the annular gap. Two "J" bolts were attached to each disk to provide a means of lifting the shroud out of
the test tank.
tank and the shroud disk could be provided by simply removing a few bolts rather than disconnecting all eight connecting rods and dismantling the entire test tank. The removable top plate was attached to the top plate by eight screws symmetrically tapped around the circumference of the top plate (this can be
seen in the top of fig. 8b). The removable plate was a 1/4 inch thick by
6-5/8
inch diameter aluminum disk. The top and bottom plates were both 3/8 inch thick by 8 inches diameter brass disks with eight 1/4 inch holes drilled symmetrically around the cir-cumference for the 8 connecting rods. The glass cylinders were fitted into grooves cut in the plates and sealed with Buna-nrings.
The aluminum shelf, situated between the two glass cilinders, was designed to provide a "seatt" upon which the shroud disks
could be placed, and to provide the location for the pressure taps (the taps could not be placed in the glass cylinders). This shelf was 2.0 inches thick and 7 inches in diameter with a
5-3/8
inch hole machined in the center to a depth of 1.5 inches (the
shelf). A hole was machined to 4.25 inch diameter to permit
liquid flow out of the annular gap. The glass cylinders were fitted into grooves cut in the top and bottom of the aluminum
shelf and sealed with Buna-n rings.
Three 3/32inch diameter pressure tpas were drilled in the de of the aluminum shelf (sh*Wn in figs. 8b and 9). The bottom
and middle taps were used for pressure measurinents in the 1.0 inch test section (shroud disk thicknesses were 1.0 inch), and the bottom and upper most taps were used in the 2.0 inch heated length experiments (2 .0inch shroud disk). Depending on which
heated length was used, either the top or middle tap was connected to the pressure gage via 1/4inch "pby flow" tube and fittings
(the tap not in use was blocked up).
The bus bar of the resistance heater was electrically in-sulated from the top removable plate and the bottom plate by two nylon bushings attached to the plate and sealed with o-ring seals (clearly visible in fig. 8b). Screwed into these bushings were 1/2 inch "poby flow" straight fittings drilled out to the o.d. of the copper bus ?har and with o-rings used as the seal
in-stead of the plastic ferrel provided. The entire test section assembly was made to fit inside these fittings. A close ex-amination of fig.8b will reveal this design,
The test section assembly consisted of two copper rods, .50inch in diameter and 8 inches long, tapered at each end to .40 inches. The tapered ends were silver soldered to each end of an Inconel 6oo cylinder (.40inch o.d., and .346indh i.d.). For each heated length (1.0inch and 2.0 inch heated lengths) such an assembly was required.
As shown in fig. 9, the heated section is filled with Alg 03
ceramics in which is placed the thermocouple beads. The ther-mocouple leads were threaded through a 1/8inch hole drilled in the top copper bus bar (showh in fig. 9). The only difficulty arising from this design was that each time a shroud disk was
changed, the thermocouple leads had to be disconnected from the multipoint switch to allow the removable top plate to be com-pletely lifted out and away from the test tank to pravide ac-cess to the inside.
The test section assembly was supported in the test tank
by the 1/2 inch ploy flow fittings as shown in figs. 8b and 9.
It should be noticed in fig. 9 that the actual annular geometry is the heated section enclosed within the center hole of the shroud disk. The only flow permitted between the upper and lower plenum of the test tank is through the annular gap.
Also, the only flow permitted to enter or -leave the -test tank is via the liquid-vapor outlet, liquid inlet, -and liquid outlet shown
in fig. 9.
2.3.2 Instrumentation
The pressure across the test section was measured by an in-clined manometer (Ellison draft gage, 0 to 1.5inches). The man!-ometer fluid was Meriam no. 3 fluid having a 2.95 sp.gr. (184#m/ft 3 The manometer was connected to the test tank via a 1/4 inch
"poly flow" tubes and fittings. The pressure was measured by simply recording the height of the Freon-oil interface as meas-ured by the attached scale on the gage body. The pressure could be read to within i.Olinches. The recorded value was subtracted
from the zero initial value with no boiling, and the difference represented the pressure due to boiling. The Freon-oil
inter-face was steady at low voids but somewhat oscillatory in the high void range (greater than 80%). The accuracy in pressure readings in this region was therefore not as great as at lower
voids (pressure oscillations in the high void region could re-sult in as much as a 30% change in void fraction). This high void pressure oscillation was probably due to the onset of
flo-oding.
The basic temperature measurements were made by copper-constantan thermocouples made from 2
4
gage Leeds and Northrupwire. The test section inlet temperature was measured by a thermocouple placed directly in the upper plenum of the test tank via a Gonagaa&k~nglgleind. The heater temperatures were measured by three thermocouples placed on th? inside of the thin walled Inconel cylinder (the heater)., and the space between the thermocouple beads and the inner wall was filled by Al20 3 ceramics to prevent electrical noise in thermocouple measurements.
All of the thermocouples were connected to a common junction
through a multipoint switch. The output appeared on a Triplett model
4
2 35-F digital volt meter. This meter greatly facilitatedtemperature readings in that wall temperature rises could be more easily and quickly detected on the digital panel than on a conventional potentiometer. The meter was initially calibrated to within .01 millivolts.
A Fischer-Porter flowmeter was installed at the test tank
outlet (inlet for upflow loop of fig. 6).which measured the li-quid volume flow rate out the test section. A variety of floats
provided measurement of the test section flows up to 1.3x10⁻³fOt/sec. The meter was calibrated beforehand by measuring the volume of
liquid collected in a specified time. After installation, the re-sultZswere periodically checked against the initial callibration.
and
R
/An,..m
knowing the resistivity, , and current determines q. For Inconel
6oo,A
4.05xl0- 5ohm-inch and is approximately con-stant over the range of heater wall temperatures which were measured in the experiment (72F to 250F). The total heat in-put could also be comin-puted from the voltage drop across the test section, i.e.,~V7
s(3.LA
13) -l 2But since the instrumentation required-'to obtain voltage measure-ment is potentially difficultt6-setyVp(at least in design), eqs. 22auand 22bwere used to calculate the heat input from the measured current.
For the following heater dimensions, the corresponding re-sistances, R, are given below:
i.d.= .346inch i. d.= .346inch
o.d.- .40inch -00116 o o". d. - .40 inch .00257
L =- 1. Oinch L 2. O inch
2,. Experimental Procedure
The critical heat flux may be approached in two ways. In the first method the surface heat flux is kept constant and the
liquid flow rate is gradually decreased until CHF occurs. In the second and more common method, the desired flow conditions
are kept constant while the heat flux is increased till CHF occurs. In this study the second method was used.
boiler immersion heater was turned on to bring the flowing Freon temperature as close to saturation as possible. The ma-nometer lines were checked to make sure that all air in them was purged prior to each run. The Freon temperature was allowed to reach steady state, taking about one hour. Once steady
state conditions had been reached, the preheater was adjusted to bring the temperature of the Freon entering the upper
ple-num of the test tank as close as possible to Freon saturation
temperature. This usually required an additional 15 minutes.
Once the final inlet temperature had been established, the current to the test section was slowly increased in increments of 20 amps.
Between each power setting, the temperature was allowed to reach its steady state value, requiring usually 10 minutes be-tween power increases. At each step in power level, the heater
and inlet temperatures and pressure were recorded. The power was then increased in steps until CHF occured. Once the CHF point was reached, the power was decreased by
40
amps and then slowly increased in smaller steps to get a more accurate heat flux value.When burnout did occur, the power to the test section was quickly turned off. A new liquid flowrate was chosen and the
procedure repeated.
2.5 CHF Detection
The principle way in which CHF was detected was through the use of thermocouples. At CHF a wall temperature rise was
in-dicated by the digital volt meter. This temperature rise was very rapid, reaching nearly 300F in a matter of seconds (the maximum heater surface temperature recorded in steady state was
around 150F). Consequently the digital volt meter was closely monitored during power increases to the test section.
Since the thermocouples were not actually attached to the heater surface, there may initially be some question regarding the time response of the thermocouples to an increase in heater
surface temperature. Cermack et. al (18), in their analysis of burnout in rod bundles.,during pressure blowdown, measured the wall temperature of their electrically heated rods in
essential-ly the same way as in this study - by inserting thermocouples
in the center of each heater tube and then filling the tube with A1203 ceramics. An estimate of the time response of their
thermocouples was demonstrated during their transient tests, and they found that the time response was at most .50 seconds. Since the wall temperature rise at CIHF was very rapid, there was con-sequently no ambiguity in the C HF point.
Interestingly two other ways were found to be a reliable indication of CHF. The first was simply a visual observation of the heater. Prior to CHF the heater was in a state of nucleate boiling. Once film boiling was initiated, a vapor film was sta-bilized on the heater surface which was clearly visible. The
of boiling, the pressure suddenly increased. This increase was thereafter gradual for step changes in power settings. At the onset of film boiling (CHF), however, the pressure quickly
drop-ped and returned to a value very near its initial value. This phenomenon is the result of a reduction of vapor generation at
CHF (and hence void fraction). For the larger shroud diameters
(greater than about .75inch) the pressure reduction was as noted. However, a rapid reduction in pressure at CHF was not observed for the smaller shrouds (smaller than .75inch). This is so be-cause for the smaller shrouds, the void fraction in film boiling
is nearly the same as the void in nucleate boiling with the result being that a pressure change will not quickly occur at the onset of film boiling.
2.6 Reproducibility of Data
For each CBF point three runs were made to determine data reproducibility. The average of the three fluxes obtained was taken to be the CHF value for the particular flow conditions existing. In all runs the maximum error in CHF was
15%.
Pressure measurements showed greater error for some shroud diameters. For the larger shroud diameters (greater than
.75
inch) the pressure measurements were satisfactorily reproducible, usually to within at least ±10%. Also there were no oscillations o f t he Freon-oil int erf ac e of t he manomet er f or shrouds down t o
motion of the interface was noticed very near CHF. This motion could result in as much as a 30% change in the manometer height for the same set of flow conditions. Consequently for these shrouds, and especially with high liquid velocities down (around
.35ft/sec), the interface oscillation was the greatest. This was probably due to the onset of flooding which is characterized
by large pressure and flow oscillations.
All temperature measurements were reproducible to within
The entire test tank was insulated with fiber glass wool. Since an effort was made to bring the entering Freon temperature to saturation, heat losses due to cooling of the liquid by the test section heater were considered negligible.
Axial conduction heat losses from the heater to the copper bus bars were estimated by a worse case analysis. The results
showed that heat lost in this way was less than 7% of the total
CHAPTER III
RESULT S
3.1 Void Fraction and Pressure Drop
While void fraction is known to be one of the most im-portant parameters of two phase flow, it is also one of the most difficult to measure. Boiling void data are especially
difficult to obtain and predict.
In the boiling literature there appear many techniques for measuring void. The techniques fall into two categories: 1) di-rect measurement; and 2) indidi-rect measurement (19). The direct methods include deducing void fraction from measurement of other
parameters such as capacitance, electrical resistivity, thermal conductivity, etc. of the two phase mixture. Direct void meas-urement techniques include photographic studies of the system, sampling probes, and separation of the phases by "trap" type mechanisms. All of the above have certain disadvantages, if not
in accuracy then in cost. Also, due to the size and geometry of the test section used herein, most of the above methods are impractical (e.g., use of the vapor trap technique would require a considerable design effort to implement). The scheme finally decided upon is potentially the simplest. It is based on the fact that void fraction is related to all three components of the total pressure in two phase flow. A discussion follows.
The total pressure drop (relative to the hydrostatic pres-sure) in two phase flow is given by the sum of three components: l.j)haprssure due to frictional effects; 2) the pressure due
to a momentum transfer across the test section; and 3) the gravity pressure drop. That is,
APT
=AP+
AP-+AP
23.I
In all two phase systems the gravity component of eq. 23 is (assuming that the void is constant along the test length),AP
=
Eo +
(
A-)J
L
-
24.
The determination of the momentum and friction pressure drop depends on a detailed knowledge of the two phase flow con-figuration of interest. Several techniques exist with which approximations can be made for the friction and momentum pres-sure drop terms used in performing a force balance on an elemental section of the flow geometry. Among these techniques the most easily adaptable and applicable technique to countercurrent flow
is that of separated flow theory. This theory permits the two phases to have differing properties and velocities. Using sep-arated flow theory, there are two ways to carry out tha analysis: 1) a detailed analysis in which separate continuity and momentum equations are written, together with rate equations which des-cribe how the phases interact with each other and the walls of the tube (1) and are correspondingly solved; and 2) allowing
only a variation of the velocity between the two phases while the appropriate equations are written for the combined flow. In
the second method.ne; regard is given to the specific flow regime or flow details. The second and easier method was used here.
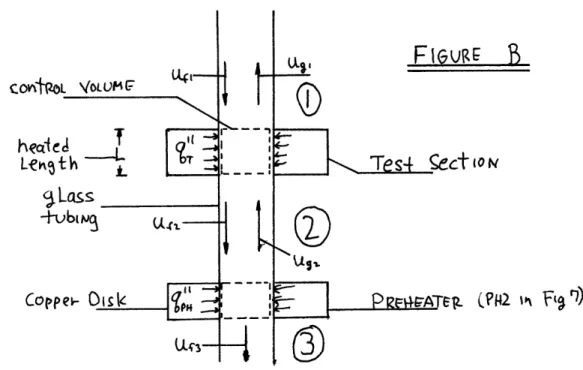
Now consider a control volume enclosing the two phase fluid of an annulus (fig. A on next page).
c
4, U+1 covirot voLomeheofteyr
outer shrovtU411
RO timm~1tP,
Figure AThe control volume assumes nothing specific about the division of the two phases, only that vapor and liquid leave the control volume at station 2 and 1 respectively and that liquid enters at station 2. Note that the wall shear stress indicated on the heated surface and outer shroud assumes the existance of a
li-quid film on both these surfaces (a lili-quid film on the heated
surface was never actually seen).
In writing the continuity and force balance equations for the control volume of fig. A, the velocities of the liquid and vapor, u and ug respectively, are assUmed to correspond to sep-arated flows through areas Ar and A g Then assuming that the
pressure at any cross section is constant, a radially likmped force balance yields (observing the sign convention of page 9):
(P,---P
+
%i 2TTRoL + T rIVR!L -(A ,L AS +/?9iA
4L=
25.
( Ai+ u;AAf - ,AA
term appearing on the right side of eq. 25.
The wall shear stress,'lafr, can be approximated by the wall shear assuming liquid only is flowing inside the annulus if the liquid velocity equals the average liquid velocity over the test length, and the friction factor is assumed to be
.005
(1). Us ing this assumption and eqs.4,5,6,
and 7 substituted in eq. 25gives the force balance in terms of the known superficial ve-locities (assuming equilibrium flow where eq. 12 applies),
P - P2 (the total measured pressure drop), and the unknown void fraction:
APr=
+
(I-)J
]
L
-- .i JA
L
(Do -0
Dz)26
4 __J 4 ___ 2_FJ4 P
9C.( 1 -;0 __. ( 1 -od)
where
J.;-=
(Jt+ J42)/2. . The three components of eq. 23 can be identified as follows:o
1
JC
L
2--- A 2 8 ,9
3.(-)
-
D
D
and where
eq. 24
gives
AP.
The continuity equation in countercurrent flow written in terms of superficial velocities f'or the control volume of f'ig. A
is,
J
r I -
J..
29.
ana-to eq. 24., the void will not be accurately predicted by eq. 26.
This is so because eqs. 27 and 28 depend on the assumptions made of the detailed flow regime and the way in which
jg2
is measured for boiling vystems. In the actual pressure measurements it was observed that in the high void region, greater than about75%,
the manometer interface would exhib it smooth but significant oscillations (as already noted) making readings more difficult.
It is expected that in this region the void fractions calculated
from eq. 26 are not very accurate, and
AP
,
PF
,and
M,
are
of equal magnitude. Fig. 10 shows that the friction and momentum terms can be significant compared to
LPF
at high voids (75% to80%). For voids less than about 75% the friction and momentum
terms are negligible compared to the gravity pressure drop of eq. 24. Eq. 23 withAT'"~A~g then provides the proper expression
for estimating the void fraction.
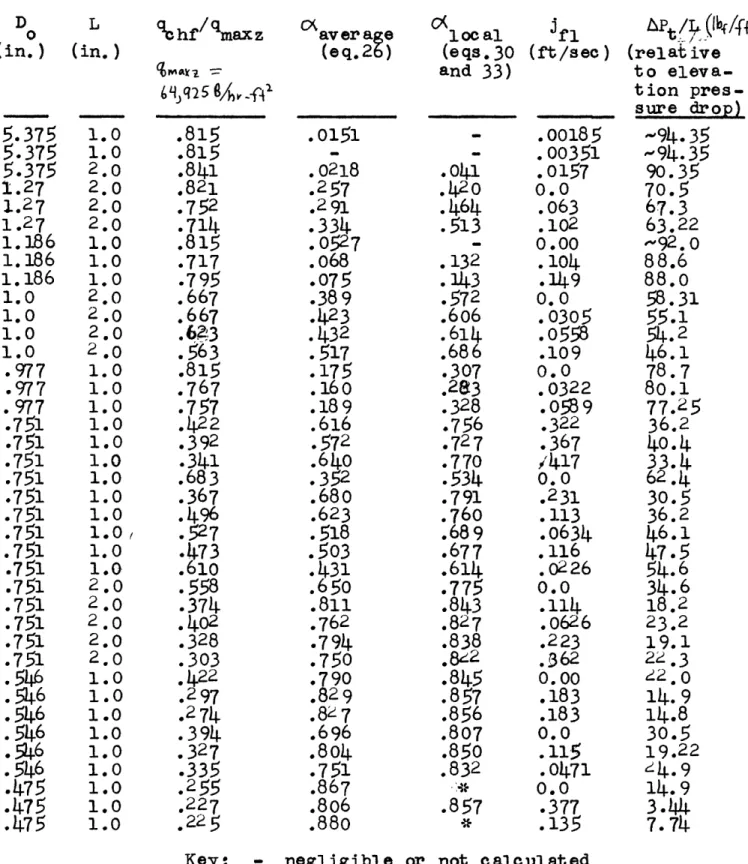
It is important to point out that the data presented here for pressure drop were taken with a single set of pressure taps immediately bounding the test section. As such the measured values represent an overall integration of the local pressure
gradient over the entire heated length. This means that the void fraction calculated from eq. 26 is an average value since the data obtained really do not allow an estimate of the
Flux Model, modified by Griffith (11),
30. ~ ~i (+ K)+ 1 Yk3 FJDO'
The physical significance of the constants.
K
, Ki ,andK
3were explained by Griffith (11). Briefly,
K,
is a function of Reynolds nimber if surface forces are considered to be impor-tant (otherwise it depends on geometry),1K2
represents the ratio of mean to centerline velocity in a tube, andKa
depends on theheat flux (k3== 1.6 for heated pipes and 1.0 for adiabatic sys-tems). The constants
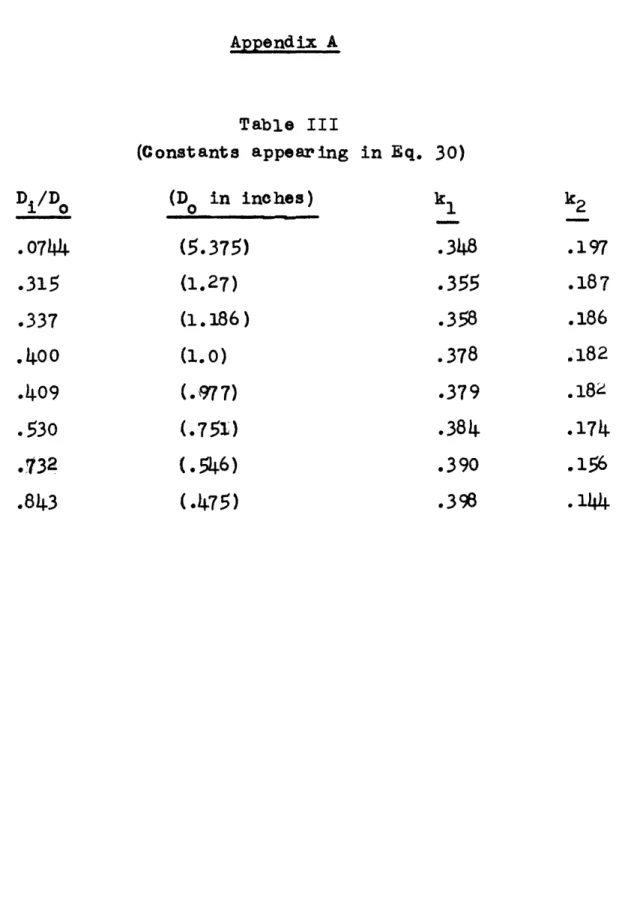
Ki
and Kz were expressed in terms of D /D for annuli and the values tabulated in Table III in Appendix A., Using this table and eqs. 9 or 11 for up or counter flow, eq. 30 can be used to provide an estimate of either the local or average void fraction if the superficial velocities are known at anylocation along the heated length. Since film boiling was initially observed to begin at the test section exit (station 2 of fig. A), the void at the exit can be predicted from eq. 30 if the super-ficial velocities are known there.
In using eq. 26 to calculate the void, the assumption of equilibrium flow, eq. 12, was used to calculate
jg2
.
At low voids this is not a very good assumption. Fig. 3 shows this(the void fraction in fig.