HAL Id: hal-02445762
https://hal.inria.fr/hal-02445762v2
Submitted on 14 Apr 2020
HAL is a multi-disciplinary open access
archive for the deposit and dissemination of
sci-entific research documents, whether they are
pub-lished or not. The documents may come from
teaching and research institutions in France or
abroad, or from public or private research centers.
L’archive ouverte pluridisciplinaire HAL, est
destinée au dépôt et à la diffusion de documents
scientifiques de niveau recherche, publiés ou non,
émanant des établissements d’enseignement et de
recherche français ou étrangers, des laboratoires
publics ou privés.
Open-Source 4G Experimental Setup (Report)
Yanis Boussad, M Naoufal Mahfoudi, Arnaud Legout, Walid Dabbous,
Leonardo Lizzi, Fabien Ferrero
To cite this version:
Yanis Boussad, M Naoufal Mahfoudi, Arnaud Legout, Walid Dabbous, Leonardo Lizzi, et al..
Open-Source 4G Experimental Setup (Report). [Research Report] Inria & Université Cote d’Azur, CNRS,
I3S, Sophia Antipolis, France. 2020. �hal-02445762v2�
Open-Source 4G Experimental Setup
Yanis Boussad, Arnaud Legout,
and Walid Dabbous
Universit´e Cˆote d’Azur, Inria Sophia Antipolis, France
Leonardo Lizzi, Fabien Ferrero
Universit´e Cˆote d’Azur, CNRS, LEAT Sophia Antipolis, France
M. Naoufal Mahfoudi
University of California San Diego San Diego, US
Abstract—In this work, we show how to set up a cellular LTE network for wireless experimentation and measurement, relying on commodity hardware and open-source software. We first deploy a complete LTE network on a single laptop and an SDR hardware. Then, we use it to evaluate the reception performance of a commercial smartphone. In the end, we propose a calibration technique which allows using a smartphone as a wireless power measurement tool by reducing the root-mean-square error of the RSSI, with respect to a reference power measured with a specialized spectrum analyzer, from 6.4 dBm to 2.4 dBm.
I. INTRODUCTION
Commodity hardware in general and mobile smartphones in particular are getting more and more attention in the research community to replace the specialized equipment, either for signal generation by using Software Defined Radio (SDR) [1] or for spectrum measurements [2][3][4].
With the proliferation of SDR technologies, several software implementations of the cellular network protocols are freely available as open-source programs. They allow emulating a cellular network on commodity hardware that would otherwise require a specialized and expensive hardware. For instance, OpenAirInterface (OAI) [5], is an open-source, complete, software implementation of an LTE cellular network that can run on general-purpose processors. In addition, smartphones are seen as a possible replacement for specialized hardware for wireless measurement. Tan et al. proposed Snoopy [2], a spectrum analyzer that uses commodity Wi-Fi cards with frequency translators to sense a wide range of frequencies. Ana et al. [3] used a portable SDR (RTL-SDR) dongle that senses a continuous spectrum range from 52MHz to 2200 MHz, which they connect to a smartphone through USB. In contrast to the two aforementioned works that rely on external hardware, CrowdREM [4] relies only on smartphones for spectrum analysis. The authors used an open-source mo-bile phone (OpenMoko) with a modified Linux system and OsmocomBB as the baseband firmware. They showed that smartphone accuracy is within 3 dBm while the device is still, but very sensitive to orientation with respect to the source, up to 10 dB difference.
As opposed to previous works [2][3], the solution proposed in this paper relies only on a smartphone without any external hardware. Moreover, the solution doesn’t require hardware or software modification on the smartphone. In addition, we mitigate the inaccuracy of smartphones [4] with a calibration
LTE Network OpenAirInterface USRP Duplexer
𝜑 θ x y z y x z
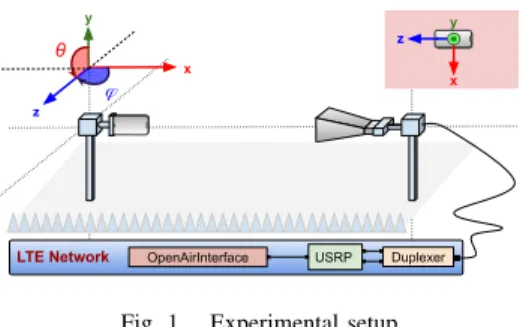
Fig. 1. Experimental setup
algorithm that uses the Inertial Measurements Units (IMUs) of the mobile device to determine the correction power offset to apply.
II. EXPERIMENTAL SETUP
We developed a framework for wireless cellular experi-mentation based on commodity hardware and open-source software. The framework allows signal generation, device testing, and wireless power measurement.
1) Cellular signal generation: Instead of using specialized hardware for generating cellular networks, we use OAI as a cheap and working alternative. We proceed as follows to generate the signal. The Core Network (CN) and the Radio Access Network (RAN) components of OAI should run on two different machines to ensure real-time performances. To reduce the deployment costs of our setup, mobile data should be deactivated which will considerably reduce the computing load on the processor. Hence, both the CN and RAN components can run on the same machine. We use an HP Zbook laptop running Ubuntu 16.04 LTS with Intel i7-6th-gen processor and 32 GB of RAM. We connected the laptop to an Ettus B210 Universal Software Radio Peripheral (USRP). The USRP is then connected through a duplexer to the transmitting antenna (Figure 1). The band 7 duplexer is used to connect both the RX and TX channels of the USRP to the same antenna. We use an ETS-Lindgren’s 3115 double-ridged horn antenna as a transmitting antenna. It is a directional antenna with linear polarization having a gain of 10 dB at 2.5 GHz, and supporting a wide range of frequencies ranging from 750 MHz to 18 GHz. 2) Device Under Test: For the device under test, we use a Nexus 5X smartphone running Android 7. In order to attach the smartphone to the network, we program a SIM card with the necessary authentication parameters that we defined beforehand in the database of OAI. This allows the smartphone
-1 80 -160 -140 -120 -100 -80 -60 -40 -20 0 20 40 60 80 100 120 140 160 (degrees) -90 -80 -70 -60 -50 -40 -30 -20 -10010 20 30 40 50 60 70 80 90 (d eg re es ) 72 68 64 60 56 52 RSSI(dBm)
Fig. 2. Reception pattern of the smartphone at 684 (19x36) different
orientations along ϕ and θ
to discover and attach to the network.
3) Controlled environment: We perform our experimenta-tion in an anechoic chamber that has a programmable robotic equipment both at the transmission and the reception sides. As shown in Figure 1, the reception platform is a two-axis positioning system that rotates along two axis: ϕ and θ. ϕ can rotate 180◦ (from -90◦ to +90◦) whereas θ can make 360◦ rotation. The reception and transmission are separated by a distance of 4 meters. The two platforms are connected to a controller system outside the chamber. We can program the rotation of the platforms by defining the rotation range, the step, and the time duration it remains at each orientation.
III. RECEPTION PERFORMANCE OF A SMARTPHONE
We use our experimental setup to evaluate the reception performance of the Nexus 5X smartphone. We first attach the smartphone to the LTE network on band 7 FDD at 2.68 GHz created using OAI. We mount the smartphone on the reception platform as shown in Figure 1 and put it in 684 different orientations in front of the horizontally polarized transmitting antenna, by varying θ from -180◦ to +170◦ and ϕ from -90◦ to +90◦, with a step of 10◦each time.1At each orientation, we
collect the Received Signal Strength Indication (RSSI) and the smartphone orientation in space from the orientation sensors by making calls to Android APIs. The resulting reception pattern is depicted in Figure 2. As shown, the received power is not uniform across the 684 different orientations.
IV. SMARTPHONE CALIBRATION
In this section, we propose a technique to improve the accuracy of the smartphone measurements which allows using the phone to replace specialized hardware such as a spectrum analyzer for accurate wireless power measurements. We start by measuring the received power at the reception point using a spectrum analyzer. We obtain the reference power to be -54 dBm. In order to increase the accuracy of the smartphone mea-surements, we use two calibration matrices P and Q. P contains the gain correction (in dB) w.r.t. the reference power in the 684 tested orientations. Q contains these 684 orientations. The matrices P and Q are then embedded inside the smartphone as an Android application2. The calibration works as follows.
1Results for the vertical polarization can be obtained by rotating the
transmitting antenna by 90◦along the x-axis.
2The Calibration matrices P and Q of 7 different smartphone models will
be made publicly available for the camera-ready version of the paper.
Orientation matrix Q Power matrix P Orientation qi (θ,φ) Raw power pi gain offset at (θ,φ) Calibrated power pc Antennas Orientation sensor Smartphone
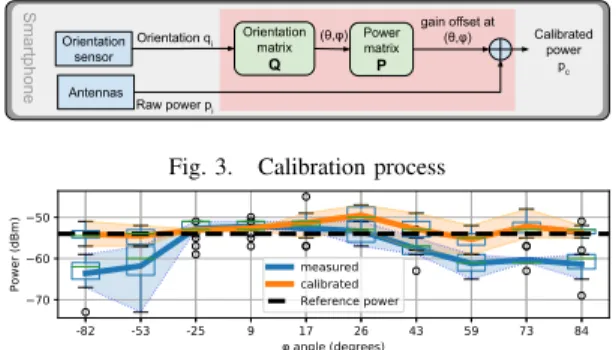
Fig. 3. Calibration process
-168 -127 -108 -78 -62 52 94 122 147 173 angle (degrees) 70 60 50 Po we r ( dB m )
Calibration for differente angles
measured calibrated Reference power -82 -53 -25 9 17 26 43 59 73 84 angle (degrees) 70 60 50 Po we r ( dB m )
Calibration for differente angles
measured calibrated Reference power
Fig. 4. Boxplot of thecalibration results. Each of the 10 shown values of
ϕ is tested with 10 random values of θ. A total of 100 orientations were evaluated. The calibrated signal (in orange) is less variable, and close to the reference power than the raw signal (in blue).
Whenever the smartphone is in a given orientation, we read the raw RSSI power and the device orientation in space. We search in the matrix Q the closest tested orientation. Then, we read from P the corresponding gain correction to be applied. This gain correction is then added to the raw power to obtain a ”calibrated” power corresponding to the value that would be measured with a specialized hardware. The calibration process is summarized in Figure 3. We evaluated the calibration technique on 100 random orientations as indicated in Figure 4. The calibrated signal is less variable and very close to the reference power measured with a spectrum analyzer. The root-mean-square error of the RSSI for the 100 random orientation w.r.t the reference power is reduced to 2.4 dBm compared to 6.4 dBm for the uncalibrated signal.
V. CONCLUSION
In this work, we showed how to realize an experimental setup for wireless cellular networks. We used commodity hard-ware and open-source softhard-ware to emulate an LTE network. We demonstrated how this setup can be used to evaluate the reception performance of a commercial smartphone. Then, we showed the feasibility of using a commercial smartphone for wireless power measurement by proposing a calibration technique that improved the accuracy of the measurements from 6.4 dBm to only 2.4 dBm of root-mean-square error3.
VI. ACKNOWLEDGEMENT
This work has been supported by the French government, through the UCAJEDI Investments in the Future project managed by the National Research Agency (ANR) with the reference number ANR-15-IDEX-01.
REFERENCES
[1] W. Tuttlebee, Software-defined radio: facets of a developing technology, IEEE Personal Communications, vol. 6, no. 2, pp. 3844, 1999. [2] T. Zhang, A. Patro, N. Leng, and S. Banerjee, A Wireless Spectrum
Analyzer in Your Pocket, Proceedings of the 16th International Workshop on Mobile Computing Systems and Applications - HotMobile 15, 2015. [3] A. Nika, Z. Zhang, X. Zhou, B. Y. Zhao, and H. Zheng, Towards
commoditized real-time spectrum monitoring, Proceedings of the 1st ACM workshop on Hot topics in wireless - HotWireless 14, 2014.
3The methodology can be applied to study any LTE device and the
[4] A. Achtzehn, J. Riihihjrvi, I. A. B. Castillo, M. Petrova, and P. Mhnen, CrowdREM, Proceedings of the 16th International Workshop on Mobile Computing Systems and Applications - HotMobile 15, 2015.
[5] N. Nikaein, R. Knopp, F. Kaltenberger, L. Gauthier, C. Bonnet, D. Nussbaum, and R. Ghaddab, Demo: OpenAirInterface, Proceedings of the 20th annual international conference on Mobile computing and networking - MobiCom 14, 2014.