HAL Id: hal-02458669
https://hal.archives-ouvertes.fr/hal-02458669
Submitted on 31 Mar 2021
HAL is a multi-disciplinary open access
archive for the deposit and dissemination of
sci-entific research documents, whether they are
pub-lished or not. The documents may come from
teaching and research institutions in France or
abroad, or from public or private research centers.
L’archive ouverte pluridisciplinaire HAL, est
destinée au dépôt et à la diffusion de documents
scientifiques de niveau recherche, publiés ou non,
émanant des établissements d’enseignement et de
recherche français ou étrangers, des laboratoires
publics ou privés.
Distributed under a Creative Commons Attribution| 4.0 International License
Syndrome and its Physiological Components in Adults:
A Systematic Review
Stéphanie Monnerie, Blandine Comte, Daniela Ziegler, Jose A. Morais, Estelle
Pujos-Guillot, Pierrette Gaudreau
To cite this version:
Stéphanie Monnerie, Blandine Comte, Daniela Ziegler, Jose A. Morais, Estelle Pujos-Guillot, et al..
Metabolomic and Lipidomic Signatures of Metabolic Syndrome and its Physiological Components in
Adults: A Systematic Review. Scientific Reports, Nature Publishing Group, 2020, 10 (1), pp.669.
�10.1038/s41598-019-56909-7�. �hal-02458669�
Metabolomic and Lipidomic
Signatures of Metabolic Syndrome
and its physiological components
in Adults: A Systematic Review
Stéphanie Monnerie
1, Blandine comte
1, Daniela Ziegler
2, José A. Morais
3, estelle
pujos-Guillot
1,4*& pierrette Gaudreau
5,6the aim of this work was to conduct a systematic review of human studies on metabolite/lipid biomarkers of metabolic syndrome (MetS) and its components, and provide recommendations for future studies. the search was performed in MeDLine, eMBASe, eMB Review, cinHAL
complete, pubMed, and on grey literature, for population studies identifying MetS biomarkers from metabolomics/lipidomics. extracted data included population, design, number of subjects, sex/gender, clinical characteristics and main outcome. Data were collected regarding biological samples, analytical methods, and statistics. Metabolites were compiled by biochemical families including listings of their significant modulations. Finally, results from the different studies were compared. The search yielded 31 eligible studies (2005–2019). A first category of articles identified prevalent and incident MetS biomarkers using mainly targeted metabolomics. even though the population characteristics were quite homogeneous, results were difficult to compare in terms of modulated metabolites because of the lack of methodological standardization. A second category, focusing on MetS components, allowed comparing more than 300 metabolites, mainly associated with the glycemic component. Finally, this review included also publications studying type 2 diabetes as a whole set of metabolic risks, raising the interest of reporting metabolomics/lipidomics signatures to reflect the metabolic phenotypic spectrum in systems approaches.
Metabolic syndrome (MetS) is a complex health condition responsible for the concurrence of several metabolic abnormalities and cardiovascular disturbances. Despite a lack of unified definition among health organizations (e.g. National Cholesterol Education Program (NCEP), International Diabetes Federation (IDF), World Health Organization (WHO)), MetS comprises glucose metabolism dysregulation due to insulin resistance, central obe-sity, dyslipidemia, including increased blood triglycerides (TG) and decreased high-density lipoprotein choles-terol (HDL-C), and hypertension1–4. This combination of risk factors favor adverse outcomes such as type 2
diabetes (T2D) and cardiovascular disease (CVD) and increased mortality rate by approximately 1.5-fold5. It
is generally accepted that the prevalence of MetS is on the rise in accordance with increasing body mass index (BMI) and aging of the population6. Because several clinical definitions co-exist, the true prevalence of MetS is
difficult to establish. In spite of this, U.S. surveys indicate that one-third of adults7–9, including young adults10
have MetS. Moreover, by the age of 60, the prevalence reaches 42% compared to 7% for young adults11. Europe
has not been spared from such epidemic, with also a sharp increase of MetS among older adults12. Therefore, it is
now accepted that MetS represents a global p ublic health concern with a worldwide prevalence ranging from 10 to 84%, depending on the ethnicity, age and sex/gender13,14.
MetS is recognized as a progressive pathophysiological state, being part of the trajectory leading to pre-diabetes, T2D and CVD15. I n fact, MetS is not only a precursor but also a predictor of T2D development16–19.
Risks of adverse health outcomes increase substantially with accumulation of MetS clinical components and
1Université Clermont Auvergne, INRA, UNH, Mapping, F-63000, Clermont Ferrand, France. 2Centre Hospitalier
de l’Université de Montréal (CHUM), Montréal, Canada. 3Département de Gériatrie, Université McGill, Montréal,
Canada. 4Université Clermont Auvergne, INRA, UNH, Plateforme d’Exploration du Métabolisme, MetaboHUB
Clermont, F-63000, Clermont-Ferrand, France. 5Centre de Recherche du CHUM, Montréal, Canada. 6Département
de médecine, Université de Montréal, Montréal, Canada. *email: estelle.pujos-guillot@inrae.fr
deleterious environmental factors (e.g. inactivity, Western-type diet). In this context, it is important to better characterize intermediate phenotypes associated with metabolic abnormalities. Biomarkers are considered useful to disentangle the exposure-disease relationships in chronic metabolic disorders and provide sensitive tools for a better identification and stratification of high-risk individuals20. Timely identification of MetS physiological
disturbances should allow pinpointing individuals at highest risk to develop T2D, CVD, and multi-organ dam-age. Moreover, studies of their trajectories should provide insights into key periods for lifestyle intervention, risk factor management, and robustness of pharmacological treatment.
Over the last few years, omics technologies allowed obtaining an integrated view of biological systems, bridg-ing the genotype-to-phenotype gap usbridg-ing a systems biology approach to better define the phenotype. In chronic metabolic diseases, the phenotype is complex and dynamic, because of the occurrence of multiple interactions among genetic and environmental factors21. In this setting, metabolomics, introduced by Nicholson et al. 199922,
aiming at measuring all small molecules/metabolites present in a biological system and accessible to analysis, represents a powerful phenotyping tool. Indeed, it provides metabolic profiles that represent an integrated view of metabolism because it allows a sensitive detection of molecular changes over time, resulting from the interaction between intrinsic and extrinsic factors23. Metabolites, used as single targets or in combination within a
com-prehensive signature, are thus promising biomarkers to reveal early metabolic dysfunctions, when conventional clinical markers have a limited ability for risk assessment and stratification. Metabolomics has therefore been widely applied for metabolic disease diagnosis and candidate biomarker discovery as well as pathophysiological exploration of underlying mechanisms, and prognosis and prediction24,25.
Because the human metabolome is complex (e.g. large concentration ranges, high number of metabolites, chem-ical diversity), different analytchem-ical strategies and methods have been developed. The approach can be untargeted, as a data driven approach dedicated to biomarker discovery, or targeted when it is focused on the detection and quantification of specific classes of compounds, or subsets of known metabolic pathways26. For example,
lipidom-ics has been described as a subsection of metabolomlipidom-ics dedicated to lipid analysis, even if there is a continuum of polarity between lipophilic and hydrophilic metabolites27. To cover this wide diversity of metabolites present
in a given biological sample, diverse analytical platforms are used. Mass Spectrometry (MS) coupled with gas or liquid chromatography (GC- or LC-, respectively) and Nuclear Magnetic Resonance (NMR) Spectroscopy are the two main analytical techniques used. NMR is non-destructive, rapid, and highly robust, which is convenient for a rapid screening of biological sample28 but suffers from limited sensitivity (less than 100 metabolites in most
bio-logical samples by current methods). Advances in MS and its hyphenated techniques, particularly the increase of their respective resolving and separation powers, significantly impacted metabolomics research allowing for higher sensitivity and broader metabolome coverage29. Nonetheless, these MS-based techniques still lack standardization
and throughput. In addition, technical factors (time of sampling, sample type, stability) have to be considered for metabolome investigations and the results of different studies need to be compared. Interestingly, certified commer-cial targeted LC-MS based assays or platforms became available during the last years (e.g. Biocrates, Metabolon).
Considering the diversity of experimental design and analytical methods to characterize the multifaceted physiopathology of MetS, it is necessary to rigorously analyse the scientific literature to answer the general ques-tion “Do metabolomic/lipidomic profiles of MetS and/or its clinical components allow distinguishing from healthy individuals and do they expand the current knowledge about MetS phenotypes?”. The aim of this work was therefore to conduct a systematic review of human studies on metabolite/lipid markers of MetS and its indi-vidual clinical components and provide recommendations for improving the experimental design and result reports of MetS biomarkers.
Results
Search results.
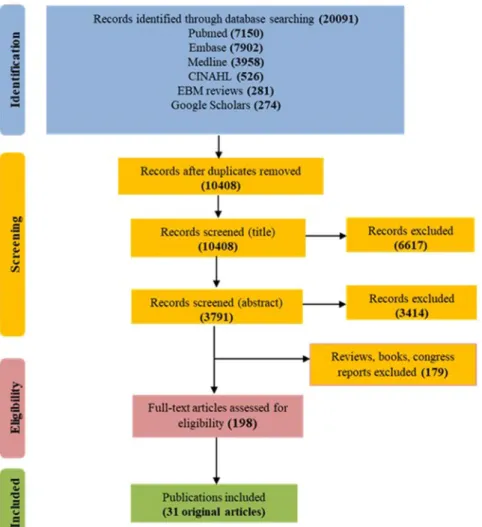
The primary search identified 20,091 records from five databases (Fig. 1). After removing duplicates, 10,408 original publications were screened for titles and abstracts. Following title screening, 6617 of them were discarded and an additional 3414 were excluded after reading the abstracts, in accordance with the identified inclusion/exclusion criteria. Among the 377 remaining articles, 97 were excluded because they were reviews and 82 more because they were books, congress reports and proceedings. Finally, the full content of 198 original articles was read and analysed for eligibility by three independent authors, and 31 of them were retained for the present review.These articles were published between 2005 and 2019, 30 out of 31 were published over the last 7 years, and 19 since 2016. Three categories of articles were identified, depending on the main outcome and study design, and the same article could be classified in more than one category depending on the approaches. Twelve of them were case/control studies on MetS with the objective of identifying prevalent or incident MetS biomarkers (Table 1). Sixteen were focussing on MetS components and studied the correlations/associations between identified metab-olites and MetS criteria (Table 2). Finally, four articles identified prevalent T2D biomarkers (Table 3) and four others were prospective studies of associations between metabolites and incident T2D (Table 4).
MetS biomarkers: results from case/control studies.
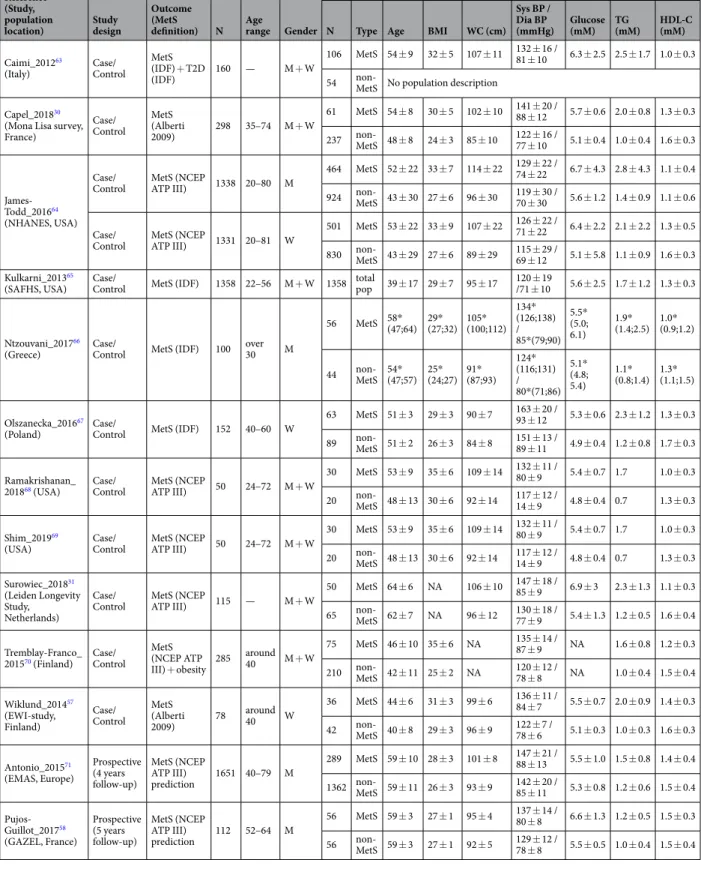
Sixteen articles were included in the first section of the systematic review, on prevalent MetS biomarkers identified in case/control studies (Table 1). They provide population characteristics. Most of the studies were performed in populations aged between 40 and 60 years. Generally, MetS cases exhibited three criteria: a high WC combined with two of the following, high glucose, high TG or hypertension. They were compared with healthy controls. These sixteen articles described 409 differ-ent modulated metabolites in blood or urine, each one discriminating MetS patidiffer-ents and controls from a single studied population for the discovery (Supplemental Table 1a). Ninety of them are amino acids and derivatives, 90 others, di- and tri-glycerides, and around 70 glycerophospholipids. No replication/validation was performed and these biomarkers were mostly identified using targeted MS metabolomics or lipidomics. The metabolites are presented in Supplemental Table 1a with associated references and classified by metabolite families and directionof variation (i.e. positive or negative), as well as analytical methods for metabolomics/lipidomics and used sta-tistical parameters/cofactors. A total of twenty-four different metabolites families were found to be involved. The main classes are amino acids and derivatives, carbohydrates and derivatives, glycolysis related metabolites, glycerophospholipids, glycerolipids, sphingolipids, fatty acids, cholesterol and oxysterols, steroids, and peptides.
Two other publications described biomarkers of incident MetS in prospective studies including only men. Nineteen metabolites were identified as belonging to the following chemical families: amino acids and derivatives, carbohydrates and derivatives, carnitines, fatty acids and derivatives, glycerophospholipids, peptides and steroids (Supplemental Table 1b). It is noteworthy that seven among these metabolites were already described as markers of prevalent MetS, namely alanine, glutamic acid, phenylalanine, tyrosine, oleic acid, total and free testosterone.
Metabolites associated with MetS clinical components.
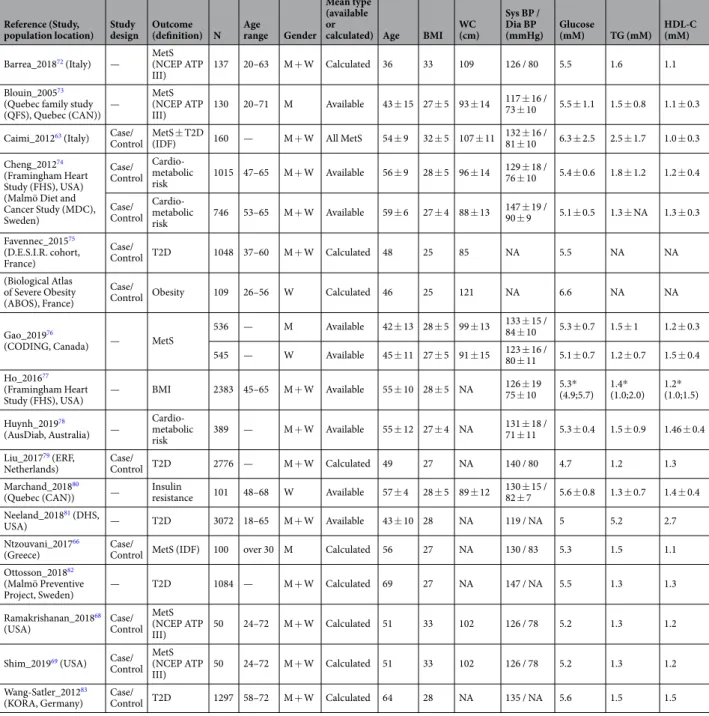
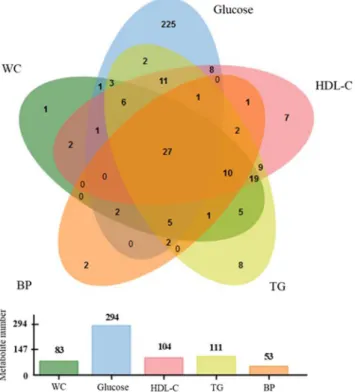
Sixteen articles were included in the second section of the systematic review and are presented in Table 2. In these publications, the main outcome was not only MetS, but also associated components (e.g. obesity, cardio-metabolic risk). Each study correlated metabolites and MetS criteria using different statistical approaches (Spearman/Pearson correlations or linear regression). In terms of clinical characteristics, data were generally provided regarding the whole studied populations and there-fore are quite heterogeneous within the age range of 36 to 69 years and BMI of 25 to 33 kg/m2.Over three hundred metabolites (361) were described as being significantly correlated with one or several MetS criteria, independently (Supplemental Table 2), including 22 metabolite families. Twenty seven of them are correlated with all MetS components (Fig. 2): alanine, choline, glutamate, glutamine, glutamine/glutamate ratio, glycine, isoleucine, L-carnitine, leucine, methionine, phenylalanine, proline, tyrosine, valine, glycerol, 9 TGs, testosterone, alpha-hydroxybutyric acid, and Cer(20:3). Of interest, nineteen of them have already been reported to be prevalent MetS biomarkers in case/control studies (alanine, L-carnitine, choline, glutamate, glutamine, isoleucine, leucine, phenylalanine, proline, tyrosine, valine, and 8 TGs).
Around 10% of the metabolites were common to three of the MetS criteria (all combinations of them). More specifically, about 60% of the identified metabolites showed levels correlated with HDL-C, TG, and glycemia criteria. In addition, this review highlights that some metabolite levels were found to be specifically correlated to each of the MetS criteria (Supplemental Table 3). Seventeen of them were previously described as prevalent MetS biomarkers: 3-hydroxybutyrate, nitric oxides, 5 phospholipids, and 10 TGs.
The glycemic component: towards T2D.
Considering that MetS can lead to T2D and was included in some criteria definition (IDF), we also analyzed articles highlighting an association between prevalent and inci-dent T2D and metabolite dysregulations. A large body of literature was found regarding the investigation ofReference (Study, population
location) Study design
Outcome (MetS
definition) N Age range Gender
Population sample characteristics
N Type Age BMI WC (cm) Sys BP / Dia BP
(mmHg) Glucose (mM) TG (mM) HDL-C (mM)
Caimi_201263
(Italy) Case/Control MetS (IDF) + T2D
(IDF) 160 — M + W
106 MetS 54 ± 9 32 ± 5 107 ± 11 132 ± 16 / 81 ± 10 6.3 ± 2.5 2.5 ± 1.7 1.0 ± 0.3 54 non-MetS No population description
Capel_201830
(Mona Lisa survey, France) Case/ Control MetS (Alberti 2009) 298 35–74 M + W 61 MetS 54 ± 8 30 ± 5 102 ± 10 141 ± 20 / 88 ± 12 5.7 ± 0.6 2.0 ± 0.8 1.3 ± 0.3 237 non-MetS 48 ± 8 24 ± 3 85 ± 10 122 ± 16 / 77 ± 10 5.1 ± 0.4 1.0 ± 0.4 1.6 ± 0.3 James-Todd_201664 (NHANES, USA) Case/
Control MetS (NCEP ATP III) 1338 20–80 M
464 MetS 52 ± 22 33 ± 7 114 ± 22 129 ± 22 / 74 ± 22 6.7 ± 4.3 2.8 ± 4.3 1.1 ± 0.4 924 non-MetS 43 ± 30 27 ± 6 96 ± 30 119 ± 30 / 70 ± 30 5.6 ± 1.2 1.4 ± 0.9 1.1 ± 0.6 Case/
Control MetS (NCEP ATP III) 1331 20–81 W
501 MetS 53 ± 22 33 ± 9 107 ± 22 126 ± 22 / 71 ± 22 6.4 ± 2.2 2.1 ± 2.2 1.3 ± 0.5 830 non-MetS 43 ± 29 27 ± 6 89 ± 29 115 ± 29 / 69 ± 12 5.1 ± 5.8 1.1 ± 0.9 1.6 ± 0.3 Kulkarni_201365
(SAFHS, USA) Case/Control MetS (IDF) 1358 22–56 M + W 1358 total pop 39 ± 17 29 ± 7 95 ± 17 120 ± 19 /71 ± 10 5.6 ± 2.5 1.7 ± 1.2 1.3 ± 0.3
Ntzouvani_201766
(Greece) Case/Control MetS (IDF) 100 over 30 M
56 MetS 58* (47;64) 29* (27;32) 105* (100;112) 134* (126;138) / 85*(79;90) 5.5* (5.0; 6.1) 1.9* (1.4;2.5) 1.0* (0.9;1.2) 44 non-MetS 54* (47;57) 25* (24;27) 91* (87;93) 124* (116;131) / 80*(71;86) 5.1* (4.8; 5.4) 1.1* (0.8;1.4) 1.3* (1.1;1.5) Olszanecka_201667
(Poland) Case/Control MetS (IDF) 152 40–60 W
63 MetS 51 ± 3 29 ± 3 90 ± 7 163 ± 20 / 93 ± 12 5.3 ± 0.6 2.3 ± 1.2 1.3 ± 0.3 89 non-MetS 51 ± 2 26 ± 3 84 ± 8 151 ± 13 / 89 ± 11 4.9 ± 0.4 1.2 ± 0.8 1.7 ± 0.3 Ramakrishanan_
201868 (USA) Case/Control MetS (NCEP ATP III) 50 24–72 M + W
30 MetS 53 ± 9 35 ± 6 109 ± 14 132 ± 11 / 80 ± 9 5.4 ± 0.7 1.7 1.0 ± 0.3 20 non-MetS 48 ± 13 30 ± 6 92 ± 14 117 ± 12 / 14 ± 9 4.8 ± 0.4 0.7 1.3 ± 0.3 Shim_201969
(USA) Case/Control MetS (NCEP ATP III) 50 24–72 M + W
30 MetS 53 ± 9 35 ± 6 109 ± 14 132 ± 11 / 80 ± 9 5.4 ± 0.7 1.7 1.0 ± 0.3 20 non-MetS 48 ± 13 30 ± 6 92 ± 14 117 ± 12 / 14 ± 9 4.8 ± 0.4 0.7 1.3 ± 0.3 Surowiec_201831 (Leiden Longevity Study, Netherlands) Case/
Control MetS (NCEP ATP III) 115 — M + W
50 MetS 64 ± 6 NA 106 ± 10 147 ± 18 / 85 ± 9 6.9 ± 3 2.3 ± 1.3 1.1 ± 0.3 65 non-MetS 62 ± 7 NA 96 ± 12 130 ± 18 / 77 ± 9 5.4 ± 1.3 1.2 ± 0.5 1.6 ± 0.4 Tremblay-Franco_
201570 (Finland) Case/Control
MetS (NCEP ATP III) + obesity 285 around 40 M + W 75 MetS 46 ± 10 35 ± 6 NA 135 ± 14 / 87 ± 9 NA 1.6 ± 0.8 1.2 ± 0.3 210 non-MetS 42 ± 11 25 ± 2 NA 120 ± 12 / 78 ± 8 NA 1.0 ± 0.4 1.5 ± 0.4 Wiklund_201457 (EWI-study, Finland) Case/ Control MetS (Alberti 2009) 78 around 40 W 36 MetS 44 ± 6 31 ± 3 99 ± 6 136 ± 11 / 84 ± 7 5.5 ± 0.7 2.0 ± 0.9 1.4 ± 0.3 42 non-MetS 40 ± 8 29 ± 3 96 ± 9 122 ± 7 / 78 ± 6 5.1 ± 0.3 1.0 ± 0.3 1.6 ± 0.3 Antonio_201571 (EMAS, Europe) Prospective (4 years follow-up) MetS (NCEP ATP III) prediction 1651 40–79 M 289 MetS 59 ± 10 28 ± 3 101 ± 8 147 ± 21 / 88 ± 13 5.5 ± 1.0 1.5 ± 0.8 1.4 ± 0.4 1362 non-MetS 59 ± 11 26 ± 3 93 ± 9 142 ± 20 / 85 ± 11 5.3 ± 0.8 1.2 ± 0.6 1.5 ± 0.4 Pujos-Guillot_201758 (GAZEL, France) Prospective (5 years follow-up) MetS (NCEP ATP III) prediction 112 52–64 M 56 MetS 59 ± 3 27 ± 1 95 ± 4 137 ± 14 / 80 ± 8 6.6 ± 1.3 1.2 ± 0.5 1.5 ± 0.3 56 non-MetS 59 ± 3 27 ± 1 92 ± 5 129 ± 12 / 78 ± 8 5.5 ± 0.5 1.0 ± 0.4 1.5 ± 0.4
Table 1. Characteristics of case/control studies on MetS. BMI = body mass index; WC = waist circumference; BP = blood pressure (sys = systolic; dia = diastolic); TG = triglycerides; HDL-C = high-density lipoprotein cholesterol. Mean values ± SD; *Median value (25th; 75th percentiles).
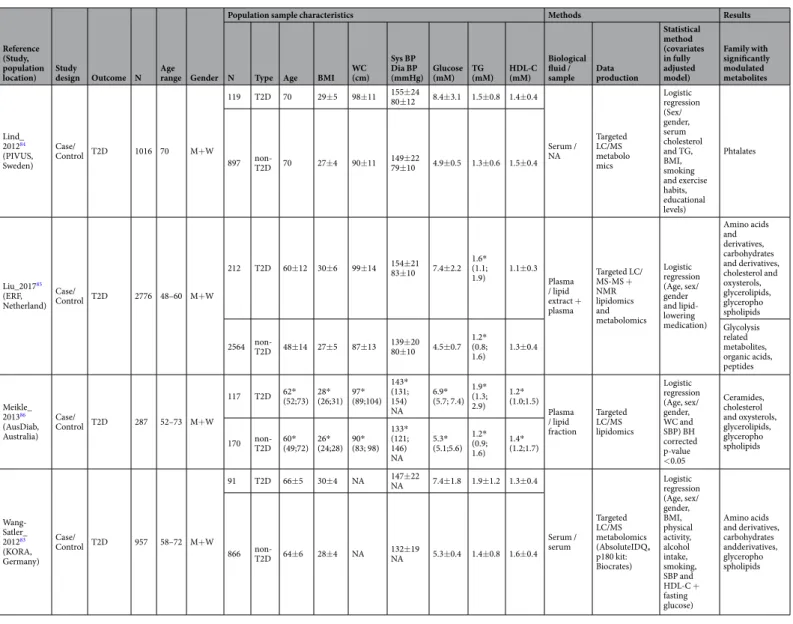
T2D using metabolomics. However, we only selected publications including available clinical data about MetS criteria. Four original articles were selected with case/control design aiming at identifying prevalent T2D markers (Table 3). Four other prospective studies have assessed metabolites associated with incident T2D (Table 4). All these studies have included hypertensive older adults (48 to 70 years) with some cases having a BMI around 30 compared to controls (BMI around 27). Fifty-two metabolites were positively modulated with prevalent T2D from 10 different metabolite families (Supplemental Table 4), identified using targeted MS approaches, predom-inantly, performed on plasma or serum. The incident markers of T2D were more frequently investigated using un- or semi-targeted MS approaches and were validated within a replication study in different cohorts, revealing 39 modulated blood metabolites (Supplemental Table 5) from 11 chemical families. Of particular interest, three studies used multivariate statistical analyses to define a metabolic signature of T2D-related early metabolic dis-turbances. Among the individual markers, only isoleucine was already reported as a marker of prevalent T2D.
Reference (Study,
population location) Study design Outcome (definition) N Age range Gender
Population sample characteristics Mean type
(available or
calculated) Age BMI WC (cm)
Sys BP / Dia BP
(mmHg) Glucose (mM) TG (mM) HDL-C (mM)
Barrea_201872 (Italy) — MetS (NCEP ATP
III) 137 20–63 M + W Calculated 36 33 109 126 / 80 5.5 1.6 1.1
Blouin_200573
(Quebec family study (QFS), Quebec (CAN)) — MetS (NCEP ATP III) 130 20–71 M Available 43 ± 15 27 ± 5 93 ± 14 117 ± 16 / 73 ± 10 5.5 ± 1.1 1.5 ± 0.8 1.1 ± 0.3 Caimi_201263 (Italy) Case/
Control MetS ± T2D (IDF) 160 — M + W All MetS 54 ± 9 32 ± 5 107 ± 11 132 ± 16 / 81 ± 10 6.3 ± 2.5 2.5 ± 1.7 1.0 ± 0.3 Cheng_201274
(Framingham Heart Study (FHS), USA) (Malmö Diet and Cancer Study (MDC), Sweden) Case/ Control Cardio-metabolic risk 1015 47–65 M + W Available 56 ± 9 28 ± 5 96 ± 14 129 ± 18 / 76 ± 10 5.4 ± 0.6 1.8 ± 1.2 1.2 ± 0.4 Case/ Control Cardio-metabolic risk 746 53–65 M + W Available 59 ± 6 27 ± 4 88 ± 13 147 ± 19 / 90 ± 9 5.1 ± 0.5 1.3 ± NA 1.3 ± 0.3 Favennec_201575 (D.E.S.I.R. cohort, France) Case/ Control T2D 1048 37–60 M + W Calculated 48 25 85 NA 5.5 NA NA (Biological Atlas of Severe Obesity (ABOS), France) Case/
Control Obesity 109 26–56 W Calculated 46 25 121 NA 6.6 NA NA
Gao_201976
(CODING, Canada) — MetS
536 — M Available 42 ± 13 28 ± 5 99 ± 13 133 ± 15 / 84 ± 10 5.3 ± 0.7 1.5 ± 1 1.2 ± 0.3 545 — W Available 45 ± 11 27 ± 5 91 ± 15 123 ± 16 / 80 ± 11 5.1 ± 0.7 1.2 ± 0.7 1.5 ± 0.4 Ho_201677
(Framingham Heart
Study (FHS), USA) — BMI 2383 45–65 M + W Available 55 ± 10 28 ± 5 NA
126 ± 19 75 ± 10 5.3* (4.9;5.7) 1.4* (1.0;2.0) 1.2* (1.0;1.5) Huynh_201978 (AusDiab, Australia) — Cardio-metabolic risk 389 — M + W Available 55 ± 12 27 ± 4 NA 131 ± 18 / 71 ± 11 5.3 ± 0.4 1.5 ± 0.9 1.46 ± 0.4 Liu_201779 (ERF,
Netherlands) Case/Control T2D 2776 — M + W Calculated 49 27 NA 140 / 80 4.7 1.2 1.3 Marchand_201880
(Quebec (CAN)) — Insulin resistance 101 48–68 W Available 57 ± 4 28 ± 5 89 ± 12 130 ± 15 / 82 ± 7 5.6 ± 0.8 1.3 ± 0.7 1.4 ± 0.4 Neeland_201881 (DHS,
USA) — T2D 3072 18–65 M + W Available 43 ± 10 28 NA 119 / NA 5 5.2 2.7
Ntzouvani_201766
(Greece) Case/Control MetS (IDF) 100 over 30 M Calculated 56 27 NA 130 / 83 5.3 1.5 1.1 Ottosson_201882
(Malmö Preventive
Project, Sweden) — T2D 1084 — M + W Calculated 69 27 NA 147 / NA 5.5 1.3 1.3
Ramakrishanan_201868
(USA) Case/Control MetS (NCEP ATP
III) 50 24–72 M + W Calculated 51 33 102 126 / 78 5.2 1.3 1.2
Shim_201969 (USA) Case/
Control MetS (NCEP ATP
III) 50 24–72 M + W Calculated 51 33 102 126 / 78 5.2 1.3 1.2
Wang-Satler_201283
(KORA, Germany) Case/Control T2D 1297 58–72 M + W Calculated 64 28 NA 135 / NA 5.6 1.5 1.5
Table 2. Characteristics of studies investigating correlations between metabolites and MetS criteria. BMI = body mass index; WC = waist circumference; BP = blood pressure (sys = systolic; dia = diastolic); TG = triglycerides; HDL-C = high-density lipoprotein cholesterol; NA = not available; ‘Calculated mean type’ refers to clinical variable means that were calculated, when missing, from the available data in the publication. Mean values ± SD; *Median value (25th; 7 = th percentiles).
The prevalent and incident T2D markers were then compared to those previously described as being asso-ciated with the glucose component (Fig. 3). Thirteen metabolites (mostly amino acids, total hexoses and lipid derivatives) are shared by the prevalent T2D and the glucose component whereas 9 metabolites (mostly amino acids) are shared by the incident T2D and the glucose component of MetS. Of particular interest, the amino acid isoleucine is the only shared metabolite by all these glycemic states.
Discussion
MetS biomarkers: results from case/control studies.
In the present systematic review, a first category of publications identified prevalent MetS biomarkers in adults using mainly targeted metabolomics approaches. Even if the population characteristics were clearly presented and quite homogeneous, results were difficult to compare in terms of modulated metabolites because of the limited metabolome detected by each single tar-geted analytical method. However, if the same samples were subjected to different complementary analyses or techniques, some additional metabolites would have been detected. This point is highlighted in two included recent publications that performed semi-targeted approaches that allowed identifying hundreds of modulated metabolites30,31. This comparison of throughput and coverage in targeted and non-targeted metabolomics haveextensively been discussed in the literature, showing the interest of using multi-platform approaches32–34 to obtain
a broader scope of the metabolome related to specific phenotypes. However, due to the high costs of analyses, limited biofluid sample volumes and complexity of resulting data treatments, this strategy is still not a current practice.
Reference (Study, population
location) Study design Outcome N Age range Gender
Population sample characteristics Methods Results
N Type Age BMI WC (cm) Sys BP Dia BP
(mmHg) Glucose (mM) TG (mM) HDL-C (mM) Biological fluid /
sample Data production
Statistical method (covariates in fully adjusted model) Family with significantly modulated metabolites Lind_ 201284 (PIVUS, Sweden) Case/ Control T2D 1016 70 M+W 119 T2D 70 29±5 98±11 155±2480±12 8.4±3.1 1.5±0.8 1.4±0.4 Serum / NA Targeted LC/MS metabolo mics Logistic regression (Sex/ gender, serum cholesterol and TG, BMI, smoking and exercise habits, educational levels) Phtalates 897 non-T2D 70 27±4 90±11 149±2279±10 4.9±0.5 1.3±0.6 1.5±0.4 Liu_201785 (ERF, Netherland) Case/ Control T2D 2776 48–60 M+W 212 T2D 60±12 30±6 99±14 154±2183±10 7.4±2.2 1.6*(1.1; 1.9) 1.1±0.3 Plasma / lipid extract + plasma Targeted LC/ MS-MS + NMR lipidomics and metabolomics Logistic regression (Age, sex/ gender and lipid-lowering medication) Amino acids and derivatives, carbohydrates and derivatives, cholesterol and oxysterols, glycerolipids, glyceropho spholipids 2564 non-T2D 48±14 27±5 87±13 139±2080±10 4.5±0.7 1.2*(0.8; 1.6) 1.3±0.4 Glycolysis related metabolites, organic acids, peptides Meikle_ 201386 (AusDiab, Australia) Case/ Control T2D 287 52–73 M+W 117 T2D 62*(52;73) 28*(26;31) 97*(89;104) 143* (131; 154) NA 6.9* (5.7; 7.4) 1.9* (1.3; 2.9) 1.2* (1.0;1.5) Plasma / lipid fraction Targeted LC/MS lipidomics Logistic regression (Age, sex/ gender, WC and SBP) BH corrected p-value <0.05 Ceramides, cholesterol and oxysterols, glycerolipids, glyceropho spholipids 170 non-T2D 60*(49;72) 26*(24;28) 90*(83; 98) 133* (121; 146) NA 5.3* (5.1;5.6) 1.2* (0.9; 1.6) 1.4* (1.2;1.7) Wang-Satler_ 201283 (KORA, Germany) Case/ Control T2D 957 58–72 M+W 91 T2D 66±5 30±4 NA 147±22NA 7.4±1.8 1.9±1.2 1.3±0.4 Serum / serum Targeted LC/MS metabolomics (AbsoluteIDQ® p180 kit: Biocrates) Logistic regression (Age, sex/ gender, BMI, physical activity, alcohol intake, smoking, SBP and HDL-C + fasting glucose) Amino acids and derivatives, carbohydrates andderivatives, glyceropho spholipids 866 non-T2D 64±6 28±4 NA 132±19NA 5.3±0.4 1.4±0.8 1.6±0.4
Table 3. Characteristics of case/control studies on T2D. BMI = body mass index; WC = waist circumference; BP = blood pressure (sys = systolic; dia = diastolic); TG = triglycerides; HDL-C = high-density lipoprotein cholesterol. Mean values ± SD; *Median value (25th; 75th percentiles) ‘Extract’ refers to direct protein
precipitation/extraction on raw biological materials; ‘fraction’ refers a separation of biological materials into polar and lipid fractions.
Because of the targeted aspects of most of the methods, the underlying mechanisms were not explored, and the frequencies of occurrence of specific metabolites described as MetS biomarkers in these studies were low, and not representative of the importance of these metabolites in the physiopathology but can just be related to the choice of the analytical methods.
Metabolites associated with MetS clinical components.
The second category of articles focusing on MetS individual components allowed us comparing metabolites associated with clinical data defining MetS. Amino acids, glycerolipids and glycerophospholipids are the major metabolite classes reported as being corre-lated. Among lipid species, results were particularly difficult to report and to compare, due to the diversity in notations of lipid structures. In fact, even if several consortia proposed guidelines35,36, there is still different levelsof annotations (from lipid class to stereoisomers) and different ontologies among the databases in use.
In these publications, the diversity of outcome, related to cardiometabolic risk was found to be important. Moreover, the lack of description regarding either other MetS criteria or characteristics of controls, together with Reference
(Study, population location) Study design
Follow-up time
(years) Outcome N Age range Gender
Population sample characteristics Methods Results
N Type Age BMI WC (cm) Sys BP Dia BP
(mmHg) Glucose (mM) TG (mM) HDL-C (mM) Biological fluid /
sample Data production
Statistical method (covariates in fully adjusted model) Family with significantly modulated metabolites Peddinti_ 201787 (Botnia, Finland + DESIR, France) Case/ Control 10 T2Dprediction 543 48–52 M+W 146 T2D 52±1 29±0.4 96±1 139±284±1 5.9± 0.05 1.7± 0.08 1.3± 0.03 Plasma / MeOH extract Semi- targeted LC/MS + GC/MS (Metabolon® platform) metabolo mics Conditional logistic regression FDR q<0.05 (Age, sex/gender, BMI, fasting glucose level and family history of T2D) p- values <0.05 multivariate logistic regression Amino acids and derivatives, bilirubins, carbohydrates and derivatives, fatty acids and derivatives, quinones and hydro quinones 397 non-T2D 48±1 26±0.2 88±1 130±179±1 5.6± 0.03 1.3± 0.04 1.4± 0.01 Suvitaival_ 201788 (METSIM (discovery set), Denmark) Case/ Control 5 T2Dprediction 323 53–65 M 107 T2D 59±6 29±4 102±0 143±1690±9 6.0± 0.5 1.9± 1.2 1.3± 0.4 Plasma / lipid fraction Non- targeted LC/MS lipidomics Logistic regression Model (Age and BMI) Glycerolipids, glycerophos- pholipids 216 non-T2D 60±5 26±2 95±7 133±1585±9 5.2± 0.2 1.1± 0.5 1.5± 0.4 Wang-Satler_ 201283 (KORA, Germany) Case/ Control 10 T2Dprediction 876 58–72 M+W 91 T2D 66±5 30±4 NA 138±19NA 5.9± 0.6 1.7± 0.8 1.3± 0.3 Serum / serum Targeted LC/MS metabolo mics (Absolute IDQ® p180 kit: Biocrates) Logistic regression (Age, sex/gender, BMI, physical activity, alcohol intake, smoking, SBP, HDL cholesterol Hb1Ac, fasting glucose and fasting insulin) Glycerophos- pholipids 785 non-T2D 63±5 28±4 NA 132±19NA 5.4± 0.5 1.4± 0.8 1.6± 0.4 Yengo_ 201689 (DESIR, Europe) Case/ Control 9 T2D prediction (ADA) 1067 37–60 M+W 231 T2D 51±9 28±4 94±11 139±1784±9 5.9± 0.6 1.7± 1.2 1.5± 0.4 Plasma / MeOH extract Semi- targeted LC/MS- MS + GC/MS (Metabolon® platform) metabolo mics Logistic and Cox regressions Amino acids and derivatives, carbo hydrates and derivatives, carnitines, fatty acids and derivatives, glycerolipids, glycerophos- pholipids, peptides, purines and derivatives, steroids 836 non-T2D 47±10 25±4 83±11 131±1680±10 5.3± 0.7 1.1± 0.7 1.6± 0.4
Table 4. Characteristics of prospective studies on T2D. BMI = body mass index; WC = waist circumference; BP = blood pressure (sys = systolic; dia = diastolic); TG = triglycerides; HDL-C = high-density lipoprotein cholesterol. ‘Extract’ refers to direct protein precipitation/extraction on raw biological materials; ‘fraction’ refers a separation of biological materials into polar and lipid fractions. MeOH: methanol.
Figure 2. Venn diagram showing the number of metabolites significantly correlated with MetS components, together with respective histogram representing the number of significant metabolites for each clinical MetS components. WC = waist circumference; BP = blood pressure; TG = triglycerides; HDL-C = high-density lipoprotein cholesterol.
Figure 3. Venn diagram showing the numbers of metabolites significantly modulated with prevalent and incident T2D and the number of metabolites associated with glycemia, together with respective histogram representing the number of significant metabolites for each outcome.
the absence of additional phenotypic data (e.g. physical activity, nutrition) in some publications, prevented us from including them in this review. For example, plasma metabolite concentrations are known to be highly influenced by physical activity and/or microbiota37–39 and plasma phospholipids were proposed to be indicative of both food
habits and metabolic changes40. It has been recognized that publication of all the metadata (data about the samples)
along with the metabolomic data is a good practice to assess the quality of the models and the drawn conclusions. Despite the existing data repositories in the field (MetaboLights41, Metabolomics Workbench42) and available
guidelines provided by the metabolomics standards initiative (MSI)43,44, such good practice is still quite rare.
Despite these limitations, this review highlights the importance of amino acids and TGs, which have both been described as MetS biomarkers and associated with each of the five clinical MetS criteria. In fact, previously alterations of serum amino acids have been reported in the development of overweight, obesity, and insulin resist-ance45,46. Increased TG levels have also been linked to obesity and insulin resistance47, but even if associations
with hypertension and hypertension risk were shown, the involved mechanisms remain to be explored48.
The glycemic component: towards T2D.
Among all the MetS criteria, elevated fasting blood glucose was by far the most studied phenotype using metabolomics/lipidomics, because of its direct link with T2D. Studies on dysglycemia have been among the main drivers in this research field using global metabolomic approaches for biomarker discovery and validation. This review allows first to get an overview of the publications considering this specific component among a whole set of metabolic risks, which is of great interest, in the context of systems approaches. In particular, it highlights the interest of profiling both amino acids, lipids and carbohydrates to decipher the complex interplay between obesity and diabetes, as previously discussed25. In addition, it allowsidentifying specific metabolites of interest such as isoleucine, α-hydroxybutyrate, and ether phosphaditylcholine (PC) species to monitor disease progression in the context of metabolic disorders. In fact, although little stud-ied, ether PC species are part of an overlapping lipid profile between diabetes and hypertension49. Further, this
review illustrates the use of metabolomics as a powerful tool for the identification of relevant pattern of hundreds of detected metabolites that could be used to predict future development of T2D. However, metabolic profiles acquired with semi- or non-targeted approaches are complex and required dedicated variable selection to build powerful predictive models of specific prediabetic phenotypes50. As the analysis of data is one of the most
chal-lenging steps in the metabolomics approach due to high data dimensionality and limited number of samples, rec-ommendations as well as appropriate statistical workflows have been proposed. They often include a combination of univariate and multivariate analyses and highlighted the importance of feature/variable selection and external validation to minimize the risk of overfitting51,52. In most publications included in the present review, statistical
approaches were not described in detail and limited to univariate analyses, which are the most commonly used due to their easiness of interpretation. However, in the context of metabolomics/lipidomics, multivariate meth-ods are of great relevance as they make use of all variables simultaneously and deal with the relationship between variables, reflecting orchestrated biological processes53.
Limitations and recommendations for further studies.
An important limitation concerning this review is the intrinsic issue of selecting a targeted metabolomic or lipidomic approach or interpreting the result-ing data in connection with the study design and the phenotypes of interest. Such a strategy can lead to difficulties in interpretation due to missing acquired data on relevant pathways from this context. In addition, around 60% of the selected studies were using only metabolomics, which is probably the best compromise when using a single approach, as it also allows detecting the most polar lipid families. However, considering the multifaceted physi-opathology of MetS, it is of great interest to consider applying a more comprehensive strategy using both untar-geted metabolomics and lipidomics to cover the large diversity of potential modulated metabolites in biofluids. This combination is still rare (only three studies in the present review) most probably because of costs, expertise, and complexity of data analytical treatment.A second limitation concerns methods both for data production and treatment. Regarding sample preparation and analytical methods, experimental conditions were very heterogeneous, making comparison between studies challenging. Moreover, in the selected articles, even if confounding factors have been often considered in study designs, data description and analysis of these potentially interacting factors were frequently lacking. Such biases have often been identified and statistical approaches have been developed to avoid false discoveries in metabo-lomics52. Beyond this aspect, multiple ontologies used to describe metabolites/lipids54 and the semi quantitative
property of most of the analytical methods, are still major bottlenecks of the field.
Despite these limitations, it is now recognized that metabolomics is a powerful tool allowing metabolic strati-fication of patients and prognosis55. Indeed a metabolic signature would lead to a molecular definition of MetS56,
as exemplified by Wiklung et al.57 and Pujos-Guillot et al.58. Clinically speaking, the interest of subtyping MetS
has been shown since the prevalence and risk for further cardiovascular disease and T2D is associated with different combinations of its components15. More recently, Sperling et al.59 highlighted the need of identifying
subtypes of MetS on the basis of pathophysiology, as well as studying the evolution of its stages for a more efficient prevention and therapy. In this context, metabolomic and lipidomic signatures are suitable systems approaches not only to identify biomarkers of sub-phenotypes but also for hypothesis generation of the underlying patho-genic mechanisms.
conclusion
The present review indicates that relatively few articles have been published so far on MetS biomarkers identifica-tion using metabolomics and lipidomics in adults. Unfortunately, due to many limitaidentifica-tions previously highlighted, it is difficult to compare conclusions from the available data. Moreover, individual MetS clinical components were not specifically investigated, despite the fact that metabolomics/lipidomics are recognized as being powerful
phenotyping tools in chronic metabolic diseases. Since studies on T2D have been among the main drivers in this research field using these global approaches for biomarker discovery and validation, it can be concluded that metabolomics and lipidomics signatures could be the strategy of choice for a deeper investigation and charac-terization of MetS and its sub-phenotypes. Considering future research, a number of key recommendations can be made. First, untargeted methods must be performed using multiplatform approaches for a wide detection of metabolite diversity enabling new biomarker discovery. Second, the complexity of metabolomic/lipidomic data has to be investigated using dedicated univariate and multivariate statistics and data reporting has to follow the FAIR principle60, concerning both population characteristics and marker metadata. This issue is crucial to
ensure the reliability, validity and inter-comparability of experimental results. Such effort should allow transfer-ring knowledge from basic research to clinical practices.
Materials and Methods
Methodology for review of published literature.
The systematic review of the literature was performed according to the Preferred Reporting Items for Systematic Reviews and Meta-Analyses (PRISMA) guidelines for conducting systematic reviews61.A specific request was made through several bibliographic electronic databases in August 2019. All databases were chosen in line with the application field studied in the review, namely health research and biology, and five were retained: MEDLINE (from 1946 onwards), EMBASE (from 1974 onwards), EMB Review (from 1991 onwards), CINHAL Complete (from 1937 onwards) and PubMed. To ensure that information collected was com-plete, the request was also performed on grey literature ((CADTH, Clinical Trials, National Guideline Clearing House, National Institute for Health and Care Excellence (NICE), MedNar, Google Scholar and Open Grey). The request combined words and expressions for three conceptual groups: “Metabolomics/lipidomics”, “Metabolic Syndrome” and “metabolites/biomarkers” (Supplemental Material 1). For each database, words and expressions from controlled vocabulary (MeSH, EMTREE and others) and free-text searching were used. Snowballing tech-niques and Handsearching was also used to identify other references. Duplicate publications were deleted.
Study selection and data extraction.
Initially, titles and abstracts were screened by two authors using the following inclusion and exclusion criteria: (1) articles had to be published in English; (2) publications had to contain original data, therefore reviews, book chapters, and editorials were excluded; (3) studies on non-human models (e.g. animals, plants, cells) were excluded; human studies were restricted to case/control, observational, and prospective designs; intervention studies were excluded. Finally, population was restricted to adult/aging Caucasian subjects; thus articles on children, adolescents or pregnant women were excluded; (4) the primary outcome had to be the MetS and/or its components, including T2D, and (5) articles referring to genetic/transcrip-tomic markers or proteomics were also excluded. These two authors resolved disagreements. To determine publi-cation relevance, three authors independently screened all titles and abstracts to assess their eligibility against the following more restrictive criteria: Eligible publications in the review had to include a minimum of 20 subjects per group and available clinical data regarding the MetS criteria: fasting glucose, TG, HDL-C concentrations, waist circumference, systolic and diastolic blood pressures. Concerning the number of subjects considered as minimum per study, it is generally admitted that 30 subjects is a limit to be able to perform common methods in statistics, in relation to a normal distribution. Moreover, because of the diversity/complexity of the MetS meta-bolic phenotypes, influenced by numerous factors (gender, age, diet…), taking a population of 40 subjects (i.e. 20 subjects per group for a case/control study) was considered as a minimum requirement. Disagreements in abstracts inclusion were resolved after consensual decision involving a fourth author.Pertinent data from papers were then extracted, including, author names, publication year, study population and design, number of subjects, gender/sex, baseline clinical characteristics and main outcome. The experimental measures were collected regarding the nature of the biological samples, the analytical approach and techniques, and information regarding statistical methods and covariates when relevant. The results were analysed and com-piled by biochemical family including significantly modulated metabolites (p-value < 0.05), metabolite listings with levels of change according to the outcome and/or MetS clinical criteria. Finally, results from different studies were compared using Venn diagrams62 to obtain a more synthetic view.
ethics statement.
This article does not contain any studies with human or animal subjects performed by any of the authors.Received: 19 December 2018; Accepted: 19 December 2019; Published: xx xx xxxx
References
1. Alberti, K. G. et al. Harmonizing the metabolic syndrome: a joint interim statement of the International Diabetes Federation Task Force on Epidemiology and Prevention; National Heart, Lung, and Blood Institute; American Heart Association; World Heart Federation; International Atherosclerosis Society; and International Association for the Study of Obesity. Circulation 120, 1640–1645, https://doi.org/10.1161/CIRCULATIONAHA.109.192644 (2009).
2. Alberti, K. G., Zimmet, P. & Shaw, J. Metabolic syndrome–a new world-wide definition. A Consensus Statement from the International Diabetes Federation. Diabet. Med. 23, 469–480, https://doi.org/10.1111/j.1464-5491.2006.01858.x (2006).
3. Day, C. Metabolic syndrome, or What you will: definitions and epidemiology. Diab. Vasc. Dis. Res. 4, 32–38, https://doi.org/10.3132/ dvdr.2007.003 (2007).
4. Lam, D. W. & LeRoith, D. In Endotext (eds. L. J. De Groot et al.) (2000).
5. Mottillo, S. et al. The metabolic syndrome and cardiovascular risk a systematic review and meta-analysis. J. Am. Coll. Cardiol. 56, 1113–1132, https://doi.org/10.1016/j.jacc.2010.05.034 (2010).
6. Ervin, R. B. Prevalence of metabolic syndrome among adults 20 years of age and over, by sex, age, race and ethnicity, and body mass index: United States, 2003-2006. Natl. Health Stat. Report, 1–7 (2009).
7. Ford, E. S., Mannino, D. M., National, H. & Nutrition Examination Survey Epidemiologic Follow-up, S. Prospective association between lung function and the incidence of diabetes: findings from the National Health and Nutrition Examination Survey Epidemiologic Follow-up Study. Diabetes Care, 27, 2966–2970 (2004).
8. Beltran-Sanchez, H., Harhay, M. O., Harhay, M. M. & McElligott, S. Prevalence and trends of metabolic syndrome in the adult U.S. population, 1999-2010. J. Am. Coll. Cardiol. 62, 697–703, https://doi.org/10.1016/j.jacc.2013.05.064 (2013).
9. Saklayen, M. G. The Global Epidemic of the Metabolic Syndrome. Curr. Hypertens. Rep. 20, 12, https://doi.org/10.1007/s11906-018-0812-z (2018).
10. Nolan, P. B., Carrick-Ranson, G., Stinear, J. W., Reading, S. A. & Dalleck, L. C. Prevalence of metabolic syndrome and metabolic syndrome components in young adults: A pooled analysis. Prev. Med. Rep. 7, 211–215, https://doi.org/10.1016/j.pmedr.2017.07.004
(2017).
11. Ford, E. S., Giles, W. H. & Dietz, W. H. Prevalence of the metabolic syndrome among US adults: findings from the third National Health and Nutrition Examination Survey. JAMA 287, 356–359 (2002).
12. van Vliet-Ostaptchouk, J. V. et al. The prevalence of metabolic syndrome and metabolically healthy obesity in Europe: a collaborative analysis of ten large cohort studies. BMC Endocr. Disord. 14, 9, https://doi.org/10.1186/1472-6823-14-9 (2014).
13. Kaur, J. A comprehensive review on metabolic syndrome. Cardiol. Res. Pract. 2014, 943162, https://doi.org/10.1155/2014/943162
(2014).
14. Ranasinghe, P., Mathangasinghe, Y., Jayawardena, R., Hills, A. P. & Misra, A. Prevalence and trends of metabolic syndrome among adults in the asia-pacific region: a systematic review. BMC public. health 17, 101, https://doi.org/10.1186/s12889-017-4041-1 (2017). 15. Wilson, P. W., D’Agostino, R. B., Parise, H., Sullivan, L. & Meigs, J. B. Metabolic syndrome as a precursor of cardiovascular disease
and type 2 diabetes mellitus. Circulation 112, 3066–3072, https://doi.org/10.1161/CIRCULATIONAHA.105.539528 (2005). 16. Stern, M. P., Williams, K., Gonzalez-Villalpando, C., Hunt, K. J. & Haffner, S. M. Does the metabolic syndrome improve
identification of individuals at risk of type 2 diabetes and/or cardiovascular disease? Diabetes Care 27, 2676–2681 (2004). 17. Li, C. & Ford, E. S. Definition of the Metabolic Syndrome: What’s New and What Predicts Risk? Metab. Syndr. Relat. Disord. 4,
237–251, https://doi.org/10.1089/met.2006.4.237 (2006).
18. Grundy, S. M. P-diabetes, metabolic syndrome, and cardiovascular risk. J. Am. Coll. Cardiol. 59, 635–643, https://doi.org/10.1016/j. jacc.2011.08.080 (2012).
19. Poon, V. T., Kuk, J. L. & Ardern, C. I. Trajectories of metabolic syndrome development in young adults. PLoS One 9, e111647, https:// doi.org/10.1371/journal.pone.0111647 (2014).
20. Steinbrecher, A. & Pischon, T. The potential use of biomarkers in the prevention of Type 2. diabetes. Expert. Rev. Endocrinol. Metab.
8, 217–219, https://doi.org/10.1586/eem.13.11 (2013).
21. Ramautar, R., Berger, R., Greef, J. V. D. & Hankemeier, T. Human metabolomics: Strategies to understand biology. (2013). 22. Nicholson, J. K., Lindon, J. C. & Holmes, E. ‘Metabonomics’: understanding the metabolic responses of living systems to
pathophysiological stimuli via multivariate statistical analysis of biological NMR spectroscopic data. Xenobiotica 29, 1181–1189,
https://doi.org/10.1080/004982599238047 (1999).
23. Liggi, S. & Griffin, J. L. Metabolomics applied to diabetes-lessons from human population studies. Int. J. Biochem. Cell Biol. 93, 136–147, https://doi.org/10.1016/j.biocel.2017.10.011 (2017).
24. Zhang, A. H., Qiu, S., Xu, H. Y., Sun, H. & Wang, X. J. Metabolomics in diabetes. Clin. Chim. Acta. 429, 106–110, https://doi. org/10.1016/j.cca.2013.11.037 (2014).
25. Park, S., Sadanala, K. C. & Kim, E. K. A Metabolomic Approach to Understanding the Metabolic Link between Obesity and Diabetes.
Mol. Cell 38, 587–596, https://doi.org/10.14348/molcells.2015.0126 (2015).
26. Bain, J. R. et al. Metabolomics applied to diabetes research: moving from information to knowledge. Diabetes 58, 2429–2443 (2009). 27. Cajka, T. & Fiehn, O. T. M. Untargeted and Targeted Methods in Mass Spectrometry-Based Metabolomics and Lipidomics. Anal.
Chem. 88, 524–545, https://doi.org/10.1021/acs.analchem.5b04491 (2016).
28. Duarte, I. F., Diaz, S. O. & Gil, A. M. NMR metabolomics of human blood and urine in disease research. J. Pharm. Biomed. Anal. 93, 17–26, https://doi.org/10.1016/j.jpba.2013.09.025 (2014).
29. Forcisi, S. et al. Liquid chromatography-mass spectrometry in metabolomics research: mass analyzers in ultra high pressure liquid chromatography coupling. J. Chromatogr. A 1292, 51–65, https://doi.org/10.1016/j.chroma.2013.04.017 (2013).
30. Capel, F. et al. Metabolomics reveals plausible interactive effects between dairy product consumption and metabolic syndrome in humans. Clin. Nutr., https://doi.org/10.1016/j.clnu.2019.06.013 (2019).
31. Surowiec, I. et al. Metabolomic and lipidomic assessment of the metabolic syndrome in Dutch middle-aged individuals reveals novel biological signatures separating health and disease. Metabolomics 15, 23, https://doi.org/10.1007/s11306-019-1484-7 (2019). 32. Becker, S., Kortz, L., Helmschrodt, C., Thiery, J. & Ceglarek, U. LC-MS-based metabolomics in the clinical laboratory. Journal of
Chromatography B: Analytical Technologies in the Biomedical and Life Sciences., https://doi.org/10.1016/j.jchromb.2011.10.018. 33. Alonso, A., Marsal, S. & Julia, A. Analytical methods in untargeted metabolomics: state of the art in 2015. Front. Bioeng. Biotechnol.
3, 23, https://doi.org/10.3389/fbioe.2015.00023 (2015).
34. Sas, K. M., Karnovsky, A., Michailidis, G. & Pennathur, S. Metabolomics and diabetes: analytical and computational approaches.
Diabetes 64, 718–732 (2015).
35. Liebisch, G. et al. Shorthand notation for lipid structures derived from mass spectrometry. J. Lipid Res. 54, 1523–1530, https://doi. org/10.1194/jlr.M033506 (2013).
36. Sud, M. et al. LMSD: LIPID MAPS structure database. Nucleic. Acids Res. 35, D527–532, https://doi.org/10.1093/nar/gkl838 (2007). 37. Gonzalez-Franquesa, A., Burkart, A. M., Isganaitis, E. & Patti, M. E. What Have Metabolomics Approaches Taught Us About Type
2 Diabetes? Curr. diabetes Rep. 16, 74, https://doi.org/10.1007/s11892-016-0763-1 (2016).
38. Palau-Rodriguez, M. et al. Metabolomic insights into the intricate gut microbial-host interaction in the development of obesity and type 2 diabetes. Front. microbiology 6, 1151, https://doi.org/10.3389/fmicb.2015.01151 (2015).
39. Shapiro, H., Suez, J. & Elinav, E. Personalized microbiome-based approaches to metabolic syndrome management and prevention.
J. diabetes 9, 226–236, https://doi.org/10.1111/1753-0407.12501 (2017).
40. Forouhi, N. G. et al. Differences in the prospective association between individual plasma phospholipid saturated fatty acids and incident type 2 diabetes: the EPIC-InterAct case-cohort study. lancet Diabetes & endocrinology. 2, 810–818 (2014).
41. Kale, N. S. et al. MetaboLights: An Open-Access Database Repository for Metabolomics Data. Curr. Protoc. Bioinformatics, 53, 14 13 11–18, https://doi.org/10.1002/0471250953.bi1413s53 (2016).
42. Sud, M. et al. Metabolomics Workbench: An international repository for metabolomics data and metadata, metabolite standards, protocols, tutorials and training, and analysis tools. Nucleic. Acids Res. 44, D463–470, https://doi.org/10.1093/nar/gkv1042 (2016). 43. Sumner, L. W. et al. Proposed minimum reporting standards for chemical analysis Chemical Analysis Working Group (CAWG)
Metabolomics Standards Initiative (MSI). Metabolomics 3, 211–221, https://doi.org/10.1007/s11306-007-0082-2 (2007).
44. Hardy, N. W. & Taylor, C. A roadmap for the establishment of standard data exchange structures for metabolomics. Metabolomics 3, 243–248 (2007).
45. Newgard, C. B. Interplay between lipids and branched-chain amino acids in development of insulin resistance. Cell Metab. 15, 606–614, https://doi.org/10.1016/j.cmet.2012.01.024 (2012).
46. Adams, S. H. Emerging perspectives on essential amino acid metabolism in obesity and the insulin-resistant state. Adv. Nutr. 2, 445–456, https://doi.org/10.3945/an.111.000737 (2011).
47. Tonks, K. T. et al. Skeletal muscle and plasma lipidomic signatures of insulin resistance and overweight/obesity in humans. Obes.
(Silver Spring) 24, 908–916, https://doi.org/10.1002/oby.21448 (2016).
48. Kulkarni, H., Mamtani, M., Blangero, J. & Curran, J. E. Lipidomics in the Study of Hypertension in Metabolic Syndrome. Curr.
hypertension Rep. 19, 7, https://doi.org/10.1007/s11906-017-0705-6 (2017).
49. Gonzalez-Covarrubias, V. Lipidomics in longevity and healthy aging. Biogerontology 14, 663–672, https://doi.org/10.1007/s10522-013-9450-7 (2013).
50. Lehmann, R. Diabetes subphenotypes and metabolomics: The key to discovering laboratory markers for personalized medicine? (2013).
51. Grissa, D. et al. Feature Selection Methods for Early Predictive Biomarker Discovery Using Untargeted Metabolomic Data. Front.
Mol. Biosci. 3, 30, https://doi.org/10.3389/fmolb.2016.00030 (2016).
52. Broadhurst, D. I. & Kell, D. B. Statistical strategies for avoiding false discoveries in metabolomics and related experiments.
Metabolomics 2, 171–196 (2006).
53. Saccenti, E., Hoefsloot, H. C. J., Smilde, A. K., Westerhuis, J. A. & Hendriks, M. M. W. Reflections on univariate and multivariate analysis of metabolomics data. metabolomics 10, 361–374 (2014).
54. Vinaixa, M. et al. Mass spectral databases for LC/MS and GC/MS-based metabolomics: state of the field and future prospects. Trends
Anal. Chem. https://doi.org/10.1016/j.trac.2015.09.005 (2015).
55. Lindon, J. C. & Nicholson, J. K. The emergent role of metabolic phenotyping in dynamic patient stratification. Expert. Opin. Drug.
Metab. Toxicol. 10, 915–919, https://doi.org/10.1517/17425255.2014.922954 (2014).
56. Dumas, M. E., Kinross, J. & Nicholson, J. K. Metabolic phenotyping and systems biology approaches to understanding metabolic syndrome and fatty liver disease. Gastroenterology 146, 46–62, https://doi.org/10.1053/j.gastro.2013.11.001 (2014).
57. Wiklund, P. K. et al. Serum metabolic profiles in overweight and obese women with and without metabolic syndrome. Diabetol.
Metab. Syndr. 6, 40, https://doi.org/10.1186/1758-5996-6-40 (2014).
58. Pujos-Guillot, E. et al. Systems Metabolomics for Prediction of Metabolic Syndrome. J. Proteome Res. 16, 2262–2272, https://doi. org/10.1021/acs.jproteome.7b00116 (2017).
59. Sperling, L. S. et al. The CardioMetabolic Health Alliance: Working Toward a New Care Model for the Metabolic Syndrome. J. Am.
Coll. Cardiol. 66, 1050–1067, https://doi.org/10.1016/j.jacc.2015.06.1328 (2015).
60. Wilkinson, M. D. et al. The FAIR Guiding Principles for scientific data management and stewardship. Sci. Data 3, 160018, https:// doi.org/10.1038/sdata.2016.18 (2016).
61. Moher, D., Liberati, A., Tetzlaff, J., Altman, D. G. & Group, P. Preferred reporting items for systematic reviews and meta-analyses: the PRISMA statement. J. Clin. Epidemiol. 62, 1006–1012, https://doi.org/10.1016/j.jclinepi.2009.06.005 (2009).
62. Bardou, P., Mariette, J., Escudie, F., Djemiel, C. & Klopp, C. jvenn: an interactive Venn diagram viewer. BMC Bioinforma. 15, 293,
https://doi.org/10.1186/1471-2105-15-293 (2014).
63. Caimi, G. et al. Evaluation of nitric oxide metabolites in a group of subjects with metabolic syndrome. Diabetes Metab. Syndr. 6, 132–135, https://doi.org/10.1016/j.dsx.2012.09.012 (2012).
64. James-Todd, T. M., Huang, T., Seely, E. W. & Saxena, A. R. The association between phthalates and metabolic syndrome: the National Health and Nutrition Examination Survey 2001-2010. Environ. Health. 15, 52, https://doi.org/10.1186/s12940-016-0136-x (2016). 65. Kulkarni, H. et al. Variability in associations of phosphatidylcholine molecular species with metabolic syndrome in
Mexican-American families. Lipids 48, 497–503, https://doi.org/10.1007/s11745-013-3781-7 (2013).
66. Ntzouvani, A. et al. Amino acid profile and metabolic syndrome in a male Mediterranean population: A cross-sectional study. Nutr.
Metab. Cardiovasc Dis., https://doi.org/10.1016/j.numecd.2017.07.006 (2017).
67. Olszanecka, A., Kawecka-Jaszcz, K. & Czarnecka, D. Association of free testosterone and sex hormone binding globulin with metabolic syndrome and subclinical atherosclerosis but not blood pressure in hypertensive perimenopausal women. Arch. Med. Sci.
12, 521–528, https://doi.org/10.5114/aoms.2016.59925 (2016).
68. Ramakrishanan, N., Denna, T., Devaraj, S., Adams-Huet, B. & Jialal, I. Exploratory lipidomics in patients with nascent Metabolic Syndrome. J. Diabetes its Complications 32, 791–794, https://doi.org/10.1016/j.jdiacomp.2018.05.014 (2018).
69. Shim, K., Gulhar, R. & Jialal, I. Exploratory metabolomics of nascent metabolic syndrome. J. Diabetes its Complications 33, 212–216,
https://doi.org/10.1016/j.jdiacomp.2018.12.002 (2019).
70. Tremblay-Franco, M. et al. Effect of obesity and metabolic syndrome on plasma oxysterols and fatty acids in human. Steroids 99, 287–292, https://doi.org/10.1016/j.steroids.2015.03.019 (2015).
71. Antonio, L. et al. Associations between sex steroids and the development of metabolic syndrome: A longitudinal study in European men. J. Clin. Endocrinol. Metab. 100, 1396–1404, https://doi.org/10.1210/jc.2014-4184 (2015).
72. Barrea, L. et al. Trimethylamine-N-oxide (TMAO) as novel potential biomarker of early predictors of metabolic syndrome.
Nutrients, 10, https://doi.org/10.3390/nu10121971 (2018).
73. Blouin, K. et al. Contribution of age and declining androgen levels to features of the metabolic syndrome in men. Metabolism 54, 1034–1040, https://doi.org/10.1016/j.metabol.2005.03.006 (2005).
74. Cheng, S. et al. Metabolite profiling identifies pathways associated with metabolic risk in humans. Circulation 125, 2222–2231,
https://doi.org/10.1161/circulationaha.111.067827 (2012).
75. Favennec, M. et al. The kynurenine pathway is activated in human obesity and shifted toward kynurenine monooxygenase activation. Obes. (Silver Spring) 23, 2066–2074, https://doi.org/10.1002/oby.21199 (2015).
76. Gao, X., Tian, Y., Randell, E., Zhou, H. & Sun, G. Unfavorable associations between serum trimethylamine N-oxide and L-carnitine levels with components of metabolic syndrome in the Newfoundland population. Frontiers in Endocrinology, 10, https://doi. org/10.3389/fendo.2019.00168 (2019).
77. Ho, J. E. et al. Metabolomic Profiles of Body Mass Index in the Framingham Heart Study Reveal Distinct Cardiometabolic Phenotypes. PLoS One 11, e0148361, https://doi.org/10.1371/journal.pone.0148361 (2016).
78. Huynh, K. et al. High-Throughput Plasma Lipidomics: Detailed Mapping of the Associations with Cardiometabolic Risk Factors.
Cell Chem. Biol. 26, 71–84.e74, https://doi.org/10.1016/j.chembiol.2018.10.008 (2019).
79. Liu, J. et al. A Mendelian Randomization Study of Metabolite Profiles, Fasting Glucose, and Type 2 Diabetes. Diabetes 66, 2915–2926,
https://doi.org/10.2337/db17-0199 (2017).
80. Marchand, G. B. et al. Increased body fat mass explains the positive association between circulating estradiol and insulin resistance in postmenopausal women. Am. J. Physiol. Endocrinol. metabolism. 314, E448–E456, https://doi.org/10.1152/ajpendo.00293.2017
(2018).
81. Neeland, I. J. et al. Relation of plasma ceramides to visceral adiposity, insulin resistance and the development of type 2 diabetes mellitus: the Dallas Heart Study. Diabetologia 61, 2570–2579, https://doi.org/10.1007/s00125-018-4720-1 (2018).
82. Ottosson, F., Smith, E., Melander, O. & Fernandez, C. Altered asparagine and glutamate homeostasis precede coronary artery disease and type 2 diabetes. J. Clin. Endocrinol. Metab. 103, 3060–3069, https://doi.org/10.1210/jc.2018-00546 (2018).
83. Wang-Sattler, R. et al. Novel biomarkers for pre-diabetes identified by metabolomics. Mol. Syst. Biol. 8, 615, https://doi.org/10.1038/ msb.2012.43 (2012).
84. Lind, P. M., Zethelius, B. & Lind, L. Circulating levels of phthalate metabolites are associated with prevalent diabetes in the elderly.
85. Liu, J. et al. Metabolomics based markers predict type 2 diabetes in a 14-year follow-up study. (2017).
86. Meikle, P. J. et al. Plasma Lipid Profiling Shows Similar Associations with Prediabetes and Type 2 Diabetes. PLoS ONE, 8 (9) (no
pagination), https://doi.org/10.1371/journal.pone.0074341 (2013).
87. Peddinti, G. et al. Early metabolic markers identify potential targets for the prevention of type 2 diabetes. Diabetologia, https://doi. org/10.1007/s00125-017-4325-0 (2017).
88. Suvitaival, T. et al. Lipidome as a predictive tool in progression to type 2 diabetes in Finnish men. Metabolism, https://doi. org/10.1016/j.metabol.2017.08.014 (2017).
89. Yengo, L. et al. Impact of statistical models on the prediction of type 2 diabetes using non-targeted metabolomics profiling. (2016).
Acknowledgements
S. Monnerie is recipient of a doctoral fellowship from the INRA DID’IT metaprogramme. The Centre Hospitalier
de l’Université de Montréal is acknowledged for the salary support of D. Ziegler.
Author contributions
B.C., E.P.G. and P.G. designed the study; D.Z. performed the search; S.M., B.C., E.P.G. and P.G. analyzed the data; J.A.M. gave advices on clinical aspects of selected articles; S.M., B.C., E.P.G. and P.G. wrote the manuscript and all authors reviewed the content.
competing interests
The authors declare no competing interests.
Additional information
Supplementary information is available for this paper at https://doi.org/10.1038/s41598-019-56909-7. Correspondence and requests for materials should be addressed to E.P.-G.
Reprints and permissions information is available at www.nature.com/reprints.
Publisher’s note Springer Nature remains neutral with regard to jurisdictional claims in published maps and institutional affiliations.
Open Access This article is licensed under a Creative Commons Attribution 4.0 International License, which permits use, sharing, adaptation, distribution and reproduction in any medium or format, as long as you give appropriate credit to the original author(s) and the source, provide a link to the Cre-ative Commons license, and indicate if changes were made. The images or other third party material in this article are included in the article’s Creative Commons license, unless indicated otherwise in a credit line to the material. If material is not included in the article’s Creative Commons license and your intended use is not per-mitted by statutory regulation or exceeds the perper-mitted use, you will need to obtain permission directly from the copyright holder. To view a copy of this license, visit http://creativecommons.org/licenses/by/4.0/.