HAL Id: inria-00516580
https://hal.inria.fr/inria-00516580
Submitted on 10 Sep 2010
HAL is a multi-disciplinary open access
archive for the deposit and dissemination of
sci-entific research documents, whether they are
pub-lished or not. The documents may come from
teaching and research institutions in France or
abroad, or from public or private research centers.
L’archive ouverte pluridisciplinaire HAL, est
destinée au dépôt et à la diffusion de documents
scientifiques de niveau recherche, publiés ou non,
émanant des établissements d’enseignement et de
recherche français ou étrangers, des laboratoires
publics ou privés.
GVSR: an On-Line Guide for Choosing a Graph
Visualization Software
Bruno Pinaud, Pascale Kuntz
To cite this version:
Bruno Pinaud, Pascale Kuntz. GVSR: an On-Line Guide for Choosing a Graph Visualization
Soft-ware. 18th International Symposium on Graph Drawing, Sep 2010, Constance, Germany. pp.400-401,
�10.1007/978-3-642-18469-7_41�. �inria-00516580�
GVSR: an On-Line Guide for Choosing a Graph
Visualization Software
Bruno Pinaud1and Pascale Kuntz2
1 Bordeaux I Univ., CNRS UMR 5800 LaBRI, INRIA Bordeaux Sud-Ouest (Gravité), France
2 CNRS UMR 6241 LINA, site école polytechnique de l’université de Nantes, France
Abstract. It is easy to find graph visualization applications for all sorts of uses. However, choosing an appropriate application may be difficult. This poster pre-sents a website (http://gvsr.polytech.univ-nantes.fr/) built to help users to choose a program adapted to their problems. So far, this site ref-erences eighty programs and aims at helping users both in their choices and in comparing the programs. The site is also designed as a tool repository helping the community to access and compare the available tools, and benchmark new techniques and algorithms.
Keywords: Graph Visualization Software, On-Line Repository
1
Introduction
The profusion of available graph visualization applications may even confuse an expert in this field. Some programs have been developed in close partnership with the scien-tific community (Pajek, Cytoscape), others are purely commercial, or some are general graph manipulation and visualization software (Tulip). Generally speaking, the choice of a program well-adapted to both the data and the methodology is difficult. Some books can be used as guides [1, 2], and several websites present lists of programs [3, 4]. How-ever, those websites plainly list the existing software, or make them accessible through snapshots. Consequently much effort is required to compare the various programs be-fore choosing the best one for the problem considered.
Those observations led us to develop GVSR (http://gvsr.polytech.univ-nantes.fr). Its added value is to offer users query about existing software based on commonly used criteria such as scalability, implementation issues or type of uses. Our objectives are to facilitate the users’ choices and to compare programs with common criteria. The website also presents the programs with a uniform text-based description. This site keeps evolving and so far contains eighty various software descriptions. In addition, the site allows users to propose new programs by simply completing an en-closed form. The site is also designed as a tool repository helping the user to access and compare the available Graph Visualization tools, and benchmark new techniques and algorithms. The whole community can benefit from the ability to reproduce pub-lished results, and from comprehensive comparisons with previous work. Thus, GVSR can be seen as a contribution to improving both the accessibility and quality of graph visualization tools.
2 Pinaud and Kuntz
2
How to use the site?
The site proposes four ways to find a software : 1) a tag cloud with the software names (the more a software page is accessed, the bigger its name is displayed); 2) the “Software List” link gives access to a simple alphabetical order list; 3) the “Advanced Search” link gives access to a search engine on the software database; 4) the “Start Browsing Now” button to start navigating in a taxonomy covering all the criteria used to described software, providing a structured exploration mode of the repository.
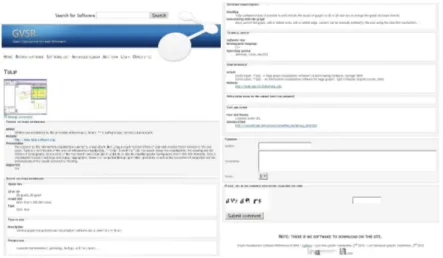
Each software description (Fig. 1) page is made of a screenshot, general information (e.g. website, . . . ), specific information on the visualization, technical information (e.g. license(s), . . . ) and references. At the bottom of the page, one can write a comment and score the software. After validation, these information will be added on the page.
Fig. 1. Example of a software description page.
3
Future Works
GVSR keeps evolving by a regular watch on the database, the addition of new programs and functionalities. We are working on an interactive visualization of the taxonomy as a graph. We also plan to directly host samples datasets to benchmark programs.
References
1. Kaufmann, M., Wagner, D. (eds.): Drawing Graphs: Methods and Models, LNCS, vol. 2025. Springer (2001)
2. Mutzel, P., Jünger, M.: Graph Drawing Software. Springer (2003)
3. http://rw4.cs.uni-sb.de/users/sander/html/gstools.html 4.