Publisher’s version / Version de l'éditeur:
Vous avez des questions? Nous pouvons vous aider. Pour communiquer directement avec un auteur, consultez la
première page de la revue dans laquelle son article a été publié afin de trouver ses coordonnées. Si vous n’arrivez pas à les repérer, communiquez avec nous à PublicationsArchive-ArchivesPublications@nrc-cnrc.gc.ca.
Questions? Contact the NRC Publications Archive team at
PublicationsArchive-ArchivesPublications@nrc-cnrc.gc.ca. If you wish to email the authors directly, please see the first page of the publication for their contact information.
https://publications-cnrc.canada.ca/fra/droits
L’accès à ce site Web et l’utilisation de son contenu sont assujettis aux conditions présentées dans le site LISEZ CES CONDITIONS ATTENTIVEMENT AVANT D’UTILISER CE SITE WEB.
Proceedings of the 12th International Conference on Alkali-Aggregate Reaction in
Concrete: 15 October 2004, Beijing, China, pp. 257-265, 2004-10-01
READ THESE TERMS AND CONDITIONS CAREFULLY BEFORE USING THIS WEBSITE.
https://nrc-publications.canada.ca/eng/copyright
NRC Publications Archive Record / Notice des Archives des publications du CNRC :
https://nrc-publications.canada.ca/eng/view/object/?id=b631d6dc-c93c-4a02-ac54-6eb5156b8f7a https://publications-cnrc.canada.ca/fra/voir/objet/?id=b631d6dc-c93c-4a02-ac54-6eb5156b8f7a
NRC Publications Archive
Archives des publications du CNRC
This publication could be one of several versions: author’s original, accepted manuscript or the publisher’s version. / La version de cette publication peut être l’une des suivantes : la version prépublication de l’auteur, la version acceptée du manuscrit ou la version de l’éditeur.
Access and use of this website and the material on it are subject to the Terms and Conditions set forth at
Mass change, petrography and damage ratings of bars at the
completion of the concrete microbar test
Mass change, petrography and damage ratings of
bars at the completion of the concrete microbar test
Grattan-Bellew, P.E.; Du-you, L.; Fournier, B.;
Mitchell, L.
NRCC-47358
A version of this document is published in / Une version de ce document se trouve dans :
Proceedings of the 12
thInternational Conference on Alkali-Aggregate Reaction
in Concrete, Beijing, China, Oct. 15-19, 2004, pp. 257-265
P.E. Grattan-Bellew. Phone: 1-613-729-9181 Email:<p.grattan-bellew@sympatico.ca>
MASS CHANGE, PETROGRAPHY AND DAMAGE
RATINGS OF BARS AT THE COMPLETION OF THE
CONCRETE MICROBAR TEST
*P.E. Grattan-Bellew
a, Lu Du-you
b, Benoit Fournier
c, Lyndon Mitchell
aa. Institute for Research in Construction, National Research Council of Canada, Building M-20, Ottawa, ON, Canada, K1A 0R6.
b. College of Materials Science and Engineering Nanjing University of Technology, No. 5 New Model Road, Jiangsu 210009, China
c. Canadian Centre for Mineral and Energy Technology, Materials Technology Laboratory,
405 Rochester Street, Ottawa, ON, Canada, K1A 0G1.
ABSTRACT
During the course of the concrete microbar test the mass changes of the bars were measured at the same time as the lengths. The mass changes of the bars are characteristic of the petrography of the aggregates. Microbars made with “inert” alumina grinding balls showed continuous mass gain for 50 days, but virtually no expansion. In contrast, microbars containing 50% opal and a non-reactive dolostone exhibited mass loss for about 10 days that was proportional to expansion. Thereafter, the mass loss leveled off. The gel formed by the reaction migrated into the NaOH solution where it precipitated.
The greywackes and sandstones, in which microcrystalline quartz is the reactive component, exhibited a mass gain of about 0.4% in the first 8 days followed my mass loss. Only one unaltered volcanic rock, an andesite, was evaluated. It showed mass gain for 15 days but thereafter showed no significant change. Cristobalite is the main reactive component in the andesite. The mass change graphs of the gravels reflected the composition of the major component of the gravel.
The damage rating indices (DRI’s) were determined at the end of the tests. All the microbars showed extensive fine cracking, without gel, in the cement paste. This pattern of cracking is quite different from that observed in concrete prisms or in cores from field concretes.
No correlation was found between the microcrystalline quartz content of many aggregates and expansion in the microbar test. The lack of correlation between expansion in the concrete prism and concrete microbar tests raises serious concerns about the advisability of using the results of the microbar test to evaluate the potential expansivity of aggregates for use in concrete without first confirming the results in a concrete prism test.
Key words: Alkali-aggregate reactivity, test methods, mass change, petrography
1 INTRODUCTION
In the concrete microbar test that is being developed to evaluate the potential expansivity of both alkali-silica (ASR) and alkali-carbonate (ACR) reactive aggregates, the mass change of the bars was also monitored; the damage rating indices (DRI’s) of the bars and the petrography of the aggregates were determined at the end of the test Grattan-Bellew [1]. The measurement of the mass changes and DRI’s of the bars were undertaken to help provide some insight into the mechanism of expansion in this test.
The protocol for the concrete microbar test is broadly similar to that of ASTM C 1260 [2] except that the aggregate grading is between 12.5 and 4.75 mm, the mixture design is one part aggregate to one part portland cement, the bar size is 40 x 40 x 160 mm, and
the storage time of the bars in 1 M NaOH @ 80°C is 30 days.
2 RESULTS
2.1 Aggregate Groupings
Aggregates may be divided into four groups based on the signatures of the mass-change curves:
1. Opal that exhibits continuous mass loss for 15 days and then stabilizes.
2. Limestones, both ASR and ACR and unaltered andesite that exhibit continuous mass gain for 30 days.
3. Greywackes, sandstones, cataclastite,
that all exhibit mass gain for about 10 days followed by mass loss.
4. Non-Reactive aggregates, such as dolostones and alumina grinding balls that exhibit a small mass gain (~0.3%) at 30 days.
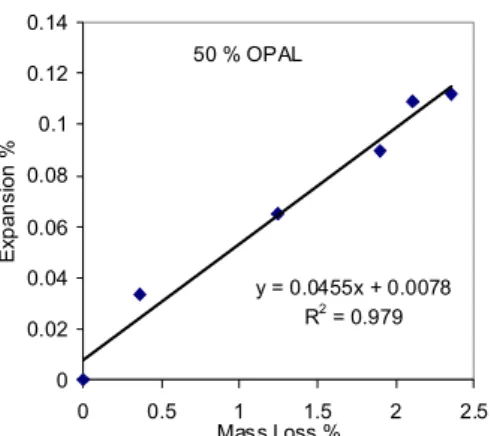
The opal used in the experiments is from Nevada USA. It does not exhibit a pessimum in the concrete microbar test. The expansion and mass gain graph of bars containing 50% opal is shown in Fig.1a. The
expansion and mass change curves for the 5% and 25% opal microbars are similar to that of the 50% opal bars, only the values are lower. Fig. 1b shows that both expansion and mass change are proportional to the opal content of the bars. Expansion had virtually ceased after 15 days in NaOH for the microbars containing 5%, 25% and 50% opal. During the first 15 days expansion is proportional to mass loss, Fig 1c.
The reason why expansion and mass loss taper off after
(a)
E opal
(b) Fig 1:
a) Expansion and mass change of microbars containing 50% opal and a non-expansive dolostone.
b): Graph showing expansion and mass change of opal with opal content of the aggregate. about 15 days is not understood, as there is still a considerable amount of unreacted opal left in the microbars even after 30 days in NaOH. After 30 days in NaOH the opal particles were highly corroded, Fig.1d. As would be expected, the number of
Fig. 1c: Graph of expansion versus mass loss of microbars containing 50% opal. corroded opal particles is roughly proportional the opal content of the microbars. However, the occurrence of vastly more cracking, without gel, in the cement paste in the 5% opal sample is unexpected. It possibly indicates the occurrence of a pessimum proportion?
2.2 General Observations of Microbars Containing
Opal
Gel was observed filling a few cracks in the cement paste in the polished surface of the microbar containing 5% opal; it was not found in the other bars although they had expanded and cracked. The gel is soluble in NaOH and is precipitated as a sodium, calcium aluminum silicate hydrate in the NaOH immersion solution. Assuming that it would take a number of days for the NaOH to penetrate the microbars and reach the opal particles, the opal would have sufficient time to react, form a gel and expand, before dissolution began.
Fig.1d: Modified DRI’s of microbars containing 5%, 25% and 50 % opal. Damage due to cracking of the aggregate particles has been omitted.
CA – coarse aggregate. ca
However, particularly in the case of the microbars with 50% opal, mass loss commenced almost immediately, indicating that the gel was solubilized very rapidly. This raised an interesting question regarding the mechanism of expansion in classical ASR. The widely held hypothesis is that expansion is caused by the hydroxyl ions in the pore solution
50% OPAL -0.3 -0.25 -0.2 -0.15 -0.1 -0.05 0 0.05 0.1 0.15 0 10 20 30 40
Days in 1 M NaOH @ 80 Deg. C
E x pa ns ion % & M a ss G ai n /10 % Expansion % Mass Gain/10 % 50 % OPAL y = 0.0455x + 0.0078 R2 = 0.979 0 0.02 0.04 0.06 0.08 0.1 0.12 0.14 0 0.5 1 1.5 2 2.5 Mass Loss % E x pa ns io n % y = 0.0005x + 0.0856 R2 = 0.988 y = 0.0041x + 0.045 R2 = 0.9278 0 0.05 0.1 0.15 0.2 0.25 0.3 0 10 20 30 40 50 Opal % E x pans io n % & M as s L os s /10 % Expansion % Mass Loss/10% 0 100 200 300 400 500 600 700 800 5 25 50 O p al C ont e nt % Modified DRI's C.Agg Open Crack CA/DEBOND CEM/CRACK CEM/CRACK/GEL Corroded opal
PASTE CRACK & GE L PASTE CRACK GEL PAS TE CRACK GEL Gel in cracks
reacting with poorly crystalline silica to produce a sol/gel that absorbs moisture and swells, Stark [3]. If however, the gel is mobilized by NaOH solution it is difficult to understand how it can cause swelling pressure. The alternative hypothesis that expansion is the result of a dissolution process appears to have some merit, Beaudoin, [4].
2.3 Limestones
The microbars containing all types of limestones evaluated, to date, exhibit more or less continuous mass gain for at least 30 days Fig. 2a. Most of the carbonate
rocks showed a
mass gain of between 0.2 to
Fig. 2a: Mass gain of microbars containing assorted ASR, ACR and non-reactive dolostone carbonate rocks. 0.5% at 30 days. The mean mass gain of microbars containing non-reactive dolostones and inert alumina balls is 0.3% at 30 days.
2.4 General Observations of Microbars Containing Limestones
The initial mass gain of the microbars stored in
NaOH must be ascribed to moisture uptake by the hydrating cement. The microbars containing “ inert” alumina grinding balls as aggregate showed a mass gain of~0.2% in the first 10 days of storage in NaOH, and a gain of 0.3% at 30 days. The reactive quartz particles in the siliceous limestones are in the clay particle size range. The quartz content of the Spratt limestone is 5-6% so the amount of gel produced would be relatively small. This coupled with the low permeability of the micritic limestone would result in at lease some of the gel produced by the reaction being retained. This is born out by the observation of gel in the polished microbars at the end of the experiments, Fig 2b. As gel is retained in the microbars containing siliceous limestones mass gain is continuous and more or less proportional to the expansion after the first 6 days, Fig 2c. It is interesting to note that the precipitate in the NaOH storage solution in the case of the microbars containing both Kingston and Spratt limestone aggregates was a calcium sodium aluminum silicate hydrate with a small amount of potassium, with Ca/Si of 1.5 and a Na/Si of 0.08 as determined by semi-quantitative EDX analysis. By contrast, the precipitate
derived from greywackes and other aggregates in which microcrystalline quartz is the reactive component consisted of a sodium calcium aluminum silicate hydrate with Ca/Si of 0.33 and a Na/Si of 0.38.
Fig. 2b: Modified DRI of microbar of Spratt limestone at end of test. The cracking in the cement paste has been removed from the chart so that the contribution of the other features e.g. filling cracks in the aggregate and in the cement paste is enhanced.
CA – coarse aggregate.
Fig,2c: Mass gain of limestone from West Virginia versus expansion.
The significantly higher calcium content of the precipitates derived from rocks containing Spratt ASR and Kingston ACR limestone is surprising because the gel has to migrate through a considerable thickness of cement paste containing a large amount of calcium hydroxide. Evidently, the gel is picking up more calcium from the limestones than from the calcium hydroxide in the pore solution.
2.4 Sandstones & Greywackes
The three sandstones tested are petrographically broadly similar. The main difference between them is the occurrence of quartz overgrowths around the original quartz grains in the Potsdam sandstone, [5] Fig 3a that are absent in the other two sandstones. The Norwegian red sandstone is a feldspathic
West Virginia Limestone
0 0.1 0.2 0.3 0.4 0.5 0.6 0 0.5 1 1.5 2 Mass Gain % E x pa ns io n % 6 days -0.2 0 0.2 0.4 0.6 0.8 1 1.2 1.4 1.6 1.8 0 10 20 30 40 50
Days in 1 M NaOH @ 80 Deg. C.
Ma ss G a in % Spratt Lst W. Virginia Lst Korea DH Lst Nelson Dol Vienna Dol Kingston dol Lst
0 100 200 300 400 1 Modified DRI's CA/CRACK/GEL CA Open Crack CA/DEBOND CEM/CRACK/GEL
C RACKS IN AGGREGATE CA OPEN CRACKS
sandstone with a minor amount of micro-crystalline quartz. It is not dissimilar to greywacke.
Fig 3a: Quartz grain in Potsdam sandstone with overgrowth (O). The arrows point to inclusions outlining the original grain boundary.
Fig. 3b Mass change of microbars containing sandstones
The Norway quartzite is similar to the red sandstone. Microbars containing all three sandstones exhibit mass gain for the first 5 to 10 days followed by mass loss, Fig. 3b. The expansion and mass gain of microbars containing Potsdam sandstone are shown in Fig. 3c.
Greywackes
The greywackes typically contain large quartz, feldspar grains and rock fragments with a grain size of 50-100 µm.. The interstitial material between the large grains is a intimate mixture of microcrystalline quartz and sericite. The fine microcrystalline quartz that has a grain size of 5 to 40 µm is the reactive component, The mass gain signature of the greywackes is similar to that of the sandstones, i.e. there is an initial mass gain followed by mass loss. I have included four Norwegian aggregates with the greywackes: a mylonite, a
cataclastite, a black sandstone and a phyllite. In all four aggregates the reactive component is microcrystalline quartz with a texture similar to that in the greywackes.
Fig. 3c: Expansion and mass gain/10 of microbars containing Potsdam sandstone. Grattan-Bellew [6]. and sericite.
2.5 Volcanic Rocks
Only two volcanic rocks were evaluated in this
study, an andesite from Japan, courtesy of T. Katayama and an Australian volcanic rock. Concrete microbars made with the two aggregates exhibited about the same amount of expansion, Fig 4a. However, the mass loss signatures of the two were quite different, Fig 4b.
2.6 General Observations of microbars containing volcanic rocks
Despite the almost identical expansions of concrete microbars containing andesite from Japan and a volcanic rock from Australia their mass gain signatures are vastly different. This difference is readily explained by differences in the mineralogy of the two aggregates. The andesite has the texture and mineralogy typical of this type of rock. The rock consists of an intimate mixture of fine feldspar laths, orthopyroxene and cristobalite, a highly reactive mineral.
Fig.4 a) Expansion of concrete microbars containing an andesite from Japan and a volcanic rock from Australia.
The Australian volcanic rock has been silicified and now consists of a matrix of microcrystalline quartz with occasional feldspar phenocrysts, Fig 4d. Thus the reactive component is microcrystallinequartz. Sandstones -1 -0.5 0 0.5 1 1.5 2 2.5 3 0 10 20 30 40
Days in 1 M NaOH @ 80 Deg. C
Ma ss G a in % Potsdam Norway Qzt Norway Red Sdst 0 0.05 0.1 0.15 0.2 0.25 0 20 40
Days in 1 M NaOH @ 80 Deg. C
E xp ans io n % J. Andesite Aus. Volcanic -0.05 0 0.05 0.1 0.15 0.2 0.25 0.3 0 20 40 60
Days in 1 M NaOH @ 80 Deg. C.
Ex pa ns io n & M as s G a in/ 10 % MASS GAIN EXPANSION
The presence of the microcrystalline quartz probably explains why this aggregate has the same mass gain signature as the greywackes, cataclastite and mylonite. The latter two aggregates in particular are composed dominantly of microcrystalline quartz.
Fig. 4b: Mass gain of concrete microbars containing an andesite from Japan and a volcanic rock from Australia.
Fig. 4c: Thin section of andesite showing feldspar laths and ortho pyroxene.
Fig. 4d: Thin section, viewed between crossed polarizers showing a large feldspar
phenocrysts (F) in a matrix of microcrystalline quartz.
2.7 Gravels
The potential expansivity of six gravels, two from Canada, three from USA and one from Sydney Australia were evaluated in the concrete microbar test. The expansions and mass gain of the bars is shown in Fig 5. Apart from the microbars containing the highly expansive New Mexico aggregate with a 30-day expansion of 0.2%, the expansions of the other bars are clustered at around 0.1 ± 0.05%.
(a)
(b) Fig. 5:
a) Expansions of assorted gravels in the concrete microbar test
b) Mass Gain of microbars containing assorted gravel aggregates.
2.8 General Comments on microbars containing gravel aggregate
As might be expected, due to the variable composition of the gravels, the mass gain signatures of the microbars also vary. The mass gain signature of the Wyoming gravel looks similar to that of the limestones, while that of the Edmonton gravel is similar to the pattern of greywackes. The mass gain signature of the microbars containing the New Mexico gravel is also similar to that of the greywackes. The high expansion of the microbars containing the New Mexico gravel is likely due to the presence of chert and gneiss containing much microcrystalline quartz in this gravel. The high mass loss of the microbars containing the Edmonton gravel was expected as it is composed mainly of
-1 -0.8 -0.6 -0.4 -0.2 0 0.2 0.4 0.6 0.8 1 1.2 0 10 20 30 40
Days in 1 M NaOH @ 80 Deg. C
Ma ss G a in % Japan Australian Volcanics GRAVELS -1.5 -1 -0.5 0 0.5 1 1.5 0 10 20 30 40 50
Days in 1 M NaOH @ 80 Deg. C
Ma s s G a in % Sudbury Gvl Edmonton N. Mexico S. Dakota Sydney Aus. Wyoming -0.05 0 0.05 0.1 0.15 0.2 0.25 0.3 0 10 20 30 40 50 60
Days in NaO H @ 80 Deg. C.
E x pan si on % S ud bury S yd ney A us. S ou th D akota E dmo nton W yoming N . Me xico
microcrystalline quartz (chert) in silicified tuff that would be expected to be relatively soluble in hot alkaline solution. The absence of mass loss of the microbars containing the Wyoming gravel is likely due to the relatively small amount of microcrystalline quartz in this material.
3 DISCUSSION
3.1 Correlation of Microstructure of Rocks with Expansion in the microbar Test
The expansions, in the concrete prism and microbar tests, of selected greywackes, sandstones and other rocks containing large amounts of microcrystalline quartz, is shown in Fig.6. For this series of rocks there is clearly no correlation between the expansions
Fig. 6: Expansions of concrete microbars and concrete prisms containing selected aggregates containing microcrystalline quartz.
Sandstone – (SDST)
obtained in the two methods. This result is very disturbing. The only conclusion that can be drawn is that aggregates exhibiting expansions of over 0.04% at 30 days in the microbar test are deleteriously expansive in the concrete prism test.
It has been shown that microcrystalline quartz extracted from a porphyroblastic schist was the reactive component, Thomson & Grattan-Bellew, [7]. It would therefore be of interest to examine the correlation between the microcrystalline quartz content and of rocks and expansion. Wigum 1995 also examined the correlation between expansion in ASTM C1260 test and the mean grain size of quartz in the aggregates, [8]. There was some correlation down to a grain size of about 50 µm, but a decrease in the grain size below this had little effect on expansion.
Considering the series of aggregates, in a horizontal
band, on Fig.6 at a microbar expansion of 0.1 ±
0.015%, expansions of these aggregates in the concrete prism test range from 0.086% for a phyllite from Norway, to 0.296% for a Norwegian black sandstone.
There do not appear to be any obvious microstructural or compositional differences between for example the greywacke from Malay Falls with a concrete prism expansion of 0.096 and the black sandstone that is compositionally and texturally very similar to a greywacke. Based on composition and texture, the latter two aggregates would be expected to show about. the same amount of expansion in the concrete prism test as they do in the microbar test. The rhyolite aggregate that has been silicified and is composed almost entirely of microcrystalline quartz would, based on the content of microcrystalline quartz, be expected to be more expansive that the greywackes, but in the microbar test it showed the same expansion as the Malay Falls greywacke and the black sandstone.
Next consider three aggregates, the Conrad greywacke, the rhyolite and the Norwegian mylonite with expansions in the concrete prism test of 0.196, 0.175 and 0.141%, respectively, (line AB in Fig.6.) These three aggregates, that show only minor differences in expansions in the concrete prism test, show large differences of expansion in the microbar test. The mylonite expanded by 0.048% while the greywacke expanded by 0.15%. This result again suggests that the factors controlling expansion in the two test methods are different. This difference undoubtedly explains the lack of correlation between expansion in the microbar and concrete prism tests. The mylonite and the rhyolite contain much more microcrystalline quartz than the greywacke and on the basis of this would be expected to cause more expansion in the microbar test. Kerrick & Hooton [9] showed that for a given microcrystalline quartz content those aggregates with foliation exhibited more expansion in the C 1260 Test. However, this conclusion does not appear to apply to the aggregates tested in this program. For example, the mylonite is quite sheared, and so on the basis of Kerrick’s work might be expected to exhibit more expansion than the rhyolite that is not sheared but is otherwise apparently similar.
3.2 Damage Rating Indices of Microbars
The DRI’s of the microbars were determined, at the end of the testing period, to provide some insight on the processes leading to expansion. The DRI’s of microbars containing an assortment of aggregates are shown in Fig.7. For comparison purposes, the DRI of a concrete prism made with Sudbury gravel is also shown. The DRI signature of the prism containing Sudbury gravel is typical of that obtained from concretes affected by ASR. The scales of the DRI charts of the individual microbars have been proportionally reduced to make them fit on the one chart.
There are obvious differences in the damage features in the concrete prism after one year of 0 0.02 0.04 0.06 0.08 0.1 0.12 0.14 0.16 0 0.05 0.1 0.15 0.2 0.25 0.3 0.35
Concrete Prism Expansion %
Conc re te M ic rob ar E xpa ns ion % MYLONITE BLACK SDST CATACLASTITE RHYOLITE MALAY FALLS GREYWACKE PHYLLITE QUEENSLAND GREYWACKE RED SDST SPRING HILL GREYWACKE CONRAD GREYWACKE B A
exposure to 100% humidity and 38°C and in the concrete microbars after 30 days in 1 M NaOH @ 80 Deg. C. The amount of cracking in aggregate particles is much less in the microbars, and gel that was present in some of the cracks in the concrete prism was absent from the microbars. Cracking in the cement paste without gel is plentiful in the microbars
Fig.7: Modified DRI’s of concrete microbars containing an assortment of aggregates and of a concrete prism made with Sudbury gravel. Aggregate with. Cracks
Aggregate with. Cracks & gel (CG); Open Cracks in aggregate..(OC);
Debonding around aggregate (DEBONDING); Reaction rims around aggregates
Cracking in cement paste
Cracking with gel in cement paste
but absent in the concrete prisms in which many cracks in the paste are filled with gel. Cracking in the cement paste was also observed in the microbars containing innocuous alumina grinding balls as aggregate. As there was no reaction of the alumina the cracking must be due to shrinkage of the cement paste due, presumably to the absence of fine aggregate that would act as a shrinkage restrainer. However in the case of the microbars with Sudbury gravel aggregate part of the large amount of cracking in the paste must be due to the reaction of the aggregate. Similar large amounts of cracking in the cement paste were observed in all the microbars that were evaluated. It is thus evident that the type of damage occurring the microbars is significantly different from that occurring in concrete prisms or in concrete in structures that typically show about the same proportion of damage features observed in the concrete prisms. For this reason, it is not surprising that there is poor correlation between expansion in the concrete prism and microbar tests.
4 CONCLUSIONS
• The mass-gain graph signature of the
microbars is characteristic of the aggregate used
• Microbars containing inert alumina grinding
balls increased in mass continuously for at least 50 days. The mass-gain at 30 days was 0.3%. As no reaction had occurred, the mass-gain had to be due to absorption of moisture by the hydrating cement paste. Mass-gain of non-expansive limestones and dolostones ranged from 0.15 to 0.5%.
• Microbars containing opal exhibit
continuous mass loss. During the first 15 days mass-loss is proportional to expansion
• In microbars containing opal both mass-loss
and expansion taper off after about 12 days yet much of the opal remains in the bars
• No gel was observed in the microbars
containing opal. Evidently, it had all gone into the NaOH solution where it precipitated out
• Microbars containing ASR & ACR
limestones showed continuous mass-gain with time.
• The microbars containing Spratt and Quebec
City limestones have gel in some of the cracks although it was also in the NaOH storage solution.
• The gel in the storage containers of the
limestones was a calcium silicate hydrate with small amounts of sodium and aluminum. The gel from other aggregates was a sodium silicate hydrate with minor amounts of calcium and aluminum
• The microbars containing greywackes and
sandstones all exhibit mass-gain for about the first 10 days followed by mass loss. The initial mass gain is usually ~ 0.6% except for the microbars containing the Potsdam sandstone that had a mass gain of 2.5%. In the Potsdam sandstone the reactive component is the quartz overgrowths while in all the other sandstones and greywackes the reactive component is microcrystalline quartz.
• The microbars containing andesite aggregate from Japan in which the reactive component is mainly cristobalite exhibited continuous mass-gain.
• The absence of correlation between expansions in the concrete microbars and concrete prisms is thought to be due to significantly different degrees of reactivity of microcrystalline quartz in the alkaline pore solution at 38°C and at 80°C.
• The absence of correlation between concrete microbars and prisms raises serious concerns about the feasibility of accepting the results of the microbar test for evaluating
aggregates for use in concrete without running confirmatory concrete prism tests.
0 20 40 60 80 100 120 140 Alumina balls Sudbury M-bar Sudbury Prism Modified DRI's OC OC OC OC CA DEBONDED CA DEBONDED CA CRACK GEL
REFERENCES
[1] Grattan-Bellew, P.E., “Laboratory Evaluation of Alkali-Silica Reaction in Concrete from Saunders Generating Station,” ACI Materials Journal 92, March-April 1995.
[2] ASTM C 1260-94, Standard Test Method for Determining the Potential Alkali Reactivity of Combinations of Cementious Materials and Aggregate (Accelerated Mortar-Bar Method). Annual Book of ASTM Standards 2002, Vol 04.02, American Society for Testing and Materials, 1916 Race Street, Philadelphia, PA 19103.
[3] Stark, David, “Alkali-Silica Reaction and its Effects on Concrete,” Proc. 2nd Internat. Conference on Alkali-Reactions in Hydroelectric Plants and Dams, Chattanooga, Tennessee, October 1995, 9-17.
[4] Beaudoin, J.J., Raki, L., and Marchand, J.,”The Use of Compacts for Durability Investigation of Cement-Based Materials,” J. Materials Science, 38, 2003, 4957-4964.
[5] Raphael, S., & Albert, P., “Alkali-Silica Reaction in the Beauharnois Powerhouses, Beauharnois,” Concrete Alkali-Aggregate Reactions, Ed. P.E. Grattan-Bellew,
Noyes Publications, Mill Road, Park Ridge, New Jersey, 07656, 1987, 10-16.
[6] Grattan-Bellew, P.E., “Microcrystalline Quartz, Undulatory Extinction & The Alkali-Silica Reaction,” Proc. 9th Internat. Conference on Alkali-Aggregate Reaction in Concrete, London 1992, 383-394. [7] Thomson, Margaret, L. & Grattan-Bellew, P.E., “Anatomy of a Porphyroblastic Schist: Alkali-Silica Reactivity,” Eng. Geol. 35, 1993, 81-91.
[8] Wigum, Borge Johannes, “Alkali-Aggregate Reactions in Concrete” Thesis Norges Tekniske Hogskole Trondheim,December 1995, pp. 227. [9] Kerrick, D.M., Hooton, R.D., 1992, “ASR of Concrete Aggregate Quarried from a Fault Zone: Results and Petrographic Interpretation of Accelerated Mortar Bar Test,” Cem. & Concr. Res., 22, 949-960.
Acknowledgements
The authors are indebted to Dr. Tetsuya Katayama for supplying the andesite from Japan, and to Jim Margeson of the Institute for Research in Construction for sample preparation, EDX and XRD analyses.