HAL Id: hal-01194372
https://hal.archives-ouvertes.fr/hal-01194372
Submitted on 13 Nov 2019
HAL is a multi-disciplinary open access
archive for the deposit and dissemination of
sci-entific research documents, whether they are
pub-lished or not. The documents may come from
teaching and research institutions in France or
abroad, or from public or private research centers.
L’archive ouverte pluridisciplinaire HAL, est
destinée au dépôt et à la diffusion de documents
scientifiques de niveau recherche, publiés ou non,
émanant des établissements d’enseignement et de
recherche français ou étrangers, des laboratoires
publics ou privés.
Beyond MSER: Maximally Stable Regions using Tree of
Shapes
Petra Bosilj, Ewa Kijak, Sébastien Lefèvre
To cite this version:
Petra Bosilj, Ewa Kijak, Sébastien Lefèvre. Beyond MSER: Maximally Stable Regions using Tree of
Shapes. British Machine Vision Conference, Sep 2015, Swansea, United Kingdom. �hal-01194372�
Beyond MSER: Maximally Stable Regions
using Tree of Shapes
Petra Bosilj1 [email protected] Ewa Kijak2 [email protected] Sébastien Lefèvre1 [email protected] 1Université de Bretagne-Sud IRISA Vannes, France 2Université de Rennes 1 IRISA Rennes, France Abstract
This article explores the application of a tree-based feature extraction algorithm for the widely-used MSER features, and proposes a Tree of Shapes based detector of Max-imally Stable Regions. Changing an underlying component tree in the algorithm allows considering alternative properties and pixel orderings for extracting the Maximally Sta-ble Regions. Differences introduced to the region structure with changing the underlying tree are discussed, as well as the spatial organization of the detected regions imposed by using a self-dual image representation for detection.
Performance evaluation is carried out on a standard matching benchmark in terms of repeat ability and matching score under different image transformations, as well as in a large scale image retrieval setup, measuring Mean Average Precision. The proposed de-scriptor is compared to the standard MSER implementation as well as a tree-based MSER implementation, achieving competitive results in the matching setup and outperforming the baseline MSER in the retrieval experiments.
1
Introduction
Detection of local features is the base step in many computer vision applications, providing a compact representation of the image by only considering the selected salient points. A good feature detector will provide features which are distinctive, invariant and discriminate.
The development of affine invariant detectors was driven by their robustness against viewpoint change as one of the most common scene transformations between images. Many different detectors were developed; detectors such as SIFT (DoG) [21], SURF [5], Hessian and Harris-Affine [23] and KAZE [1] operate in scale space to achieve multiscale image processing. A recent MFD detector [3] is also based on image gradient, but without explicit scale space construction. Others, like BPLR [19] and WαSH [38] rely on edges and bound-aries, while MSER [22] detects features on multiple scales based on image contrast and region intensity. These detectors are often complementary (and can be used in combination), providing features responding to corners, ridges or blobs (contrasted regions).
We focus here on the Maximally Stable Extremal Regions (MSER), a fast detector based on image intensity, responding to blobs of high contrast and producing affine invariant,
c
2015. The copyright of this document resides with its authors. It may be distributed unchanged freely in print or electronic forms.
highly featured regions of arbitrary shapes. Performance benchmarking done both by Miko-lajczyk et al. [24] as well as Fraundorfer and Bischof [13] has identified the MSER detector as one of the best local region detectors due to its robustness against viewpoint, rotation, scale and lighting changes. As such, it has been used in applications ranging from object recognition [29], image retrieval [27], recognition and matching [12], tracking [10], to re-cent use in text detection [9,15]. Extensions for color [12] and for better robustness against blur [11] were also proposed in the literature.
Based on the hierarchical ordering of the MSER detections shown in [10], an algorithm using the Min and Max-tree hierarchies [18,34] to determine MSER regions was introduced by Nistér and Stewénius [28]. Extending the idea put forward in [8], the algorithm [28] can be applied to any component tree exhibiting invariant properties.
This paper proposes detecting Maximally Stable Regions on the Tree of Shapes [25,37]. With a small but consistent increase in the number of responses mitigating the drawback of the MSER detector due to a sometimes small number of features, the detector is still suited for image retrieval applications. The performance of the proposed descriptor is evaluated using the image matching framework of Mikolajczyk et al. [24], as well as in a retrieval setup using VLAD [17] indexing.
Next section summarizes the contributions of the paper in relation to the current litera-ture. Following, in Sec.3we recall the MSER regions, Min and Max-trees and how they are used for feature detection. Section4introduces the Tree of Shapes and explains its use in the tree-based MSER detection algorithm. The evaluation of the newly constructed detector follows in Sec.5, and Sec.6concludes the paper.
2
Contributions and related work
While the MSER regions are based on strict intensity ordering of the pixels, Maximally Stable Regions could be detected in a similar manner using a different ordering and thus producing features with different stability properties [22]. We propose a new feature detector, constructed by replacing the Max and Min-trees with the Tree of Shapes [25,37] in the MSER construction algorithm [28], effectively replacing the intensity ordering on the pixels. Additional information the MSER detector provides could prove an added advantage of this detector in image retrieval, however it is not commonly integrated and exploited in the state-of-the-art the retrieval schemes. Firstly, the arbitrary shape of these regions allows constructing feature descriptors including shape information [6,11] (as opposed to using only the prevalent SIFT [21] descriptor). Secondly, the MSER detector organizes its responses into (two) nested hierarchies [10]. This allows for the possibility of constructing an indexing scheme utilizing the provided spatial relations between the salient regions of the image in addition to region descriptors, improving on state-of-the-art approximate search schemes [17,20,35] which include no spatial information.
In addition to organizing the detections in a single hierarchy due to the self-dual prop-erty of the tree, using the Tree of Shapes instead of the Min and Max-tree lessens one of the main drawbacks of MSER detector. While a small number of responses has limited the use of MSER in applications requiring a higher number of matches (e.g. mosaicking, 3D modeling, registration), the number of MSER responses is occasionally too small even for the applications where it is important to limit the number of responses (e.g. image retrieval) as the vocabulary size and consequently indexing and search speed will depend on the num-ber of descriptors provided. We show that the proposed detector produces only 20%–40%
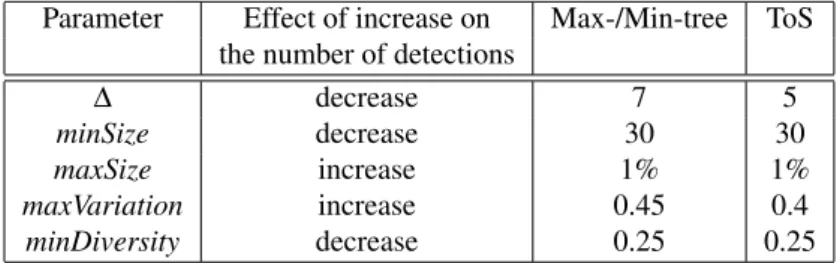
Table 1: MSER parameters values for both detectors and their effect on the number of de-tections.
Parameter Effect of increase on Max-/Min-tree ToS the number of detections
∆ decrease 7 5
minSize decrease 30 30
maxSize increase 1% 1%
maxVariation increase 0.45 0.4
minDiversity decrease 0.25 0.25
more responses. This small but consistent increase results in performance improvement over MSER, without the severe effect on the retrieval speed resulting from using more heavily featured detectors (such as e.g. Hessian-Affine [23]).
Another detector, based on the MSER algorithm, but only relying on the topological in-formation in the tree, was presented in [41]. The number of responses is greatly increased (up to a 6-fold increase compared to MSER), with competitive repeatability scores in the Mikolajczyk et al. [24] framework. These properties make it well suited for the target ap-plications of 3D reconstruction and image registration, however make it unfeasible to use in image retrieval application.
3
Background – tree-based MSER detection
3.1
MSER regions
The MSER detector was first introduced by Matas et al. [22], using a union-find based ap-proach. The detector selects the salient regions among the extremal regions of an image I, defined by the extremal property of the image intensity function f on the region outer boundary. Among these regions, minimal (resp. maximal) extremal regions are such con-nected regions R of the image that all the elements on the outer boundary have strictly greater (resp. smaller) intensity than all the adjacent region elements.
We denote by Rka minimal extremal region with the maximal intensity level k of all the
elements in the region. Similarly, Rkdenotes a maximal extremal region of minimal intensity level k among the region elements. Minimal extremal regions are nested for increasing k, i.e. Rk⊆ Rlfor any k < l, and similar relation holds true for maximal extremal regions [10].
A function q(·), calculated for the elements of a nested sequence, indicates the rate of growth of a region with the change of intensity. The minimal extremal regions Rkwhere this
function reaches a local minimum are labeled maximally stable (minimal) extremal regions, and similarly for the local minima of the stability function q(·) on the nested sequences of maximal extremal regions. In order to speed up the computation as well as resolve cer-tain ambiguities from the original definition, implementations in popular computer vision libraries (e.g VLFeat [39]), as well as our implementation, use a simplified versions of the stability function:
q0(Rk) =
|Rk+∆\Rk|
|Rk| . (1)
3 3 3 3 3 3 3 3 2 2 2 3 0 3 3 2 1 2 3 0 3 3 2 2 2 3 0 3 3 2 4 2 3 3 3 3 2 2 2 3 3 3 3 3 3 3 3 3 3 (a) (b) (c) (d)
Figure 1: The original image is displayed in subfigure(a). Subfigures (b) and(c)show the corresponding Min-tree and Max-tree, respectively. The Tree of Shapes is displayed in subfigure(d).
parameter requires the region to be stable through a greater range of gray levels. The region Rk+∆is determined from the sequence of nested regions to be the largest region such that:
d(Rk, Rk+∆) ≤∆. (2)
The distance between the regions d(·) is defined hereafter depending on the region type. Additional parameters to control the size of the detected regions, limit the maximal al-lowed value of the stability function as well as restrict the detections to only sufficiently different nested regions are also introduced to the detection method. The list of these param-eters as well as their effect on the number of detections can be found in Table1.
3.2
Min and Max-trees
Min and Max-tree image representations were first introduced by Salembier et al. [34] and Jones [18]. These and other component trees originating from Mathematical Morphology encode the composition of complex images by proposing unions of simpler image regions most likely to compose objects [40] on different scales. Regions at the same scale are in horizontal relationswithin the hierarchy, while vertical relations denote nesting between regions at different scales.
Both Min and Max-tree are complete image representations, allowing for full image reconstruction. However, the Min-tree of the image I models the composition of the image using only the dark image structures, while the dual hierarchy, the Max-tree (corresponding to the Min-tree of the inverted image −I) has to be used for handling bright objects. As such, even though both representations are complete, they are usually used as a pair of dual representations causing redundancy.
The leaves of the Min-tree correspond to local image minima, while the inner nodes are connected regions R of the image at different gray levels k with the following property: ∀p ∈ R, f (p) ≤ k. These regions for the gray level k correspond to minimal extremal regions Rk, and are shown on Fig.1(b)for the image displayed in Fig.1(a).
A minimal extremal region Rkwill make a new node at the level k of the tree. This node
can either become:
• a leaf node if it does not include the regions of any previously constructed nodes (it is a local minimum),
• a parent node to all the previously constructed nodes at lower levels, which are nested in the region of the new node: Rk0⊂ Rk, k0< k.
Finally, the region Rmaxat the highest gray level present in the image has only one connected
component covering the whole image domain. This region becomes the root of the tree, unifying all the branches. The distance between two nodes in an ancestral relation, Rkand
Rl, with k < l, is calculated as their gray level difference d(Rk, Rl) = |l − k|. This distance
is then used to determine the corresponding region Rk+∆from Eq. (1), when the Min and Max-trees are used for MSER detection.
The Min-tree construction algorithm proposed in [28] adopts the bottom up approach, which allows direct computation of the MSER stability function according to Eq. (1) during the tree construction. Selecting the regions, as well as enforcing other restrictions from Table1is done by filtering, and the resulting selected regions retain the hierarchical structure in the filtered tree. Selecting regions from the Min-tree results in detecting the minimal MSERs, while the Max-tree has to be used for maximal MSER detection.
4
Maximally Stable Regions on Tree of Shapes
4.1
Tree of Shapes
Unlike the Min and Max-trees which only model the dark or the bright image structures, the Tree of Shapes (ToS) [25,37] encodes the image composition in terms of objects and shapes, based on their contrast with their background. The bright and dark structures in the image are treated equivalently. Because of this, it can better model non-homogeneous objects as well as certain textures. The resulting tree is a complete, non-redundant, contrast invariant and self-dual representation of the image. The self-dual property of this tree signifies that the ToS of an image I and inverted image −I are the same.
The leaves of this tree correspond to all the local extrema of the image. Nodes of the tree correspond to shapes – connected regions acquired by filling the holes on all the extremal regions present in the Max-tree and the Min-tree [25]. This definition ensures that shapes do not intersect, but instead either contain one another or are disjoint (cf. [4,37] for the proof of this property). After filling the holes on all the maximal and minimal extremal regions of the image in Fig.1(a), there are only 5 distinct shapes remaining. The tree formed as a hierarchy of these shapes is displayed in Fig.1(d).
A node corresponding to a shape R is the direct parent of the node corresponding to the shape Q if R is the smallest shape containing Q. The leaves of the tree correspond to local image extrema as there are no smaller shapes contained in the extrema regions. While constructing the region R corresponding to an inner node, it can be observed that it is composed of the image elements of all of its children and some additional image elements. These additional elements are always on the same gray level k. Let child(R) be the set of all the c children of R, then:
∀p, q ∈ R, p, q 6∈ child(R), 0 ≤ i ≤ c =⇒ f (p) = f (q) = k (3) Thus, the node whose all additional elements are on the level k according to Eq. (3) will be referred to as Rk.
We define the distance between the regions of the ToS based on the pair-wise difference between neighboring node levels. The distance between any two regions Rk⊆ Rl amounts
(a) (b)
Figure 2: Detections using the tree-based MSER implementation are shown in(a), and the ToS-MSR output is shown in(b). The outputs of both detectors are calculated for the first image of the ’bikes’ dataset from the Mikolajczyk et al. [24] framework.
to the sum of consecutive distances of all the nested regions on a path Rk⊆ Rk0 ⊆ · · · ⊆ Rkx⊆ Rland is equal to:
d(Rk, Rl) = |k − k0| + |k0− k1| + · · · + |kx− l|. (4)
.
4.2
Detector construction
In order to obtain a competitive tree-based detector by applying the algorithm from [28] on a different component tree, two different conditions must be met. First, the construction com-plexity of the chosen tree must be low enough to ensure acceptable detector speed. Second, a distance between any two nodes in a nested region sequence in the tree needs to be defined. A simple attempt in constructing a ToS based detector similar to MSER was put forward in [8]. However, it was never deeply explored as there were no efficient state-of-the-art construction algorithms for ToS. Also, the proposed stability function was only based on the direct parent in a nested sequence, and thus it was not possible to parametrize the desired stability well. However, the near-linear construction algorithm proposed recently by Géraud et al. [14], together with the pair-wise distance in Eq. (4) between the nodes of the ToS, make substituting the Min and Max-trees in [28] with the ToS a viable option.
The resulting detector, the Tree of Shapes based Maximally Stable Regions (ToS-MSR) responds to similar regions as the original MSER detector but provides more features. The regions are still of arbitrary shape, but no longer have holes present. While this still allows exploiting shape information in region descriptors, it also benefits the results when affine construction methods are used to transform the detected, distinguished regions into mea-surement regions. A common approach of fitting an ellipse based on the second order region moments will result in better centralized ellipse region used as the descriptor input due to the lack of holes in the regions. It only uses the one, self-dual, tree to determine the salient regions and thus also provides spatial relations between all the regions as a single hierarchy. The regions detected by the tree-based MSER implementation and the ToS-MSR detector are displayed in Fig.2.
5
Results
We use two different experimental setups to evaluate the proposed ToS-MSR detector. In the framework proposed by Mikolajczyk et al. [24], we measure the repeatability and matching scoreof the detector on the dataset provided with the framework. The second setup measures the Mean Average Precision (MAP) of large-scale retrieval system using VLAD indexing [17]. The ’paris6k’ [31] dataset is used as the training set, while the INRIA ’holidays’ [16] and ’oxford5k’ [30] datasets are used for evaluation. All four of the used datasets are public and widely used, with matching and retrieval results available.
In both experiments, we compare our detector to the MSER detector, using the corre-sponding executable provided for [24]. As some of the method parameters are hidden in the provided implementation, we also use our tree-based implementation of MSER for com-parison. The parameters of both tree-based detectors were set up so that their repeatability and matching score would closely follow that of the provided MSER implementation on the datasets with viewpoint changes provided with [24]. This was done as viewpoint changes are among the most common image transformations, and using a different dataset to tune the parameters would likely produce slightly different results. The average performance on the viewpoint datasets is shown in Fig.3(a), while the final parameter choice can be found in Table1.
5.1
Region matching
The framework of Mikolajczyk et al. [24] investigates the impact of using different detectors on the performance of matching application when different types of changes are introduced to the dataset. The scenes are divided into structured and textured, and the image transfor-mations examined are the change in viewpoint, rotation and zoom, blur, illumination and lossy compression. While the repeatability measure provides a theoretical upper limit of the performance regardless of the descriptor, the matching scores are obtained using the 128-dimensional SIFT [21] descriptor (implementation provided with the datasets).
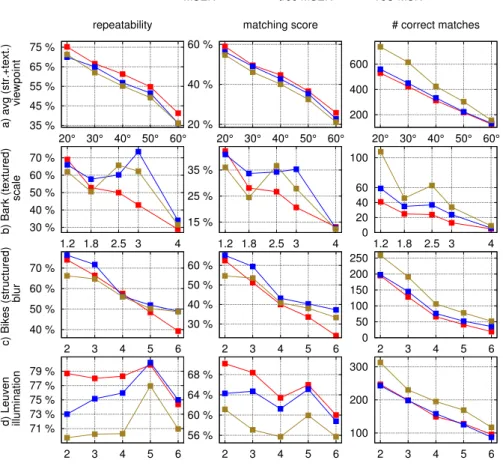
The results for selected datasets are shown in Fig.3. The first row (Fig.3(a)) corre-sponds to the average performance on the viewpoint changes dataset (’graffiti’ and ’wall’), used to determine the parameters of the detectors. The second row (Fig.3(b)) shows an ex-ample of ToS-MSR outperforming the provided MSER implementation, for scale changes on a textured dataset. The third row (Fig.3(c)) corresponds to a typical situation across most datasets, where all three detectors report a similar repeatability and matching score, shown on the structured scene dataset with blur. Detector responses shown in Fig.2correspond to images of this dataset. The fourth row (Fig.3(d)) shows the dataset with the poorest perfor-mance of ToS-MSR. However, the maximal decrease is no more than 10% in repeatability and matching scores with respect to MSER. It is important to note that the ToS-MSR still outperforms other detectors examined in [24] for this dataset.
Additionally, it is visible that the number of (correctly matched) features is consistently higher for ToS-MSR detector. This is especially important on difficult image transformations where an extremely low number of MSER correspondences becomes a limiting factor (as in Fig.3(b)–(d)).
35 % 45 % 55 % 65 % 75 % 20° 30° 40° 50° 60° a) avg (str.+text.) viewpoint repeatability
MSER tree MSER ToS-MSR
20 % 40 % 60 % 20° 30° 40° 50° 60° matching score 200 400 600 20° 30° 40° 50° 60° # correct matches 30 % 40 % 50 % 60 % 70 % 1.2 1.8 2.5 3 4 b) Bark (textured) scale 15 % 25 % 35 % 1.2 1.8 2.5 3 4 0 20 40 60 100 1.2 1.8 2.5 3 4 40 % 50 % 60 % 70 % 2 3 4 5 6 c) Bikes (structured) blur 30 % 40 % 50 % 60 % 2 3 4 5 6 0 50 100 150 200 250 2 3 4 5 6 71 % 73 % 75 % 77 % 79 % 2 3 4 5 6 d) Leuven illumination 56 % 60 % 64 % 68 % 2 3 4 5 6 100 200 300 2 3 4 5 6
Figure 3: Repeatability, matching score and number of correct matches for select represen-tative datasets of the Mikolajczyk et al. [24] framework (the labels on the x-axis correspond to severity of the transformation present in the particular dataset). Datasets in shown (b)–(d) are the ones with the lowest number of MSER detections in the framework (i.e. where the increase in the number of correspondences is the most valuable
5.2
Image retrieval
For the second experiment, we compare the detector performance in an image retrieval setup. RootSIFT [2] descriptors are calculated for the detected regions, and the VLAD indexing scheme [17] is then used to obtain global image descriptors. Before feature detection and description, we have resized the images from all datasets to a maximum of 786432 pixels and performed a slight intensity normalization, similarly to [16]. The vocabulary is created based on the ’paris6k’ dataset, containing 6392 images of Paris landmarks [31].
Evaluating the performance was done on two different datasets: the INRIA ’holidays’ [16] and ’oxford5k’ [30]. The ’holidays’ dataset contains a total of 1491 images, sorted in 500 different groups, and includes a variety of scene types. The ’oxford5k’ comprises 5062 images of Oxford landmarks as well as distractor images.
detector
’holidays’ ’oxford5k’ features MAP features MAP
mean high mean high
MSER 914.78 0.434 0.451 874.02 0.227 0.252 tree MSER 1000.57 0.419 0.431 931.08 0.222 0.232 ToS-MSR 1295.85 0.451 0.462 1160.98 0.239 0.250
Table 2: Results of the image retrieval experiments, using ’paris6k’ for vocabulary training for the VLAD indexing, and ’holidays’ and ’oxford5k’ for validation. Mean and best MAP values over 8 experiments with randomly reinitialized vocabulary.
8 repetitions of the experiment (reinitializing the vocabulary every time) and is shown in Table2. The proposed detector outperforms both versions of MSER, with a small but con-sistent increase in the number of features (when compared to detectors with many responses, e.g. Hessian-Affine which produce up to 4 times more detections than MSER). The increase is present in all three datasets used (’holidays’ not shown), ranging from 20–30% compared to tree-based MSER implementation and 30–40% when compared to the provided imple-mentation. A lower performance on the ’oxford5k’ dataset as compared to ’holidays’ is most likely due to the increased dataset size as well as the distractor images present.
6
Conclusion and discussion
In this paper we demonstrate successfully changing an underlying tree in the MSER detec-tion algorithm to produce Maximally Stable Regions (MSR) based on pixel ordering different than intensity. The proposed ToS-MSR detector reports similar repeatability and matching scores (within 5% difference on 7 out of 8 considered dataset with the exception shown in Fig.3(d)) in the matching framework focusing against robustness against image transforma-tions. Moreover, we also apply the detector to the context of image retrieval, and outperform the MSER detector in a large scale retrieval experiment in terms of Mean Average Precision, using two datasets representing a variety of scenes. As part of future work, testing against other state-of-the-art detectors (as well as performance in combination with complementary detectors) is planned.
Using a ToS as the underlying tree changes the properties of the detected features ac-cording to the tree properties and results in features without holes but still of arbitrary shape (inducing better positioning of the measurement regions as inputs to descriptor methods). It also organizes the detected regions in a single hierarchy, encoding spatial relations between the features. Analyzing general tree characteristics (i.e. number of nodes, distribution of their sizes, distribution of nodes through tree levels) as part of the future work could prove use-ful in determining the optimal parameter choices allowing for good-quality regions without overly restricting the number of responses.
A modest increase in the number of detections (between 20 and 40%) helps with the drawback of the sometimes too-sparse MSER detector, while staying low enough as to not significantly effect indexing and search speed in retrieval. Recent advances in the ToS con-struction algorithms (as well as the detector using a single tree instead of two) allow for competitive detector speed as well. Combinations with other known MSER improvements [11,12] could also be considered.
Furthermore, this work as well as work of [41] opens up the possibility of investigat-ing other component trees from Mathematical Morphology (e.g. [26,32, 36]) for feature detection in retrieval and other applications. The alternative properties of regions based on different trees could prove well suited for a particular type of scene or application. Addi-tional flexibility in modifying the pixel ordering in the MSR detector could be achieved by filtering the basic component trees (cf. e.g. [33]) or changing the hierarchy inherent distance by imposing different levels to the tree regions, based on an attribute of choice [7].
Acknowledgments
The authors would like to thank Giorgos Tolias for the input and help in performing the retrieval experiments.
References
[1] Pablo Fernández Alcantarilla, Adrien Bartoli, and Andrew J Davison. Kaze features. In Computer Vision–ECCV 2012, pages 214–227. Springer, 2012.
[2] R. Arandjelovi´c and A. Zisserman. Three things everyone should know to improve object retrieval. In Computer Vision and Pattern Recognition (CVPR), 2012 IEEE Con-ference on, pages 2911–2918. IEEE, 2012.
[3] Yannis Avrithis and Konstantinos Rapantzikos. The medial feature detector: Stable regions from image boundaries. In Computer Vision (ICCV), 2011 IEEE International Conference on, pages 1724–1731. IEEE, 2011.
[4] C. Ballester, V. Caselles, and P. Monasse. The tree of shapes of an image. ESAIM: Control, Optimisation and Calculus of Variations, 9:1–18, 2003.
[5] H. Bay, A. Ess, T. Tuytelaars, and L. Van Gool. Speeded-up robust features (SURF). Computer Vision and Image Understanding, 110(3):346–359, 2008.
[6] P. Bosilj, M. H. F. Wilkinson, E. Kijak, and S. Lefèvre. Local connected 2D pat-tern spectra descriptors applied to CBIR systems. To appear in the Inpat-ternational Sym-posyum in Mathematical Morphology, 2015.
[7] P. Bosilj, S. Lefèvre, and E. Kijak. Hierarchical image representation simplification driven by region complexity. In Image Analysis and Processing–ICIAP 2013, pages 562–571. Springer, 2013.
[8] V. Caselles and P. Monasse. Geometric description of images as topographic maps. Springer Publishing Company, Incorporated, 2009.
[9] H. Chen, S. S. Tsai, G. Schroth, D. M. Chen, R. Grzeszczuk, and B Girod. Robust text detection in natural images with edge-enhanced maximally stable extremal regions. In Image Processing (ICIP), 2011 18th IEEE International Conference on, pages 2609– 2612. IEEE, 2011.
[10] M. Donoser and H. Bischof. Efficient maximally stable extremal region (mser) track-ing. In Computer Vision and Pattern Recognition, 2006 IEEE Computer Society Con-ference on, volume 1, pages 553–560. IEEE, 2006.
[11] P-E Forssen and David G Lowe. Shape descriptors for maximally stable extremal regions. In Computer Vision, 2007. ICCV 2007. IEEE 11th International Conference on, pages 1–8. IEEE, 2007.
[12] P.E. Forssén. Maximally stable colour regions for recognition and matching. In Com-puter Vision and Pattern Recognition, 2007. CVPR’07. IEEE Conference on, pages 1–8. IEEE, 2007.
[13] F. Fraundorfer and H. Bischof. A novel performance evaluation method of local de-tectors on non-planar scenes. In Computer Vision and Pattern Recognition-Workshops, 2005. CVPR Workshops. IEEE Computer Society Conference on, pages 33–33. IEEE, 2005.
[14] T. Géraud, E. Carlinet, S. Crozet, and L. Najman. A Quasi-linear Algorithm to Com-pute the Tree of Shapes of nD Images. In Mathematical Morphology and Its Applica-tions to Signal and Image Processing, pages 98–110. Springer, 2013.
[15] K. Iqbal, X-C. Yin, X. Yin, H. Ali, and H-W. Hao. Classifier comparison for mser-based text classification in scene images. In Neural Networks (IJCNN), The 2013 In-ternational Joint Conference on, pages 1–6. IEEE, 2013.
[16] H. Jégou, M. Douze, and C. Schmid. Hamming embedding and weak geometric con-sistency for large scale image search. In Andrew Zisserman David Forsyth, Philip Torr, editor, European Conference on Computer Vision, volume I of LNCS, pages 304–317. Springer, oct 2008.
[17] H. Jégou, M. Douze, C. Schmid, and P. Pérez. Aggregating local descriptors into a compact image representation. In Computer Vision and Pattern Recognition (CVPR), 2010 IEEE Conference on, pages 3304–3311. IEEE, 2010.
[18] R. Jones. Component trees for image filtering and segmentation. In Proc. IEEE Work-shop on Nonlinear Signal and Image Process., 1997.
[19] J. Kim and K. Grauman. Boundary preserving dense local regions. In Computer Vision and Pattern Recognition (CVPR), 2011 IEEE Conference on, pages 1553–1560. IEEE, 2011.
[20] H. Lejsek, B. Þ. Jónsson, and L. Amsaleg. NV-Tree: Nearest Neighbors at the Bil-lion Scale. In Proceedings of the 1st ACM International Conference on Multimedia Retrieval, ICMR ’11, pages 54:1–54:8, 2011.
[21] D. G. Lowe. Distinctive image features from scale-invariant keypoints. International journal of computer vision, 60(2):91–110, 2004.
[22] J. Matas, O. Chum, M. Urban, and T. Pajdla. Robust wide-baseline stereo from max-imally stable extremal regions. Proc. Of British Machine Vision Conference (BMVC 2002), pages 384–396, 2002.
[23] K. Mikolajczyk and C. Schmid. An affine invariant interest point detector. In Computer Vision–ECCV 2002, pages 128–142. Springer, 2002.
[24] K. Mikolajczyk, T. Tuytelaars, C. Schmid, A. Zisserman, J. Matas, F. Schaffalitzky, T. Kadir, and L. Van Gool. A comparison of affine region detectors. International Journal of Computer Vision, 65(1-2):43–72, 2005.
[25] P. Monasse and F. Guichard. Scale-space from a level lines tree. Journal of Visual Communication and Image Representation, 11(2):224–236, 2000.
[26] L. Najman, J. Cousty, and B. Perret. Playing with Kruskal: Algorithms for Morphologi-cal Trees in Edge-Weighted Graphs. In MathematiMorphologi-cal Morphology and Its Applications to Signal and Image Processing, pages 135–146. Springer, 2013.
[27] D. Nistér and H. Stewénius. Scalable Recognition with a Vocabulary Tree. In Com-puter Vision and Pattern Recognition, 2006 IEEE ComCom-puter Society Conference on, volume 2, pages 2161–2168. IEEE, 2006.
[28] D. Nistér and H. Stewénius. Linear time maximally stable extremal regions. In Com-puter Vision–ECCV 2008, pages 183–196. Springer, 2008.
[29] Š. Obdržálek and J. Matas. Object recognition using local affine frames on maximally stable extremal regions. In Toward Category-Level Object Recognition, pages 83–104. Springer, 2006.
[30] J. Philbin, O. Chum, M. Isard, J. Sivic, and A. Zisserman. Object retrieval with large vocabularies and fast spatial matching. In Computer Vision and Pattern Recognition, 2007. CVPR’07. IEEE Conference on, pages 1–8. IEEE, 2007.
[31] J. Philbin, O. Chum, M. Isard, J. Sivic, and A. Zisserman. Lost in quantization: Im-proving particular object retrieval in large scale image databases. In Proceedings of the IEEE Conference on Computer Vision and Pattern Recognition, 2008.
[32] P. Salembier and L. Garrido. Binary Partition Tree as an Efficient Representation for Image Processing, Segmentation, and Information Retrieval. IEEE Transactions on Image Processing, 9(4):561–576, 2000.
[33] P. Salembier and M. H. F. Wilkinson. Connected Operators. IEEE Signal Processing Magazine, 26(6):136–157, 2009.
[34] P. Salembier, A. Oliveras, and L. Garrido. Antiextensive connected operators for image and sequence processing. Image Processing, IEEE Transactions on, 7(4):555–570, 1998.
[35] J. Sivic and A. Zisserman. Video Google: Efficient visual search of videos. In J. Ponce, M. Hebert, C. Schmid, and A. Zisserman, editors, Toward Category-Level Object Recognition, volume 4170 of LNCS, pages 127–144. Springer, 2006.
[36] P. Soille. On genuine connectivity relations based on logical predicates. In Image Analysis and Processing, 2007. ICIAP 2007. 14th International Conference on, pages 487–492. IEEE, 2007.
[37] Y. Song and A. Zhang. Monotonic tree. In Discrete Geometry for Computer Imagery, pages 114–123. Springer, 2002.
[38] C. Varytimidis, K. Rapantzikos, and Y. Avrithis. WαSH: Weighted α-Shapes for Local Feature Detection. In Proceedings of European Conference on Computer Vision (ECCV 2012), Florence, Italy, October 2012.
[39] A. Vedaldi and B. Fulkerson. VLFeat: An Open and Portable Library of Computer Vision Algorithms.http://www.vlfeat.org/, 2008.
[40] V. Vilaplana, F. Marques, and P. Salembier. Binary Partition Trees for Object Detection. Image Processing, IEEE Transactions on, 17(11):2201–2216, 2008.
[41] Yongchao Xu, Pascal Monasse, Thierry Géraud, and Laurent Najman. Tree-based morse regions: A topological approach to local feature detection. Image Processing, IEEE Transactions on, 23(12):5612–5625, 2014.