HAL Id: hal-01991299
https://hal.archives-ouvertes.fr/hal-01991299
Submitted on 20 Feb 2020HAL is a multi-disciplinary open access archive for the deposit and dissemination of sci-entific research documents, whether they are pub-lished or not. The documents may come from teaching and research institutions in France or abroad, or from public or private research centers.
L’archive ouverte pluridisciplinaire HAL, est destinée au dépôt et à la diffusion de documents scientifiques de niveau recherche, publiés ou non, émanant des établissements d’enseignement et de recherche français ou étrangers, des laboratoires publics ou privés.
A revisit of the role of gas entrapment on the stability
conditions of explosive volcanic columns
Audrey Michaud-Dubuy, Guillaume Carazzo, Edouard Kaminski, Frédéric
Girault
To cite this version:
Audrey Michaud-Dubuy, Guillaume Carazzo, Edouard Kaminski, Frédéric Girault. A revisit of the role of gas entrapment on the stability conditions of explosive volcanic columns. Journal of Volcanology and Geothermal Research, Elsevier, 2018, 357, pp.349-361. �10.1016/j.jvolgeores.2018.05.005�. �hal-01991299�
A revisit of the role of gas entrapment on the stability conditions of
explosive volcanic columns
Audrey Michaud-Dubuy*, Guillaume Carazzo, Edouard Kaminski, Frédéric Girault
Institut de Physique du Globe de Paris, Sorbonne Paris Cité, Université Paris Diderot, CNRS, 1 rue Jussieu, F-75005 Paris, France
*Corresponding author: Audrey Michaud-Dubuy, michauddubuy@ipgp.fr
Highlights
• We study the collapse conditions using a 1D model with grain-size distribution (GSD). • Combined effects of gas entrapment and variable entrainment favor column collapse. • This drastic effect is reduced when accounting for open porosity in the model.
• We predict GSD in pyroclastic flows as a function of GSD and MDR at the vent. • We test the model against the historical 186 CE Taupo and 79 CE Vesuvius eruptions.
Keywords
Plinian eruptions, particle sedimentation, grain-size distribution, fragmentation, open porosity, pyroclastic density currents.
Abstract
Explosive volcanic eruptions produce high-velocity turbulent jets that can form either a stable buoyant Plinian column or a collapsing fountain producing pyroclastic density currents (PDC). Determining the source conditions leading to these extreme regimes is a major goal in
physical volcanology. Classically, the regime boundary is defined as the critical eruptive mass discharge rate (MDR) before collapse for a given amount of free gas in the eruptive mixture (free gas + pyroclasts) at the vent. Previous studies have shown that an agreement between theory and field data can be achieved in two different frameworks: (i) by accounting for the effect of gas entrapment in large pumice fragments, which lowers the effective gas content, depending on the total grain-size distribution (TGSD) of pyroclastic fragments, or (ii) by accounting for the reduction of turbulent entrainment at the base of the volcanic column due to its negative buoyancy. Here, we aim at combining these two using a 1D model of volcanic column that includes sedimentation to follow the evolution of the TGSD. In powerful (≥ 107
kg s-1) Plinian eruptions, the loss of particles by sedimentation acts as to decrease the load of
particles during the plume rise, which favors the formation of a stable column. In this case, we obtain that coarse TGSD promote the formation of stable plumes, a result at odds with the predictions of models considering gas entrapment in large pyroclastic fragments. To interpret this conclusion, we reconsider the effect of gas entrapment and show that in general, it has a dominant role on column collapse compared to particle sedimentation, and hinders the formation of buoyant columns. This drastic effect is reduced when incorporating open porosity, e.g. by considering that some bubbles inside a fragment are connected to the exterior. The characteristics of the PDC produced by column collapse are then predicted as a function of the TGSD and MDR at the source. We further test the model using two well-documented historical events, the ≈186 CE Taupo and 79 CE Vesuvius eruptions. Our model predictions are consistent with the Taupo eruption record, but not with the Vesuvius one. In this latter case, we suggest that the characteristics of the TGSD imply to take into account the thermal disequilibrium between gas and pyroclasts.
1. Introduction
Explosive volcanic eruptions stand as one of the most powerful and dangerous natural phenomena on Earth. During these extreme events, the magma ascending from depth is fragmented in the conduit and expelled at the vent as a dense turbulent mixture of hot gas and pyroclasts. The mass discharge rate of these high-velocity turbulent jets usually ranges between 106 and 109 kg s-1 (Carey and Sigurdsson, 1989). Depending on its mass discharge
rate, a volcanic jet can follow remarkably different dynamical evolutions during its rise in the atmosphere. In the buoyant regime (also called "Plinian" regime), the volcanic mixture forms a vertical column that rises up to tens of kilometers before spreading out laterally to form an horizontal umbrella cloud (Sparks, 1986). In the fountain regime (or "collapse" regime), the turbulent jet collapses to the ground and produces pyroclastic density currents (PDC) rushing down the volcano flanks. When eruption conditions are close to those of column collapse, the regime is transitional: an unstable buoyant column still rises to high altitudes but occasionally generates PDC. The two eruptive regimes, which can occur one after another and even alternate during the same eruption, mainly determine the associated hazards. Whereas a rain of ash and pumices produced during the Plinian regime may cause infrastructure damages (e.g., Wilson et al., 2014), major perturbations of air traffic (e.g., Miller andCasadevall, 2000; Schmidt et al., 2014) and breathing difficulties (e.g., Horwell and Baxter, 2006; Horwell, 2007; Horwell et al., 2013), PDC most commonly lead to massive human and material losses (e.g., Spence et al., 2004;Wilson et al., 2014). The prediction of column behavior is therefore fundamental to assess the impact of explosive volcanic eruptions. The understanding and prediction of the source (and environmental) conditions leading to either a buoyant plume or a collapsing fountain remains a major goal in physical volcanology.
The dual behavior described above rises from the evolution of the volcanic column bulk density during its ascent in the atmosphere. At the vent, the hot mixture of gas and pyroclasts has a bulk density greater than the ambient air, and its initial momentum drives the plume ascent. Thereafter, owing to turbulent mixing, cold atmospheric air is entrained into the flow and heated by the hot pyroclasts, leading to a rapid expansion of the gas and an associated decrease of the bulk density of the jet (Sparks and Wilson, 1976; Woods, 1988; 1995). In the meantime, the jet momentum decreases with altitude due to its negative buoyancy. A stable Plinian column forms when the bulk density of the volcanic mixture becomes lower than that of the atmospheric air before complete exhaustion of its initial momentum. Then, the volcanic plume rises by natural convection until it reaches a neutral buoyancy level and spreads out laterally. In the fountain regime, the jet consumes its initial momentum before becoming buoyant and thus collapses to the ground producing PDC.
Since the 1970’s, various methods have been used to study the stability of volcanic columns produced by explosive eruptions (or equivalently the conditions leading to PDC production). A first generation of theoretical models were developed based on a simplified 1D approach (Wilson, 1976; Sparks, 1986; Woods, 1988) stemming from the widely used "top-hat" formalism of Morton et al. (1956). These models rely on the “dusty-gas” hypothesis where particles are considered small enough to remain in thermal and mechanical equilibrium with the gas. In that case, the volcanic mixture can be represented as a single “equivalent” gaseous phase. This convenient formalism has been used to quantitatively study the relationship between the maximum height of the plume and the source mass discharge rate (Settle, 1978; Wilson et al., 1980; Carey and Sigurdsson, 1989) and to determine the conditions leading to column collapse.
Wilson et al. (1980) showed that the mass fraction of free gas in the eruptive mixture at the vent (gas + pyroclastic fragments) and mass discharge rate (MDR) strongly control the
transition between the stable Plinian plume and the collapsing fountain regimes, a conclusion later confirmed by laboratory experiments (Woods and Caulfield, 1992). Other effects have been considered in order to determine quantitatively this regime boundary. Woods and Bursik (1991) demonstrated that particle sedimentation has a minor effect on the column dynamics, but thermal disequilibrium significantly changes the column behavior and can induce a column collapse. Woods and Bower (1995) and Koyaguchi et al. (2010) calculated the conditions for which jet decompression in a crater can yield subsonic velocities and column collapse. Degruyter and Bonadonna (2013) showed that high velocity atmospheric winds can significantly increase the amount of air engulfed in the volcanic column hence making it more stable.
More sophisticated 2D axisymetric and 3D models, based on the time-dependent solution of the Navier-Stokes and energy conservation equations, have been developed to describe the fluid dynamics of the eruptive mixture and the surrounding atmosphere (Valentine and Wohletz, 1989; Neri and Dobran, 1994; Suzuki et al., 2005; Esposti Ongaro et al., 2008). These models improved our understanding of the dynamics of explosive volcanic columns by exploring ranges of parameters that are beyond the limitations imposed by 1D models. However, a recent intercomparison exercise revealed that the results of 2D and 3D models diverge in some of their predictions depending on the assumptions made to solve the governing equations (Costa et al., 2016a). On the other hand, 1D models predictions show similarities with those of 3D models, suggesting that 1D models can be used to adequately describe the general behavior of volcanic columns.
Among the different studies on the stability of volcanic plumes, two - Kaminski and Jaupart (2001) and Carazzo et al. (2008a) - have compared the model predictions of collapse with field constraints in a systematic way, and have shown that previous models tended to significantly favor the buoyant regime in comparison to the natural cases. Kaminski and
Jaupart (1998; 2001) demonstrated that gas entrapment in large pumice during the fragmentation process significantly reduces the effective amount of free gas available at the base of the column and promote column collapse. Carazzo et al. (2008a) studied the effects of reduced turbulent entrainment due to negative buoyancy at the base of the column and showed that it also promotes column collapse. Gas entrapment and reduced entrainment act in the same direction and, when taken independently, yield model predictions consistent with field data. However, these two phenomena have not been considered together yet, and it can be argued that their combined effect could be to favor too much the collapse regime compared to the natural cases, hence reducing their performances in determining accurately the conditions of collapse. Here we propose to combine the two effects, which requires to take into account the evolution of the total grain size distribution (TGSD) due to sedimentation (Girault et al., 2014).
Our paper is organized as follows. In section 2, we describe our physical 1D model of explosive volcanic columns. In section 3, we analyse the results of the model taking into account variable entrainment as a function of buoyancy, sedimentation, gas entrapment, and open porosity, and we investigate the control of these parameters and phenomena on the conditions leading to column collapse. We further quantify the fountain height and characterize the PDC produced in the collapse regime. In section 4, we compare our theoretical predictions with field data from two well-known historical eruptions (Taupo and Vesuvius). In section 5, we discuss additional effects that may influence the transition between stable and collapsing eruptive columns, and we conclude in section 6.
2. Physical model of explosive volcanic columns
Our model relies on a 1D steady-state “top-hat” formalism for a conical jet in which all the dynamical variables are considered constant inside the jet and zero outside (Morton et al., 1956). The horizontal rate of entrainment of the surrounding fluid is assumed to be proportional to the local vertical ascension rate of the plume, through a constant entrainment coefficient 𝛼!. Our work is based on the improved version of the Woods (1988) model, that explicitely considers the conservation of energy and its effect on the evolution of the bulk density of the flow. As in Woods (1988), we consider thermal and mechanical equilibrium between the volcanic gas and the particles.
For a particle-laden volcanic jet and a calm stratified atmosphere, the three macroscopic conservation equations of mass, momentum and energy flow rates in steady-state are written as (Woods, 1988; Woods and Bursik, 1991; Bursik, 2001; Costa et al., 2006; Girault et al., 2014): 𝑑 𝑑𝑧 𝜌𝑈𝑅! = 2𝜌!𝑈!𝑅 + 𝑑𝑄! 𝑑𝑧 !! !!! , (1) 𝑑 𝑑𝑧 𝜌𝑈!𝑅! = 𝑔 𝜌!− 𝜌 𝑅!+ 𝑈 𝑑𝑄! 𝑑𝑧 !! !!! , (2) 𝑑 𝑑𝑧 𝜌𝑈𝑅!𝑐!𝑇 = 2𝜌!𝑈!𝑅𝑐!𝑇!− 𝜌!𝑔𝑈𝑅!+ 𝑐!𝑇 𝑑𝑄! 𝑑𝑧 !! !!! , (3)
where R(z) is the column radius, U(z) is the vertical velocity, g is the acceleration of gravity, 𝜌, 𝑐! and T are the density, the specific heat and the temperature at constant pressure of the bulk mixture, respectively, 𝜌!, 𝑐! and 𝑇! are those of the atmosphere (all variables are defined
in the Notation section). 𝑄! = 𝑥!𝜌𝑈𝑅!, where 𝑥! is the mass proportion of 𝜙-sized particles
grain sizes ranging from 𝑑!"# = 10 𝜙 (1 𝜇m) to 𝑑!"# = -9 𝜙 (0.5 m) with one 𝜙 intervals. Magma temperature is taken as the average of andesitic magma (T0 = 1200 K). As illustrated
in Fig. 1, 𝑈! is the entrainment rate at the edge of the plume, defined as 𝑈! = 𝛼!𝑈 (Morton et al., 1956), which is here function of the column buoyancy relative to the ambient air, and is expressed as (Kaminski et al., 2005):
𝛼! =
𝐶
2+ 1 − 1
𝐴 𝑅𝑖, (4) where Ri= g
(
ρa−ρ)
R /ρaU2 is the Richardson number in the plume, and A and C are dimensionless parameters depending on the flow structure. C is taken as a constant (≈ 0.135) whereas A evolves as a function of the downstream distance from the source and buoyancy (see Appendix A).To follow the evolution of the density in the plume as a function of entrainement and temperature variations with height, we use the same constitutive equations as in Woods (1988): 1 𝜌= 1 − 𝑥! 𝜌! + 𝑥!𝑅!𝑇 𝑃! , (5) 𝑥! = 1 + 𝑥!! − 1 𝜌!𝑈!𝑅!! 𝜌𝑈𝑅! , (6) 𝑅! = 𝑅!+ 𝑅!! − 𝑅! 1 − 𝑥! 𝑥! 𝑥!! 1 − 𝑥!! , (7) 𝑐! = 𝑐!+ 𝑐!!− 𝑐! 1 − 𝑥! 1 − 𝑥!! , (8) where 𝜌! = 2000 kg m-3 is the average density of the particles, 𝑥
!(𝑧) is the effective gas mass
at the vent. 𝑃! 𝑧 , 𝑇!(𝑧) and 𝜌!(𝑧) depend on the atmospheric conditions which we take as typical polar, mid-latitude or tropical (Glaze and Baloga., 1996; Carazzo et al., 2008b).
2.2 Particle sedimentation
To account for the mass loss of 𝜙-sized particles from the edges of the column, we consider it to be proportional to the mass discharge rate of particles 𝑄! and to the terminal fall velocity 𝑉!, such as (Woods and Bursik, 1991; Ernst et al., 1996; Girault et al., 2014):
𝑑𝑄! 𝑑𝑧 = −𝑝! 𝑄! 𝑅 𝑉! 𝑈 , (9)
where 𝑝! is a probability of sedimentation experimentally determined and taken equal to 0.27 ± 0.01 (Ernst et al., 1996; Girault et al., 2014; 2016). For a given particle size, the fallout velocity 𝑉! is calculated using the formulae of Bonadonna et al. (1998):
where 𝑑! is the particle diameter of a 𝜙-sized particle, 𝜇(𝑧) is the dynamic viscosity of air (Sutherland, 1893), and 𝑅𝑒! = 𝜌𝑑!𝑉!/𝜇 is the particle Reynolds number.
Vφ = 3.1dφg
(
ρp−ρ)
ρa dφ 4g 2 ρ p−ρ(
)
2 225µρa ⎛ ⎝ ⎜ ⎜ ⎞ ⎠ ⎟ ⎟ 1/3 dφ2g ρ p−ρ(
)
18µ ⎧ ⎨ ⎪ ⎪ ⎪ ⎪⎪ ⎩ ⎪ ⎪ ⎪ ⎪ ⎪ for , for , (10) for ,2.3 Grain-size distribution and amount of gas at the vent
In explosive eruptions, GSD of pyroclasts results from a fragmentation sequence in the conduit before the eruption. The rapid decompression of magma during its ascent causes a “primary” fragmentation (Alibidirov and Dingwell, 1996), which disintegrates bubbly magma into fragments, then followed by a “secondary” fragmentation of larger fragments into finer ash (Kaminski and Jaupart, 1998). During this sequence, magmatic gas separates into two phases: an entrapped one contained in bubbles within the clasts, and a continuous one carrying fragments and ashes. This latter phase corresponds to the effective amount of "free" gas that has to be considered for the modeling of the turbulent flow. Within this framework, clast size plays a key role in setting the amount of gas released at fragmentation: large fragments (pumices) retain a larger amount of gas than small fragments (ashes) do. Field data (Kaminski and Jaupart, 1998) and fragmentation experiments (e.g., Kueppers et al., 2006) have shown that volcanic rocks fragment according to a power-law distribution:
𝑁 𝑅 ≥ 𝑟 = 𝜆𝑟!!, 11
where 𝑁 𝑅 ≥ 𝑟 is the number of fragments of size R larger than or equal to 𝑟, 𝜆 is a normalization constant and 𝐷 is the power-law exponent.
The two main parameters that control the stability of a volcanic plume are the mass discharge rate and the momentum flow rate at the vent, or, equivalently, the mass discharge rate and exit velocity (Wilson et al., 1978; Woods, 1988; Sparks et al., 1997). Because the exit velocity is mainly controled by the amount of gas in the volcanic mixture, 𝑥!!, (e.g., Wilson et al. 1980; Koyaguchi et al. 2010; see Appendix B) the transition between the Plinian and Fountain regimes is often given as a threshold mass discharge rate for a given gas mass
fraction. Here, we calculate 𝑥!! as the total fraction of exsolved gas minus the amount of exsolved gas trapped in large particles, using the model of Kaminski and Jaupart (1998; 2001).
If bubbles inside a fragment are not connected to the exterior, the fraction of gas released by each fragment is given by !!"#
!!"#=
!!
! for particle with a radius 𝑟 larger than 3𝑏, and !!"#
!!"#= 1 for particles smaller than 3𝑏, where 𝑏 is the mean bubble radius in the magma. These
relationships can then be used to calculate the total gas released at fragmentation (Fig. 2a) provided that the TGSD - hence D - is known, as well as the smallest and largest particle sizes
𝑟!"# and 𝑟!"#, and the mean bubble size. As discussed by Kaminski and Jaupart (1998), the
exact values of 𝑟!"# and 𝑟!"# do not significantly affect the calculations, and uncertainties on their determination change the result by ± 5% only. Indeed, where fine particles dominate (i.e., D > 3), the fragments do not significantly entrap gas since all their bubbles are connected to the exterior. The exact value of 𝑟!"# is therefore not critical as long as it is much smaller
than 3𝑏. On the other hand, where large particles dominate (i.e., D < 3) the average fragment size is much larger than the bubble size, hence fragments do not significantly release gas. The results are also weakly sensitive to the exact value of 𝑏 or to more complex bubble size distribution in the magma. Fig. 2a gives the fraction of gas released at fragmentation as a function of D for three different values of the mean bubble size (from 10 𝜇m to 1 mm) and shows that this does not change the results by more than 5%. The main parameter controlling the mass fraction released at fragmentation is therefore the power law exponent D. For the rest of the paper we set 𝑟!"# = 0.5 𝜇m, 𝑟!"# = 0.25 m (see section 2.1), and 𝑏 = 100 𝜇m, and we take a power-law exponent D ranging from 2.5 (coarsest distribution) to 3.3 (finest distribution), a value beyond which the results are not longer affected by the precise value of D.
Several studies have shown that inside pumices, some of the bubbles are connected to the exterior (e.g., Toramaru, 1988; Klug and Cashman, 1996) and contribute to an additional release of gas through this "open porosity". Measurements made on trachytic pumices from the Vesuvius 79 CE (Shea et al., 2012), on dacitic pumices from the Novarupta 1912 (Nguyen, 2014), on andesitic pumices from Soufriere Hills 1997 (Formenti and Druitt, 2003), Taranaki 1655 CE (Platz et al., 2007), and Lascar 1993 (Formenti and Druitt, 2003), and on rhyolitic pumice from Kos Plateau Tuff 161,000 BP (Bouvet de Maisonneuve et al., 2009), and Mount Mazama 7700 BP eruptions (Klug et al., 2002), lead to open porosity between 60 to 70% for explosive eruptions regardless of the magma composition.
To take into account open porosity in our model, we relax the gas entrapment hypothesis of Kaminski and Jaupart (1998) by introducing a new parameter 𝜉 =!!"#$%&&'(
!!"#$$%&
where 𝑉!"#$%&&'( is the volume of gas initially entraped in the fragment but now released through the connected open porosity, and 𝑉!"#$$%& is the volume of gas initially trapped into the fragments at fragmentation. For particles with a radius larger than 3𝑏, the definition of 𝜉 leads to !!"#
!!"#=
!!(!!!)!! !
! , and we keep !!"#
!!"#= 1 for particles smaller than 3𝑏. Thus, in the
extreme case where no open porosity develops, the volume of gas initially entraped but released is null (𝜉 = 0) and !!"#
!!"#=
!!
!. On the other hand, if the open porosity reaches 100%,
all the gas initially entraped is released (𝜉 = 1) and !!"#
!!"#= 1 for all particles. Fig. 2b gives the
effective fraction of gas released after fragmentation and the development of an open porosity as a function of D for four different values of 𝜉 (0, 20, 65 and 80%).
In explosive eruptions, the volcanic mixture generally exits the vent at a sonic velocity (𝑈!) and with a pressure (𝑃!) larger than the atmospheric pressure (𝑃!). After its rapid decompression to the atmospheric pressure, the velocity of the mixture 𝑈! is supersonic and can be expressed as (Woods and Bower, 1995):
𝑈! = 𝑈!+ 𝑆
𝑄 𝑃! − 𝑃! (12) where 𝑆 is the cross-sectional area of the conduit, and 𝑄 is the mass discharge rate feeding the eruption. In the case of a free decompression (i.e., not controled by the shape of the crater) and for a cylindrical conduit, it is possible to obtain 𝑈! as a function of the amount of gas in the mixture for a given mass discharge rate (see Appendix B). We will use these conditions in the next parts of the article and we will discuss in section 5.1 the consequences of the presence of a crater.
For a given set of source conditions, the dynamical parameters of the plume, i.e. its velocity, radius, density and temperature are then calculated at each step of altitude z in a mid-latitude atmosphere using equations (1)-(12).
3. Results
3.1 Prediction of column collapse
To compare the model predictions with the previous studies of Kaminski and Jaupart (2001) and Carazzo et al. (2008a), we define the column regimes as a function of source mass discharge rate and total gas content, which can both be retrieved from field data.
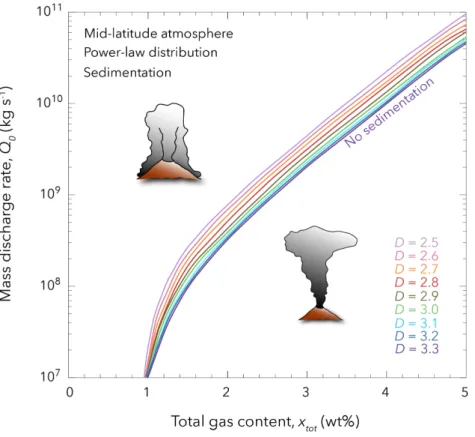
Fig. 3 shows the predictions of the model for column collapse when accounting for reduced entrainment and particle sedimentation without gas entrapment (i.e., 𝑥!! = 𝑥!"!). The transition curve is highly influenced by the value of D: the critical mass discharge rate before
collapse is shifted by about an order of magnitude between the coarsest (D = 2.5) and finest (D = 3.3) population. For mass discharge rates larger than 107 kg s-1, low values of D tend to
increase the critical mass discharge rate at which collapse occurs. In this case, the loss of particles by sedimentation decreases significantly the column mass discharge rate during its rise, but is not large enough to drain out the thermal reservoir available to heat up the entrained cold atmospheric air, which helps the generation of a buoyant plume. We thus obtain that when sedimentation only is taken into account, coarse distributions (i.e. low values of D) promote the formation of stable plumes, a result apparently at odds with the conclusions of Kaminski and Jaupart (2001). To settle these conflicting results, we study the net effect of sedimentation when gas entrapment is also considered.
Fig. 4 shows the combined effect of particle sedimentation and gas entrapment compared to the case considering gas entrapment but no sedimentation. We consider here that the exponent D controls the effective "free" gas content (Fig. 2a) and that there is no open porosity (𝜉 = 0). We find that gas entrapment, hence the characteristics of the population of particles produced by fragmentation, has in general a dominant role on column collapse compared to particle sedimentation. However, for D values smaller than 2.8, sedimentation and gas entrapment are of equal importance and act together to hamper and even make impossible the formation of stable plumes. This result is consistent with the observations of Kaminski and Jaupart (1998) who compiled values of D systematically larger than 3.0 in all the pumice fallout deposits they considered. The shift between the two transition curves calculated at D = 2.8 (Fig. 4) suggests that, for small values of D, gas entrapment results in the decrease of the vertical velocity near the vent, which further enhances the effect of particle sedimentation.
The model accounting for gas entrapment and a constant entrainment presented by Kaminski and Jaupart (1998), and the model described by Carazzo et al., (2008a) accounting
for a variable entrainment but no gas entrapment, both make the formation of a buoyant column less likely. The combined effects of sedimentation, gas entrapment and reduced entrainment lead to the drastic effect on the transition described here (Fig. 4) and casts some doubt on their ability to reproduce natural data previously explained by each model considered separately. These two models are however end-members and the introduction of open porosity may yield a more balanced conclusion.
Fig. 5 shows the combined effect of particle sedimentation, gas entrapment and post-fragmentation outgassing due to open porosity for three values of open porosity: 20%, 65% (average value from natural samples) and 80%. As expected, it appears that for low values of D, the larger the open porosity, the easier it becomes to generate a buoyant plume. This illustrates how post-fragmentation outgassing reduces the impact of gas entrapment shown in Fig. 4. When accounting for an open porosity of 65%, the critical mass discharge rate at which collapse occurs is increased by up to two orders of magnitude for D < 3, and by up to a factor of 2 for D > 3, compared with predictions made without open porosity (Fig. 4). For D > 3, the critical mass discharge rate is also increased by up to a factor of 3 compared with predictions made without sedimentation and gas entrapment (i.e., Fig. 4 in Carazzo et al., 2008a).
3.2 Predictions for the dynamics of collapsing fountains
Girault et al. (2014) showed that the power-law exponent of the TGSD at the vent reduces the maximum height reached by a stable plume by 30% for mass discharge rates larger than 107 kg s-1. To investigate a similar effect in the case of collapsing volcanic fountains, we performed calculations for a power-law exponent D ranging from 2.5 to 3.3 and for two different values of total exsolved gas content of 2 and 4 wt% (Fig. 6). For each value
of gas content, we tested two different initial MDR corresponding to conditions near the plume/fountain transition (i.e., 3.108 kg s-1 for 𝑥
!! = 2 wt%, and 10
10 kg s-1 for 𝑥
!! = 4 wt%)
and far from it (i.e., 1010 kg s-1 for 𝑥!! = 2 wt%, and 1011 kg s-1 for 𝑥!! = 4 wt%). We further consider an open porosity of 65%. We compare the maximum height reached by the fountain when accounting for particle sedimentation (Sed) and/or gas entrapment (GE) and/or open porosity (OP) or none of these effects. Fig. 6 shows that particle sedimentation alone has a negligible (yet positive) effect on the maximum fountain height. When gas entrapment alone or gas entrapment plus sedimentation are taken into account, the maximum fountain height strongly decreases when D decreases, in agreement with the results of Girault et al. (2014), which emphasizes the dominant role of gas entrapment. The change in fountain height can reach up to a factor of 5 for conditions far from the transition (Fig. 6 a,b), to a factor of 15 for conditions near the transition (Fig. 6 c,d). Finally, when an open porosity of 65% is taken into account (Sed+GE+OP), the effect of gas entrapment is largely reduced and intermediate fountain heights are obtained (red curves in Fig. 6).
Fig. 6 shows that when mainly composed of fine particles (i.e., high D value), the fountain will reach a relatively high altitude allowing the resulting PDC to cover larger distances on ground. On the other hand, when the fountain has a coarser distribution of fragments (i.e., low D value), it will reach a lower maximum height, and one can expect the resulting PDC to be restricted to closer distances from the vent due to the smaller potential energy available. Bursik and Woods (1996) showed that varying the MDR by an order of magnitude changed the run-out distance reached by the PDC by a factor of ~2.4 (Fig. 12a of Bursik and Woods, 1996), an increase that can be explained by doubling the height of the column in the plume model (Woods, 1988). In our model, a change in fountain height of a factor 1.5 is obtained when varying D from 2.5 to 3.3 (red curves in Fig. 6a, b, c, d),
suggesting in turn that the run-out distance will increase by a factor of ≈ 2 for this change of D.
Our model can also be used to inferthe grain size distribution in the PDC generated by a collapsing column. The results are presented in Fig. 7 based on four particle classes: bombs (–9 to –7 𝜙), lapilli (–6 to –1 𝜙), coarse ash (0 to 6 𝜙), and fine ash (7 to 10 𝜙). For low values of D, the collapsing fountain is more concentrated and enriched in coarse fragments (bombs and lapilli) at its maximum height. These large fragments shall form dense PDC loaded with bombs and lapilli. Conversely, for high values of D, the collapsing fountain is mainly made of fine ash particles at its maximum height, which will produce dilute PDC mostly made of coarse and fine ash particles. Varying the initial gas content and the MDR feeding the fountain does not affect these conclusions (Fig. 7), suggesting that D has a major control on the population of particles in the PDC produced during column collapse.
4. Comparison with natural cases
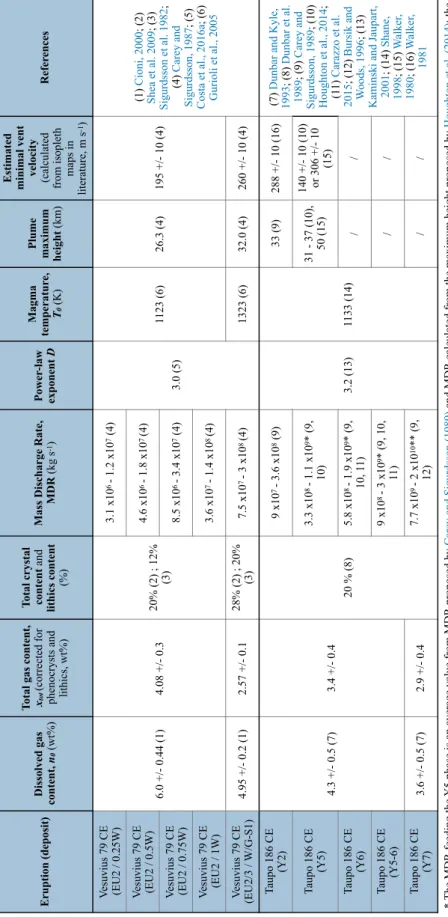
We now compare our model predictions with historical eruptions providing well-constrained values of gas contents, MDR and power-law exponent D. There are however only a few examples of such well-documented events, and here we choose two famous historical ones: the ≈186 CE Taupo and the 79 CE Vesuvius eruptions. All the available geological data are summarized in Table 1.
4.1 The ≈186 CE Taupo eruption
The Taupo eruptive episode consists in a series of Plinian and phreato-Plinian eruptions (Walker, 1980; Froggatt, 1981; Talbot et al., 1994; Wilson, 1985; 1993; Wilson and
Walker, 1985; Houghton et al., 2014). The stratigraphic sequence starts with a phreato-Plinian ash layer (Y1) overlain by a Plinian fallout (Y2 or Hatepe), and two phreato-Plinian ash layers (Y3 and Y4 or Rotongaio). The main sequence corresponds to a Plinian fallout deposit (Y5 or Taupo Plinian pumice) interbedded with intraplinian ignimbrites (Y6 or early ignimbrite flow units) and covered by PDC deposits (Y7 or Taupo ignimbrite). Here, we focus on the Y2, Y5-6 and Y7 phases as they represent the transition between Plinian, transitional, and collapse regimes, respectively. During these phases, the MDR increases from 1.8×10! kg s-1 during
Y2 (Carey and Sigurdsson, 1989) to 2×10! kg s-1 during Y5/6 (Carey and Sigurdsson, 1989;
Houghton et al., 2014; Carazzo et al., 2015), and to 1.4×10!" kg s-1 during Y7 (Carey and
Sigurdsson, 1989; Bursik and Woods, 1996). These values have been debated in the literature. Here we retain average values for Y2, Y5/6 and Y7, and we use the minimum and maximum MDR proposed in the literature to estimate an error bar in Fig. 8 (see Table 1).
Dunbar and Kyle (1993) estimated the dissolved water content to 4.3 ± 0.5 wt% for the Y2 and Y5-6 phases and to 3.6 ± 0.5 wt% for the last collapsing phase Y7. We correct these values for the presence of crystals and lithic fragments, which do not contain volatiles (Kaminski and Jaupart, 2001). Considering a proportion of crystals and lithics contents of 20% (Dunbar et al. 1989) and assuming complete degassing, we deduce a total gas mass fraction in the mixture of 3.44 ± 0.4 wt% for both the Y2 and Y5-6 phases and 2.88 ± 0.4 wt% for the Y7 phase. The power-law exponent D is taken to be 3.2, as calculated by Kaminski and Jaupart (1998), the magma temperature is set to 1133 K, as measured by Shane (1998), and the exit velocity is set to 306 ± 10 m s-1, as determined from the isopleth maps of
the transitional phase Y5-6 (Walker, 1980). We note that using the power-law exponent D = 3.2 and an open porosity of 60-70% gives !!!!
!"!≈ 0.94 (Fig. 2b) hence a small net effect of gas
calculated exit velocity of 275 ± 5 m s-1 for the Y5-6 phase (Appendix B), which is consistent
with the exit velocity constrained from the distribution of lithic fragments.
Fig. 8 compares the eruptive parameters inferred for the Taupo eruption (i.e., mass discharge rate and total gas content) and the transition between the stable plumes and the collapsing fountains predicted when considering particle sedimentation, gas entrapment and an open porosity of 60-70%. The good agreement between the model predictions and the field data illustrates the global consistency of the model.
4.2 The 79 CE Vesuvius eruption
The 79 CE Vesuvius eruption is one of the most well-documented historical Plinian event (Lirer et al., 1973; Sigurdsson et al., 1982; 1985; 1990; Carey and Sigurdsson, 1987; Cioni, 2000; Cioni et al., 1995; 2008; Balcone-Boissard et al., 2010; Shea et al., 2012 and references therein) and allows a thorough comparison with our theoretical predictions. The eruption started with a short phreatomagmatic phase and then pursued with a paroxysmal Plinian phase for about 17 hours. First, a buoyant stable column rose up to ≈27 km high and produced a massive layer of white pumice (WP) fallout deposits that can be decomposed in 4 chronostratigraphic levels (levels 0.25W, 0.5W, 0.75W and 1W of the white fallout sequence; Carey and Sigurdsson, 1987). This phase is also called EU2 in the literature (Cioni et al., 1995; 2008; Balcone-Boissard et al., 2010; Shea et al., 2012). After a first partial collapse, the magma composition changed and yielded more unstable conditions. The column reached a maximum height of ≈33 km and generated several grey pumice (GP) fallout deposits interbedded with surges (levels W/G-S1, S1-S2, S2-S3, S3-S4 of the grey fallout sequence; Carey and Sigurdsson, 1987). This transitional phase is also called EU3 in the literature (Cioni et al., 1995; 2008; Balcone-Boissard et al., 2010; Shea et al., 2012). A first total
collapse ended this magmatic phase. The eruption pursued for another few hours with a last short-lived plume before a second total collapse marking the end of the eruption ( Balcone-Boissard et al., 2010).
The mass eruption rates of successive phases were calculated, from the column heights inferred from the isopleth maps and the temperate discharge curves of Sparks (1986): the MDR increased from 6.1×10! to 7.1×10! kg s-1 for the WP fall sequence and then up to
1.5×10! kg s-1 for the first partial collapse involving GP (Carey and Sigurdsson, 1987;
Kaminski and Jaupart, 2001). We retain an uncertainty of a factor of 2 for the MDR, which corresponds to the change in MDR required to reach the same column height when using the model of Sparks (1986) or a more recent one (Girault et al., 2014). The total dissolved gas content of the melt is estimated to 6.00 ± 0.44 wt% at the beginning of the Plinian stable phase, and then decreased to 4.95 ± 0.20 wt% at the WP/GP boundary (Cioni, 2000). Using the same method as for the Taupo eruption, we correct these values for the presence of crystals and lithic fragments. The crystals content increased from 20% during the WP phase to 28% during the GP phase (Shea et al., 2009), and the lithics content increased from 12% during the WP phase to 20% during the GP phase (Sigurdsson et al., 1982). Assuming complete degassing, we find that the total gas mass fraction in the magma decreased from 4.08 ± 0.30 wt% during the WP phase to 2.57 ± 0.10 wt% during the GP phase. The power law exponent D is taken to be 3.0 as measured by Costa et al. (2016b), the magma temperature is set to 1323 K, as measured by Gurioli et al. (2005) for the GP phase, and the exit velocity is set to 260 ± 10 m s-1 for the GP phase from the isopleth maps of Carey and
Sigurdsson (1987). We note that using the power-law exponent D = 3.0 and an open porosity of 60-70% gives !!!!
!"!≈ 0.84 (Fig. 2b). Together with the total gas mass fraction of 2.57 wt%,
B), which is consistent with the exit velocity constrained from the distribution of lithic fragments.
Fig. 9 compares the eruptive parameters inferred for the Vesuvius eruption (i.e., mass discharge rate and total gas content) and the transition between the stable plumes and the collapsing fountains predicted when considering particle sedimentation, gas entrapment and an open porosity of 60-70%. The model fails to reproduce the conditions of the transition between the Plinian stable regime of the WP fallout sequence and the collapse regime at the beginning of the GP fallout sequence. As all the model parameters are set by the field constraints, they cannot be tuned to improve the model predictions. However, we note that field deposits from this eruption are characterized by a power-law exponent D = 3.0, a D value that defines the transition between a population dominated by coarser fragments (i.e., D < 3) and a population dominated by ash (i.e., D > 3). We suggest that the hypothesis of thermal equilibrium has to be reconsidered for D = 3.0. For D > 3, the ash particles dominating the population are small enough to remain in thermal equilibrium (Woods and Bursik, 1991). For D < 3, coarse pumices rapidly settle to the ground leaving fine and coarse ash particles in thermal equilibrium in the column. For D = 3.0, there is no dominant population: the average size of the fragments is intermediate between fine ash and lapilli fragments, and is too large to insure perfect thermal equilibrium. In that case column collapse in favored and the critical mass discharge rate before collapse can be reduced by up to an order of magnitude (Fig. 5 of Woods and Bursik, 1991), which would shift the theoretical predictions towards a better agreement with field data from the 79 CE Vesuvius eruption.
5. Discussion
Gas entrapment – more or less modulated by the open porosity - reduces the amount of gas in the mixture and, in turn, the vertical velocity at the base of the plume. The presence of a crater with a specific shape can similarly reduce the velocity at the base of the plume (Woods and Bower, 1995; Koyaguchi et al., 2010), and it is always possible to define a crater shape that will perfectly mimic the effect of gas entrapment. As field data provide only constraints on the exit velocity, it is not possible to decide which model should be chosen. Overall, both decompression in a crater and gas entrapment can occur during an eruption and act together to set the conditions for collapse. In the case of the Taupo eruption, the global consistency between our model predictions with gas entrapment and open porosity and field data can be taken as a strong argument in favor of this framework. Adding a crater constraining decompression in the case of Taupo will actually decrease the agreement between model predictions and the data. In the case of Vesuvius, our model does not predict correctly the transition, but the predictions would not be changed if a crater is added as the exit velocity will remain constrained by the lithics.
5.2 Effect of wind on column collapse
The presence of wind can affect the plume dynamics and stability (Bursik, 2001; Degruyter and Bonadonna, 2013; Woodhouse et al., 2013; Suzuki and Koyaguchi, 2013; 2015; Mastin, 2014; Girault et al., 2016). Thereotical and numerical studies show that for high MDR and/or low wind velocity, the volcanic column forms a strong plume not affected by the wind field (Bonadonna and Phillips, 2003). For low MDR and/or high wind velocity, the volcanic plume trajectory is strongly controlled by the wind strength and direction, and the volcanic column forms a weak bended plume (Bursik, 2001). The critical MDR before collapse is also strongly increased by a crosswind relative to no wind conditions, thus
promoting the formation of a stable plume (Degruyter and Bonadonna, 2013; Girault et al., 2016). Girault et al., (2016) showed that this effect is more pronounced for small MDR when D < 3 than for large MDR when D > 3, and that it strongly depends on the shape of the wind profile. The incorporation of crosswind in our model would thus requires to exactly know the shape of the wind profile, a parameter that is unknown for historical eruptions, and to parameterize the turbulent entrainment coefficient due to wind (commonly named 𝛽). The latter is currently unconstrained from laboratory experiments (Costa et al., 2016a), and its relation with the turbulent entrainment coefficient 𝛼 still remains unclear (Aubry et al., 2017a; 2017b). We therefore consider that a systematic study of this effect remains outside the scope of the present study.
We however check the validity of our no wind model when applied to the two historical eruptions considered here, using the method of Carazzo et al. (2014) to estimate the impact of wind on the plume dynamics. According to the isopleths maps determined from field data, the maximum wind velocity reached about 28 m s-1 during the WP phase of the 79 CE Vesuvius eruption, 31 m s-1 during the GP phase (Carey and Sigurdsson, 1987), and 27 m
s-1 during the ≈186 CE Taupo eruption (Carey and Sparks, 1986). Together with the source conditions given in Table 1, we calculate the ratio of the dimensionless wind velocity to the dimensionless plume velocity 𝑊∗/𝑈∗ which is used as a proxy to infer the plume regime
(Carazzo et al., 2014). The 79 CE Vesuvius column is found to be a slightly distorted plume at the beginning of the eruption (𝑊∗/𝑈∗ ≈ 0.2) and a strong plume before the column
collapses (𝑊∗/𝑈∗ ≈ 0.1). The ≈186 CE Taupo column is found to be a strong plume during
the entire eruption (𝑊∗/𝑈∗ ≈ 0.06). For these two historical eruptions, atmospheric winds
did not affect significantly the plume dynamics, and can thus be neglected when investigating the mechanisms leading to column collapse.
6. Conclusions
We have tested the combined effects of gas entrapment and reduced entrainment using a 1D turbulent plume model accounting for particle sedimentation. Compared with the predictions of previous studies accounting for gas entrapment or reduced entrainment only, this model favors too much column collapse compared with natural cases. We thus take into account open porosity, i.e. the fraction of bubbles preserved inside a fragment after fragmentation but connected to the exterior, which helps to generate stable plumes. We then predict various grain-size distributions in PDC depending on the TGSD (hence D value) at the volcanic vent. Low D values tend to promote the formation of relatively small fountains producing concentrated PDC with large particles reaching relatively low run-out distances. High D values tend to promote the formation of higher fountains producing dilute PDC containing mostly fine particles and covering larger distances. Finally, we compare the model predictions to the two well-known eruptions of Taupo (≈186 CE) and Vesuvius (79 CE). We find a good agreement between theoretical predictions and field data for the Taupo eruption. For the Vesuvius eruption characterized by a power-law exponent D = 3.0, we suggest that thermal disequilibrium could explain the discrepancy between our predictions and field data.
Notation
a radius of the conduit, m A buoyancy parameter b bubble diameter, m
C shear stress parameter, 0.135
𝑐! specific heat at constant pressure of the particles, 1100 J K-1
𝐷 exponent of the power-law distribution of particles, dimensionless 𝑑! particle diameter, m
f frictional forces per unit of volume acting on the flow, N m-3 𝑔 gravitational acceleration, 9.81 m s-2
n total volatile content of the melt, wt% 𝑁! number of classes of particle size, 20 P flow pressure in the conduit, Pa
𝑃! atmospheric pressure, Pa 𝑃! flow pressure at the vent, Pa
𝑝! probability of sedimentation, 0.27 ± 0.01 Q mass discharge rate feeding the eruption, kg s-1 𝑄! mass discharge rate of particles, kg s-1
r particle radius, m
𝑟!"# maximum particle size considered in this study, m
𝑟!"# minimum particle size considered in this study, m
𝑅 column radius, m
𝑅! column radius at the vent, m
𝑅! gas constant of the atmospheric air, 287 J K-1 kg-1
𝑅𝑒! Reynolds number of the particles, dimensionless
𝑅! bulk constant of the mixture in the column, 𝑅!!= 461 J K-1 kg-1 𝑅𝑖 local Richardson number, dimensionless
S cross-sectional area of the conduit, m2 𝑇 flow temperature, K
𝑇! average andesitic magma temperature, 1200 K u velocity of the magma-volatiles mixture, m s-1 𝑈 average vertical velocity in the column, m s-1
𝑈! column average vertical velocity after decompression, m s-1
𝑈! entrainment rate at the edge of the plume, m s-1 𝑈! average vertical velocity at the vent, m s-1
𝑉!"#$%&&'(, volume of gas released due to the development of open porosity, m3
𝑉!"#$$%&, volume of gas initially trapped at fragmentation, m3
𝑉! particle fallout velocity, m s-1
𝑥! effective gas mass fraction, dimensionless
𝑥!"! total gas content, dimensionless
𝑧 vertical axis, m
z*, dimensionless height, z* = 𝑧/(2𝑅!)
𝛼! variable entrainment coefficient, dimensionless 𝜆 normalization constant
𝜇! dynamic viscosity of air at the vent, 𝜇! = 1.832 ×10!! Pa s
𝜇! liquid viscosity, 105 Pa s 𝜙 particle size notation, 𝑑! = 2!!
𝜌 bulk density of the volcanic mixture, kg m-3
𝜌! atmospheric density, kg m-3
𝜌! liquid density, 2500 kg m-3 𝜌! particle density, 2000 kg m-3
𝜌! flow density at the vent, kg m-3
0 values at the vent
Acknowledgments
The authors warmly thank the reviewers, T. Koyaguchi and W. Degruyter, and the editor, J. Marti for their constructive comments which greatly improved the original version of this manuscript. We are grateful to H. Balcone-Boissard for fruitful discussions on the porosity of pumices from the Vesuvius eruption. This work is a part of A. Michaud-Dubuy’s PhD thesis (Institut de Physique du Globe de Paris). Support was provided by RAVEX (ANR contract ANR-16-CE03-0002). This is IPGP contribution number 3944.
Appendix A
The model of turbulent entrainment of Kaminski et al. (2005) introduced two dimensionless variables: C, which gives the fraction of kinetic energy available for turbulent entrainment, and A which depends on the half width of velocity and density profiles in the jet. Carazzo et al. (2006; 2008a; 2008b) further showed that A is not a constant but evolves as a function of the distance from the source and buoyancy. They propose the following empirical formula:
𝐴 = 𝐴! +(𝐴!− 𝐴!) 4
𝑧
𝐿!− 1 , (𝐴1)
where Aj and Ap are the values of A for a pure jet (Ri=0), and a pure plume (no mass discharge
rate at the source), respectively. Lm is the Fisher length scale, defined as:
𝐿! =𝑀!
!/!
where M0 and F0 are the momentum and buoyancy flow rates at the source, respectively.
These parameters were estimated from laboratory measurements (Carazzo et al. 2006) and can be fitted as a function of the dimensionless height z* = z /(2R0) by:
𝐴! = 1.1 + 4.6. 10!! ×(𝑧∗)! − 2. 10!!×(𝑧∗)!
𝐴! = 1.3 + 3.4. 10!! ×(𝑧∗)!+ 2.1. 10!!×(𝑧∗)! for 𝑧∗ < 15, (A3)
and
𝐴! = 2.45 − 1.05 exp (−4.65. 10!!×𝑧∗)
𝐴! = 1.42 − 4.42 exp (−2.188. 10!!×𝑧∗) for 𝑧∗ > 15. (A4)
This set of equations is injected into Eq. (4) to calculate the entrainment coefficient 𝛼! at each
altitude step z.
Appendix B
We derive an expression for the exit velocity after decompression following Woods and Bower (1995). For an impermeable conduit, the mass discharge rate Q remains constant with depth, so that the mass conservation equation gives:
Q = 𝜌𝑢𝑆 = 𝑐𝑠𝑡, (𝐵1)
where 𝜌 and 𝑢 are the density and the velocity of the magma-volatiles mixture, respectively, and 𝑆 = 𝜋𝑎! is the cross-sectional area of the conduit with 𝑎 its radius. For simplicity, we
assume that the conduit has a constant cross-section.
The momentum conservation equation in the conduit can be written as (Wilson et al. 1980; Woods and Bower, 1995; Koyaguchi, 2005)
𝜌𝑢!"!"+!"!" = −𝜌𝑔 − 𝑓, (B2) where 𝑓 is the frictional forces acting on the flow, P the flow pressure in the conduit, and 𝑔 the gravitational acceleration.
Before exsolution, we consider that the liquid can be modelled as a Poiseuille flow, where the mass discharge rate 𝑄 is linked to the conduit radius 𝑎 by
𝑄 =𝜌!𝜋𝑎!Δ𝜌𝑔
8𝜇! , (𝐵3)
where 𝜌! and 𝜇! are the liquid density and viscosity taken as 2500 kg m-3 and 105 Pa s,
respectively, and Δ𝜌 is the density difference between the liquid and the country rock, which we set at 100 kg m-3. Combining equations (B1) and (B3) gives
𝑆 𝑄= 8𝜋𝜇! 𝑄𝜌!Δ𝜌𝑔 !/! , (𝐵4) which can be replaced in equation (12).
We now seek for an expression for 𝑈! and 𝑃! in equation (12). Above the fragmentation level, the particle-gas mixture density depends on the effective amount of free gas 𝑥! in the volcanic mixture, such as 𝜌 = !!!! !! + !!!!! ! !! , (𝐵5) where we assume that 𝜌! and T remain constant in the conduit (Woods and Bower, 1995). By replacing equations (B1) and (B5) into equation (B2), one can write
𝑑𝑃
𝑑𝑧 1 − 𝑢!𝑥!𝑅!𝑇 𝜌!
𝑃! = −𝜌𝑔 − 𝑓, (𝐵6)
which can be used to find the velocity at the vent 𝑈! by setting the coefficient on the left-hand side to zero, which yields
𝑈! =
𝑃!
where 𝜌! is given by equation (B5) for 𝑃 = 𝑃!. The pressure at the vent 𝑃! can be calculated by combining equations (B1) and (B7) to get:
𝑃! = 𝑄
𝑆 𝑥!𝑅!𝑇 !/!, (𝐵8) which can be rewritten by using equation (B4) as:
𝑃! = 𝑄𝑥!𝑅!𝑇𝜌!Δ𝜌𝑔 8𝜋𝜇!
!/!
. (𝐵9)
From equations (B4), (B5), (B7), (B9) together with equation (12) one can then calculate 𝑈!, the vertical velocity of the volcanic column after decompression.
References
Alibidirov, M., Dingwell, D.B., 1996. Magma fragmentation by rapid decompression. Nature 380, 146–148.
Aubry, T.J., Jellinek, A.M., Carazzo, G., Gallo, R., Hatcher, K., Dunning, J., 2017a. A new analytical scaling for turbulent wind-bent plumes: Comparison of scaling laws with analog experiments and a new database of eruptive conditions for predicting the height of volcanic plumes. J. Volcanol. Geotherm. Res. 343, 233-251.
Aubry, T.J., Carazzo, G., Jellinek, A. M., 2017b. Turbulent entrainment into volcanic plumes: new constraints from laboratory experiments on buoyant jets rising in a stratified crossflow. Geophys. Res. Lett. 44, https://doi.org/10.1002/2017GL075069.
Balcone-Boissard, H., Boudon, G., Villemant, B., 2010. Textural and geochemical constraints on eruptive style of the 79AD eruption at Vesuvius. Bull. Volcanol. 73, 279-294.
estimates of tephra fall deposits: the importance of particle Reynolds number. J. Volcanol. Geotherm. Res. 81, 173–187.
Bonadonna, C., and Phillips, J. C., 2003. Sedimentation from strong volcanic plumes. J. Geophys. Res. 108 (B7), 2340, doi:10.1029/2002JB002034.
Bouvet de Maisonneuve, C., Bachmann, O., Burgisser, A., 2009. Characterization of juvenile pyroclasts from the Kos Plateau Tuff (Aegean Arc): insights into the eruptive dynamics of a large rhyolitic eruption. Bull. Volcanol. 71, 643–658.
Bursik, M., 2001. Effect of wind on the rise height of volcanic plumes. Geophys. Res. Lett. 28, 3621–3624.
Bursik, M., Woods, A.W., 1996. The dynamics and thermodynamics of large ash flows. Bull. Volcanol. 58, 175-193.
Carazzo, G., Kaminski, E., Tait, S., 2006. The route to self-similarity in turbulent jets and plumes. J. Fluid Mech. 547, 137–148.
Carazzo, G., Kaminski, E., Tait, S., 2008a. On the dynamics of volcanic columns: A comparison of field data with a new model of negatively buoyant jets. J. Volcanol. Geotherm. Res. 178, 94-103.
Carazzo. G., Kaminski, E.,, Tait, S., 2008b. On the rise of turbulent plumes: quantitative effects of variable entrainment for submarine hydrothermal vents, terrestrial and extra terrestrial explosive volcanism. J. Geophys. Res. 113, B09201.
Carazzo, G., Girault, F., Aubry, T., Bouquerel, H., Kaminski, E., 2014. Laboratory experi- ments of forced plumes in a density-stratified crossflow and implications for volcanic plumes. Geophys. Res. Lett. 41, 8759–8766. http://dx.doi.org/10.1002/ 2014GL061887.
Carazzo, G., Kaminski, E., Tait, S., 2015. The timing and intensity of column collapse during explosive volcanic eruptions. Earth Planet. Sci. Lett. 411, 208-217.
Carey, S., Sigurdsson, H., 1987. Temporal variations in column height and magma discharge rate during the 79 A.D. eruption of Vesuvius. Geol. Soc. Amer. Bull. 99, 303–314.
Carey, S., Sigurdsson, H., 1989. The intensity of Plinian eruptions. Bull. Volcanol. 51, 28–40.
Carey, S., Sparks, R.S.J., 1986. Quantitative models of fallout and dispersal of tephra from volcanic eruption columns. Bull. Volcanol. 48, 109-125.
Cioni, R., 2000. Volatile content and degassing processes in the AD 79 magma chamber at Vesuvius (Italy). Contrib. Mineral. Petrol. 140 (1), 40–54.
Cioni, R., Bertagnini, A., Santacroce, R., Andronico, D., 2008. Explosive activity and eruption scenarios at Somma–Vesuvius (Italy): towards a new classification scheme. J. Volcanol. Geotherm. Res. 178(3), 331–346.
Cioni, R., Civetta, L., Marianelli, P., Metrich, N., Santacroce, R., Sbrana, A., 1995. Compositional layering and syn-eruptive mixing of a periodically refilled shallow magma chamber: the AD79 Plinian eruption of Vesuvius. J. Petro. 36 (3), 739–776.
Costa, A., Macedonio, G., Folch, A., 2006. A three-dimensional Eulerian model for transport and deposition of volcanic ashes. Earth Planet. Sci. Lett. 241, 634–647.
Costa, A., Suzuki, Y.J., Cerminara, M., Devenish, B.J., Esposti Ongaro, T., Herzog, M., Van Eaton, A.R., Denby, L.C., Bursik, M., de’ Michieli Vitturi, M., Engwell, S., Barsotti, S., Folch, A., Macedonio, G., Girault, F., Carazzo, G., Tait, S., Kaminski, E., Mastin, L.G., Woodhouse, M.J., Phillips, J.C., Hogg, A.J., Degruyter, W., Bonadonna, C., 2016a. Results of the eruptive column model inter-comparison study. J. Volcanol. Geotherm. Res. 326, 2-25.
Costa, A., Pioli, L., Bonadonna, C., 2016b. Assessing tephra total grain-size distribution: Insights from field data analysis. Earth Planet. Sci. Lett. 443, 90-107.
Degruyter, W., Bonadonna, C., 2013. Impact of wind on the condition for column collapse of volcanic plumes. Earth Planet. Sci. Lett. 377–378, 218–226.
Dunbar, N.W., Kyle, P.R., Wilson, C.J.N., 1989. Evidence from limited zonation in silicic magma systems, Taupo volcanic zone, New Zealand. Geology. 17, 234-236.
Dunbar, N.W., Kyle, P.R., 1993. Lack of volatile gradient in the Taupo plinian-ignimbrite transition: Evidence from melt inclusion analysis. American Mineralogist. 78, 612-618. Ernst, G. G. J., Sparks, R. S. J., Carey, S. N., Bursik, M. I., 1996. Sedimentation from turbulent jets and plumes. J. Geophys. Res. 101, 5575–5589.
Esposti Ongaro, T., Neri, A., Menconi, G., de'Michieli Vitturi, M., Marianelli, P., Cavazzoni, C., Erbacci, G., Baxter, P.J., 2008. Transient 3D numerical simulations of column collapse
and pyroclastic density current scenarios at Vesuvius. J. Volcanol. Geotherm. Res. 326,
103-113.
Formenti, Y., Druitt, T.H., 2003. Vesicle connectivity in pyroclasts and implications for the fluidization of fountain-collapse pyroclastic flows, Montserrat (West Indies). Earth Planet. Sci. Lett. 214, 561–574.
Froggatt, P. C., 1981. Stratigraphy and nature of Taupo Pumice Formation. N.Z. J. Geol. Geophys. 24, 99–105.
Girault, F., Carazzo, G., Tait, S., Ferrucci, F., Kaminski, E., 2014. The effect of total grain-size distribution on the dynamics of turbulent volcanic plumes. Earth Planet. Sci. Lett. 394, 124-134.
Girault, F., Carazzo, G., Tait, S., Kaminski, E., 2016. Combined effects of total grain-size distribution and crosswind on the rise of eruptive volcanic columns, J. Volcanol. Geotherm. Res. 326, 103-113.
Glaze, L.S., Baloga, S.M., 1996. Sensitivity of buoyant plume heights to ambient atmo- spheric conditions: implications for volcanic eruption columns. J. Geophys. Res. 101 (D1), 1529–1540.
Gurioli, L., Houghton, B.F., Cashman, K.V., Cioni, R., 2005. Complex changes in eruption dynamics during the 79 AD eruption of Vesuvius. Bull. Volcanol. 67, 144–159.
Horwell, C.J., Baxter, P.J., 2006. The respiratory health hazards of volcanic ash: a review for volcanic risk mitigation. Bull. Volcanol. 69, 1–24.
Horwell, C.J., 2007. Grain-size analysis of volcanic ash for the rapid assessment of respiratory health hazard. J. Environ. Monit. 9, 1107–1115.
Horwell, C.J., Baxter, P.J., Hillman, S.E., Calkins, J.A., Damby, D.E., Delmelle, P.,
Donaldson, K., Dunster, C., Fubini, B., Kelly, F.J., Le Blond, J.S., Livi, K.J.T., Murphy, F.,
Nattrass, C., Sweeney, S., Tetley, T.D., Thordarson, T., Tomatis, M., 2013. Physicochemical
and toxicological profiling of ash from the 2010 and 2011 eruptions of Eyjafjallajökull and
Grímsvötn volcanoes, Iceland using a rapid respiratory hazard assessment protocol. Environ
Res. 127, 63–73.
Houghton, B.F., Carey, R.J., Rosenberg, M.D., 2014. The 1800a Taupo eruption: “III wind” blows the ultraplinian type event down to Plinian. Geology. 42, 459-461.
Kaminski, E., Jaupart, C., 1998. The size distribution of pyroclasts and the fragmentation sequence in explosive volcanic eruptions. J. Geophys. Res. 103, 29,759–29,779.
pyroclastic flow generation. J. Geophys. Res. 106, 21,785–21,798.
Kaminski, E., Tait, S., Carazzo, G., 2005. Turbulent entrainment in jets with arbitrary buoyancy. J. Fluid Mech. 526, 361–376.
Klug, C., Cashman, K.V., 1996. Permeability development in vesiculating magmas : implications for fragmentation. Bull. Volcanol. 58, 87-100.
Klug, C., Cashman, K., Bacon, C., 2002. Structure and physical characteristics of pumice from the climactic eruption of Mount Mazama (Crater Lake), Oregon. Bull. Volcanol. 64, 486–501.
Kueppers, U., Perugini, D., Dingwell, D.B., 2006. “Explosive energy” during vol- canic eruptions from fractal analysis of pyroclasts. Earth Planet. Sci. Lett. 248, 800–807.
Koyaguchi, T., 2005. An analytical study for 1-dimensional steady flow in volcanic conduits. J. Volcanol. Geotherm. Res. 143, 29-52.
Koyaguchi, T., Suzuki, Y. J., Kozono, T., 2010. Effects of the crater on eruption column dynamics. J. Geophys. Res. 115, B07205.
Lirer, L., Pescatore, T., Booth, B., Walker, G.P.L., 1973. Two Plinian pumice-fall deposits from Somma-Vesuvius, Italy. Geol. Soc. Amer. Bull. 84, 759–772.
Mastin, L. G., 2014. Testing the accuracy of a 1-D volcanic plume model in estimating mass eruption rate. J. Geophys. Res. Atmos. 119, 2474–2495, doi:10.1002/2013JD020604.
Miller, T.P., Casadevall, T.J., 2000. Volcanic ash hazards to aviation. In: Sigurdsson, H.E. (Ed.), Encyclopedia of Volcanoes. Academic Press, San Diego, pp. 915–930.
maintained and instantaneous source. Proc. R. Soc. Lond. 234, 1–23.
Neri, A., Dobran, F., 1994. Influence of eruption parameters on the thermofluid dynamics of collapsing volcanic columns. J. Geophys. Res. 99, 11,833-11,857.
Nguyen, C.T., Gonnermann, H.M., Houghton, B.F., 2014. Explosive to effusive transition during the largest volcanic eruption of the 20th century (Novarupta 1912, Alaska). Geology. 42, 703–706.
Platz, T., Cronin, S.J., Cashman, K.V., Stewart, R.B., Smith, I.E.M., 2007. Transition from effusive to explosive phases in andesite eruptions – a case-study from the AD 1655 eruption of Mt. Taranaki, New Zealand. J. Volcanol. Geotherm. Res. 161, 15–34.
Schmidt, A., Witham, C.S., Theys, N., Richards, N.A.D., Thordarson, T., Szpek, K., Feng, W., Hort, M.C., Woolley, A.M., Jones, A.R., Redington, A.L., Johnson, B.T., Hayward, C.L., Carslaw, K.S., 2014. Assessing hazards to aviation from sulfur dioxide emitted by explosive Icelandic eruptions. J. Geophys. Res. Atmos. 119, 14,180–14,196.
Settle, M., 1978. Volcanic eruption clouds and the thermal power output of explosive eruptions, J. Volcanol. Geoth. Res. 3, 309-324.
Shane, P., 1998. Correlation of rhyolitic pyroclastic eruptive units from the Taupo volcanic zone by Fe-Ti oxide compositional data. Bull. Volcanol. 60, 224-238.
Shea, T., Gurioli, L., Houghton, B.F., 2012. Transitions between fall phases and pyroclastic density currents during the AD79 eruption at Vesuvius: building a transient conduit model from the textural and volatile record. Bull. Volcanol. 74, 2363-2381.
Shea, T., Larsen, J.F., Gurioli, L., Hammer, J.E., Houghton, B.F., Cioni, R., 2009. Leucite crystals: surviving witnesses of magmatic processes preceding the 79 AD eruption at
Vesuvius, Italy. Earth Planet. Sci. Lett. 281, 88–98.
Sigurdsson, H., Cashdollar, S., Sparks, R.S.J., 1982. The eruption of Vesuvius in AD 79: reconstruction from historical and volcanological evidence. Amer. J. Archaeo. 86, 39–51.
Sigurdsson, H., Carey, S., Cornell, W., Pescatore, T., 1985. The eruption of Vesuvius in AD 79. Nat. Geogr. Res. 1, 332–387.
Sigurdsson, H., Cornell, W., Carey, S., 1990. Influence of magma withdrawal on compositional gradients during the AD 79 Vesuvius eruption. Nature. 345, 519–521.
Sparks, R. S. J., Wilson, L., 1976. A model for the formation of ignimbrite by gravitational column collapse. J. Geol. Soc. Lond. 132, 441–451.
Sparks, R.S.J., 1986. The dimensions and dynamics of volcanic eruption columns. Bull. Volcanol. 48, 3–15.
Sparks, R.S.J., Bursik, M., Carey, S., Gilbert, J.S., Glaze, L.S., Sigurdsson, H., Woods, A.W., 1997. Volcanic Plumes. John Wiley, New York, 574 pp.
Spence, R.J.S., Baxter, P.J., Zuccaro, G., 2004. Building vulnerability and human casualty estimation for a pyroclastic flow: a model and its application to Vesuvius. J. Volcanol. Geotherm. Res. 133, 321-343.
Sutherland, W., 1893. The viscosity of gases and molecular forces. Phil. Mag. S. 5, 39, 507-531.
Suzuki, Y.J., Koyaguchi, T., Ogawa, M., Hachisu, I., 2005. A numerical study of turbulent mixing in eruption clouds using a three-dimensional fluid dynamics model. J. Geophys. Res. 110, B08201.
Suzuki, Y. J., Koyaguchi, T., 2013. 3D numerical simulation of volcanic eruption clouds during the 2011 Shinmoe-dake eruptions. Earth Planets Space. 65, 581–589.
Suzuki, Y. J., Koyaguchi, T., 2015. Effects of wind on entrainment efficiency in volcanic plumes. J. Geophy. Res. 120, 6122-6140.
Talbot, J.P., Self, S., Wilson, C.J.N., 1994. Dilute gravity current and rain-flushed ash deposits in the 1.8 ka Hatepe Plinian deposit, Taupo, New Zealand. Bull. Volcanol. 56, 538– 551.
Toramaru, A., 1988. Formation of propagation pattern in two-phase flow systems with application to volcanic eruptions. Geophys. J. 95, 613-623.
Valentine, G.A., Wohletz, K.H., 1989. Numerical models of Plinian eruption columns and pyroclastic flows. J. Geophys. Res. 94, 1867-1887.
Walker, G.P.L., 1980. The Taupo pumice: product of the most powerful known (ultraplinian) eruption. J. Volcanol. Geoth. Res. 8, 69-94.
Walker, G.P.L., 1981. Plinian Eruptions and Their Products. Bull. Volcanol. Vol. 44-2.
Wilson, L., 1976. Explosive volcanic eruptions: III. Plinian eruption columns. J. R. Astron. Soc. 45, 543–556.
Wilson, C. J. N., 1985. The Taupo eruption, New Zealand II. The Taupo ignimbrite. Phil. Trans. R. Soc. Lond. 314 (1529), 199–310.
Wilson, C. J. N., 1993. Stratigraphy, chronology, styles and dynamics of late Quaternary eruptions from Taupo volcano, New Zealand. Phil. Trans. R. Soc. Lond. 343, 205–306. Wilson, L., Sparks, R.S.J., Huang, T.C., Watkins, N.D., 1978. The control of volcanic column heights by eruption energetics and dynamics. J. Geophys. Res. 83 (B4), 1829–1836.