HAL Id: hal-00263872
https://hal.archives-ouvertes.fr/hal-00263872
Preprint submitted on 13 Mar 2008
HAL is a multi-disciplinary open access
archive for the deposit and dissemination of
sci-entific research documents, whether they are
pub-lished or not. The documents may come from
teaching and research institutions in France or
abroad, or from public or private research centers.
L’archive ouverte pluridisciplinaire HAL, est
destinée au dépôt et à la diffusion de documents
scientifiques de niveau recherche, publiés ou non,
émanant des établissements d’enseignement et de
recherche français ou étrangers, des laboratoires
publics ou privés.
New observations of the extended hydrogen exosphere of
the extrasolar planet HD209458b
David Ehrenreich, Alain Lecavelier Des Etangs, Guillaume Hébrard,
Jean-Michel Désert, Alfred Vidal-Madjar, John C. Mcconnell, Christopher D.
Parkinson, Gilda E. Ballester
To cite this version:
David Ehrenreich, Alain Lecavelier Des Etangs, Guillaume Hébrard, Jean-Michel Désert, Alfred
Vidal-Madjar, et al.. New observations of the extended hydrogen exosphere of the extrasolar planet
HD209458b. 2008. �hal-00263872�
hal-00263872, version 1 - 13 Mar 2008
March 13, 2008
New observations of the extended hydrogen exosphere
of the extrasolar planet HD 209458b
⋆
D. Ehrenreich
1, A. Lecavelier des Etangs
2, G. H´ebrard
2, J.-M. D´esert
2, A. Vidal-Madjar
2,
J. C. McConnell
3, C. D. Parkinson
4, and G. E. Ballester
51 Laboratoire d’astrophysique de l’observatoire de Grenoble, Universit´e Joseph Fourier, CNRS (UMR 5571)
BP 53, 38041 Grenoble cedex 9, France
e-mail: david.ehrenreich@obs.ujf-grenoble.fr
2 Institut d’astrophysique de Paris, Universit´e Pierre & Marie Curie, CNRS (UMR 7095)
98 bis, boulevard Arago 75014 Paris, France
3 Department of Earth and Space Science and Engineering, York University
4700 Keele street, Toronto, ON M3J1P3, Canada
4 Department of Atmospheric, Oceanic, and Space Sciences, University of Michigan
2455 Hayward street, Ann Arbor, MI 48109, USA
5 Lunar and Planetary Laboratory, University of Arizona
1040 East 4th street, Tucson, AZ 85721-0077, USA Accepted in Astronomy & Astrophysics.
ABSTRACT
Context.Atomic hydrogen escaping from the planet HD 209458b provides the largest observational signature ever detected for an extrasolar planet atmosphere. However, the Space Telescope Imaging Spectrograph (STIS) used in previous observational studies is no longer available, whereas additional observations are still needed to better constrain the mechanisms subtending the evaporation process, and determine the evaporation state of other ‘hot Jupiters’.
Aims.Here, we aim to detect the extended hydrogen exosphere of HD 209458b with the Advanced Camera for Surveys (ACS) on board the Hubble Space Telescope (HST) and to find evidence for a hydrogen comet-like tail trailing the planet, which size would depend on the escape rate and the amount of ionizing radiation emitted by the star. These observations also provide a benchmark for other transiting planets, in the frame of a comparative study of the evaporation state of close-in giant planets.
Methods.Eight HST orbits are used to observe two transits of HD 209458b. Transit light curves are obtained by performing photom-etry of the unresolved stellar Lyman-α (Lyα) emission line during both transits. Absorption signatures of exospheric hydrogen during the transit are compared to light curve models predicting a hydrogen tail.
Results.Transit depths of (9.6±7.0)% and (5.3±10.0)% are measured on the whole Lyα line in visits 1 and 2, respectively. Averaging
data from both visits, we find an absorption depth of (8.0 ± 5.7)%, in good agreement with previous studies.
Conclusions.The extended size of the exosphere confirms that the planet is likely loosing hydrogen to space. Yet, the photometric precision achieved does not allow us to better constrain the hydrogen mass loss rate.
Key words.Stars: individual: HD 209458 – Planets and satellites: general – Ultraviolet: stars
1. Introduction
Extrasolar planets transiting their parent stars represent ∼ 10% of the total number of planets detected so far in the solar neigh-borhood (Schneider 2008). Planetary transits are rare and pre-cious indeed, since they are powerful tools to extract key phys-ical properties of planets, like their mean densities, chemphys-ical compositions, or atmospheric structures. In fact, during a tran-sit, the stellar light is partially filtered by the planetary atmo-sphere before reaching the observer, who can thus probe the atmospheric limb structure and composition with a differential spectroscopic analysis.
While detailed models of extrasolar planet transmission spectroscopy have been flourishing (see, e.g., Seager & Sasselov 2000; Brown 2001; Hubbard et al. 2001; Ehrenreich et al. 2006; Tinetti et al. 2007), few detections of atmospheric signatures
Send offprint requests to: D. Ehrenreich
⋆ Based on observations made with the Advanced Camera for Surveys on board the Hubble Space Telescope.
have been reported. Most studies have been focused on the giant ‘hot-Jupiter’ HD 209458b, the first extrasolar planet to be observed in transit (Charbonneau et al. 2000; Henry et al. 2000). Atomic species have been evidenced through the sup-plementary absorption they are triggering at key wavelengths. Sodium (Na D λ539 nm) in the lower atmosphere of the planet gives rise to a ∼ 10−4 extra-absorption (Charbonneau et al.
2002). Hot hydrogen (H ∗) in the middle atmosphere provides
a ∼ 10−4 absorption around the Balmer jump (Ballester et al. 2007). Compared to these rather tenuous signals, the ∼ 10% ab-sorption signatures of hydrogen (H λ121.6 nm), carbon (C
λ133.5 nm), and oxygen (O λ130.2 nm) detected by Vidal-Madjar et al. (2003, 2004) seem huge. In fact, those elements are seen in the extended upper atmosphere of the planet, the ex-osphere.
The proximity of HD 209458b to its star (0.045 astronomical units) makes the gaseous planet receiving a colossal amount of extreme ultraviolet (EUV) irradiation. Such an energetic input heats the hydrogen upper atmosphere to ∼ 104K and inflates it
2 D. Ehrenreich et al.: Observations of HD 209458b hydrogen exosphere
to the Roche limit: the atmosphere is evaporating and its spatial extent produces the large absorption observed in the Lyman-α (Lyα) stellar emission line (Vidal-Madjar et al. 2003). Elements heavier than hydrogen (C and O ) are transported upward by the hydrodynamic flow of escaping H atoms and consequently also give rise to significantly large absorptions (Vidal-Madjar et al. 2004). The evaporation process of the upper atmosphere has a solid theoretical ground on which models (Lecavelier des Etangs et al. 2004; Yelle 2004; Tian et al. 2005; Garc´ıa-Mu ˜noz 2007; Lecavelier des Etangs 2007; Penz et al. 2007) are estimating the escape rate ˙M of hydrogen and comparing it to observational
constraints. So far, theoretical and observational estimations of ˙
M for HD 209458b are converging (Yelle 2006).
Yet, important questions remain. Is there a hydrogen comet-like tail trailing the planet? Is the size of this cloud fluctu-ating depending on the stellar activity and variations in the flux of ionizing EUV radiation? What is the evaporation state of other close-in planets? In fact, observational insights from other systems would significantly constrain and refine the mod-eling of the evaporation process in a more general frame. However, previous observations were accomplished with the Space Telescope Imaging Spectrograph (STIS) on board the
Hubble Space Telescope (HST). The failure of STIS in August
2004 prevented the achievement of additional observations of exoplanets transiting bright stars like HD 209458, HD 189733, or HD 149026.
In addition, Ben-Jaffel (2007) recently challenged the inter-pretation of Vidal-Madjar et al. (2003) concerning the evapo-ration of HD 209458b, on the basis of a new analysis of the archival STIS data set. Although the apparent disagreement between those authors has been clarified (Vidal-Madjar et al. 2008), new observations of HD 209458b are required to provide (i) additional observational ground to the evaporation process and (ii) a benchmark observation in the frame of a comparative study of the evaporation state of hot-Jupiters.
These observations were performed with the Advanced Camera for Surveys (ACS; Ford et al. 2003) on board HST; this article describes their analysis.
2. Observations of HD 209458
The observing program was originally designed to observe HD 209458b with HST/STIS. After STIS failure, it has been pos-sible to execute the program with HST/ACS during Cycle 13. The program (GO#10145) consists in 3+2 visits, performed with the ACS/High Resolution Camera (HRC) and the ACS/Solar Blind Camera (SBC), respectively. The first 3 visits, aimed at characterizing the near-ultraviolet transmission spectrum of the planet, are under on going analysis (D´esert et al., in preparation). We focus here on the last 2 visits, designed for a new observation of the evaporating hydrogen envelope at Lyα.
To this purpose, HD 209458b was observed with the
HST/ACS/SBC on 2006 May 14 (visit 1) and 2006 May 31
(visit 2). Eight HST orbits in total were used for the following phase coverage of the transit light curve: 3 HST orbits were ob-tained before 1st contact, 4 orbits between 1st and 4th contacts, and 1 orbit after 4th contact. Each HST orbit consists in 8 expo-sures: a direct image of the star is first made with the F115LP fil-ter; 6 exposures are then acquired in slitless spectroscopy mode with the PR110L prism; another direct image is finally taken with the F115LP filter.
The data reduction described below makes use of the stan-dard calibration (flat-fielded and dark-subtracted) products of the ACS pipeline.
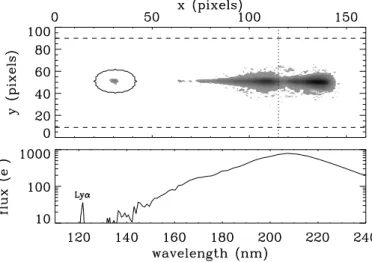
Fig. 1. Median spectrum of HD 209458b. The image in the
up-per panel is the median of all co-aligned prism exposures. The dispersion direction is close to the detector x-axis. The spectrum is unresolved along the y-axis. The background is estimated in upper and lower part of the image (above and below the dashed lines). A circular aperture of 10 pixels in radius in represented around the Lyα emission line. The image is stacked along the
y-axis to produce the spectrum plotted in the lower panel. The
spectrum spans roughly from Lyα to the dotted line in the image at 240 nm, just after the continuum peak. The bright structure redward to the continuum is an artifact due to the decrease of the resolution, the ‘red pile-up’
3. Methods
Slitless spectroscopy yields spectral images similar to that rep-resented in Fig. 1. The direction of spectral dispersion is given by the spectral trace, which can be linearly approximated for SBC data and make with the detector x-axis an angle of ∼ 0.5◦.
The spectral image has three remarkable structures (from short to long wavelengths): the Lyα stellar emission line, the stellar continuum between 160 and 200 nm, and the ‘red pile-up’. This last feature is an artifact resulting from the built up of pho-tons on a few detector pixels, as the spectral resolution signif-icantly diminishes toward the red. In fact, the spectral resolution of the SBC/PR110L prism is λ/∆λ ∼ 250 at Lyα (2 pixels at 0.25 nm pix−1), comparable to the resolution of Vidal-Madjar et al. ’s (2004) observations; it is ∼ 40 (2 pixels at 2.5 nm pix−1) at
180 nm, and becomes ∼ 10 at 330 nm (2 pixels at 15 nm pix−1). Since the stellar continuum is very low in the ultraviolet – typically lower than the background level –, it is convenient to perform aperture photometry on the unresolved Lyα emission line. In fact, this allows us to make a more direct use of the spec-tral images provided by the prism, aperture photometry provid-ing the total flux in the Lyα line at a given time. Since the Lyα line is unresolved, no spectral information can be extracted from these data.
The SBC detector is a multi-anode microchannel array (MAMA), i.e., a photon-counting device. Hence, the flux at Lyα is calculated for each image by summing the pixels within a cir-cular aperture of 10 pixels in radius (represented in Fig. 1). We checked that the obtained results do not significantly depend on the size of the photometric aperture for aperture radii chosen between 5 and 20 pixels. Errors on the measured fluxes are cal-culated from the tabulated error on each pixel in the aperture. Images are previously co-aligned with a reference exposure; the
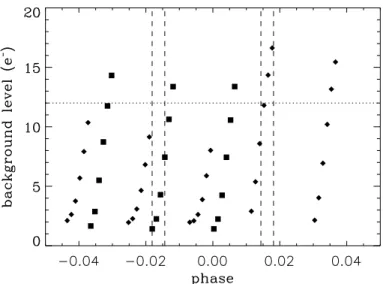
Fig. 2. Background level in individual exposures of visit 1 (filled
diamonds) and 2 (filled squares). The median level of the Lyα emission peak is indicated by the dotted line. Dashed lines rep-resent the four contacts of the transit.
offsets between the spectra in two different images are deter-mined by performing a cross-correlation in Fourier space.
To estimate the background brightness, we used the 2D im-ages (see Fig. 1). On these imim-ages, we defined two bands above and below the spectrum along the detector x-axis. These bands are 10 pixel-wide in the y-direction. For each image at a given position x, the background is calculated as the average of the measurements in the bands at the same x position. Since the
x-axis is close to the dispersion direction, these estimations
should therefore contain any wavelength-dependent structure of the background. The background is fitted along the detector x-axis by a 4th-degree polynomial, which is then subtracted to each pixel row of the detector image.
The mean values of the background fits (averaged on the de-tector x-axis) are represented as a function of the orbital phase in Fig. 2. A clear rise of the background is seen along each or-bit: it is due to the increase of the geocoronal Lyα line as the spacecraft moves toward the day side of its orbit. This effect is most severe in the last two orbits of visit 1 and all three orbits of visit 2, where the background level during the last exposures reaches the level of Lyα brightness in the photometric aperture. The peak of the Lyα emission line and is estimated to ∼ 12 pho-toelectrons (e−) from the median spectrum of Fig. 1.
Note that the absence of a dispersing slit makes the geocoro-nal Lyα emission contributing to the flux measured on every pix-els of the detector. Therefore, the airglow contamination can be corrected for by performing the background subtraction. These exposures where the signal is overwhelmed by the geocoronal emission (see Fig. 2) are discarded from the photometric time series.
The two time series obtained for visits 1 and 2 are phase-folded, using the ephemeris derived by Wittenmyer et al. (2005), to yield two transit light curves containing 26 and 15 points, respectively. The curves are plotted in upper and middle pan-els of Fig. 3, where each point represent the weighted mean of all individual exposures within a given HST orbit. We fit to all sub-exposures from each time series a simple trapezoidal tran-sit curve, where the geometry, i.e., the impact parameter and the transit, ingress, and outgress durations, are obtained from accu-rate photometry of the transit light curve in the optical (Knutson et al. 2007). The transit depth and the out-of-transit baseline
level are free to vary to fit the data. Values for these free pa-rameters are then obtained by minimizing a χ2.
4. Results
4.1. The size of the extended exosphere: comparison with previous measurements
In the first transit (visit 1), we obtain a χ2 of 22.5 for n = 24
degrees of freedom, or a χ2/n ≈ 0.94 and measure a dip of
(9.6 ± 7.0)% for an out-of-transit baseline level of 301 ± 13 e−.
The fit to the second transit (visit 2) gives a χ2/
n = 16.5/13 ≈
1.3, an absorption depth of (5.3 ± 10.0)%, consistant with visit 1, and a baseline level of 281 ± 19 e−. Note that the measured
er-rors in the determination of the out-of-transit baseline levels are very close to the theoretical errors expected for a photon-noise-limited signal.
The out-of-transit baseline levels are then used to normal-ize the respective time series (lower panel of Fig. 3). We finally repeat the above described fitting procedure on normalized time series to obtain a transit depth while considering data points from both visits together. We obtain a depth of (8.0 ± 5.7)%, in good agreement with individual time series. This last global fit ini-tially yielded a χ2/
n = 67.6/40 ≈ 1.7, meaning that the
propa-gated errors underestimate the actual dispersion of the photom-etry, by a factor of √1.7 ≈ 1.3. The error bars of individual ex-posures were thus scaled larger by a factor of 1.3 to reflect their true dispersion, and so that the value of χ2/n for the global fit is
close to 1. This is a conservative approach for the final quoted error bars.
The transit depth in the visible is ∼ 1.6% (Brown et al. 2001). The observed difference between visible and Lyα measurements is indicative of an additional absorption centered around the Lyα emission line. The measured absorption is compatible with the (5 ±2)% measured by Vidal-Madjar et al. (2004) at an equivalent resolution with HST/STIS. As discussed in Vidal-Madjar et al. (2008), such a result obtained by measuring the absorption on the whole unresolved Lyα line, is in agreement with other mea-surements made at a higher resolution. In fact, Vidal-Madjar et al. (2003) measured a transit depth of (15 ± 4)% on ∼ 1/3 of the line, while Ben-Jaffel (2007) reported an absorption of (9 ± 2)% over ∼ 1/2 of the line.
The absorption of the stellar flux during the transit is ap-proximately equal to the ratio of the planetary to stellar sur-faces, (Rp/R⋆)2. An absorption of (8.0 ± 5.7)% thus corresponds
to the passage of a spherical hydrogen cloud of radius RH ≈
(0.28±0.1) R⋆, where R⋆= 1.12 R⊙is the stellar radius (Knutson
et al. 2007). It gives RH= (3.1 ± 1.1) Jovian radii (RJ), i.e., much
larger than the planetary radius of Rp = (1.32 ± 0.02) RJ
mea-sured in the optical by Knutson et al. (2007).
The size of the inflated hydrogen envelope can also be com-pared to the size of the planet Roche lobe to determine whether the atmosphere is evaporating. The Roche lobe is not spherical but rather elongated in the star-planet direction (Lecavelier des Etangs 2004). In the observational configuration of a transit, the Roche limit of relevance should be taken perpendicular to the star-planet axis; in this case RRoche ≈ 0.33 R⋆ or 3.7 RJ (see
Vidal-Madjar et al. 2003, 2008). Considering the size RHof the
hydrogen exosphere and its 1-σ uncertainty, it is possible that the exosphere reach and exceed the Roche limit.
In fact, we recall that the absorption is measured over the whole Lyα line. Measuring it over the line core, which would be permitted with a higher spectral resolution, would give a larger absorption (Vidal-Madjar et al. 2008), corresponding to
4 D. Ehrenreich et al.: Observations of HD 209458b hydrogen exosphere
a hydrogen envelope extended well beyond the Roche limit. In other words, the velocity of hydrogen atoms responsible for the absorption must largely exceed the planet escape velocity of
∼ 54 km s−1 (at the level of the dense atmosphere, far below
the exosphere). Vidal-Madjar et al. (2003) reported an absorp-tion in the resolved Lyα line ranging from −130 to +100 km s−1.
Their observed (15±4)% absorption over this velocity range cor-responds to about (5.7 ± 1.5)% absorption of the total Lyα line intensity (Vidal-Madjar et al. 2004). The (8.0 ± 5.7)% absorp-tion of the total Lyα line intensity from the present ACS data set could thus even be compatible with hydrogen atoms velocities larger than ∼ 200 km s−1.
Because of the observed absorption over the unresolved Lyα line, and from these independent observations only, the hydro-gen upper atmosphere must either extend beyond the Roche lobe (if the absorption occurs within the narrow core of the Lyα line), or the atoms velocities must exceed the escape velocity (if the absorption occurs over the whole line or over a broad veloc-ity range of about ±200 km s−1). Since the atmospheric escape
takes place in both cases, the present result is a new indepen-dent confirmation of the presence of an extended hydrogen ex-osphere around HD 209458b, first observed and confirmed by Vidal-Madjar et al. (2003, 2004), which strengthens the atmo-spheric escape scenario.
4.2. The hydrogen tail: comparison with models
The spectral resolution of data analyzed in the present study does not allow us to constrain the velocity of the observed hydro-gen and compare it to the escape velocity, as done by Vidal-Madjar et al. (2003). A clear signature of hydrogen escaping from the planet gravity would be the observation of an escap-ing hydrogen ‘cometary-like’ tail. Materials expelled from the planet in the observer’s direction by effects such as the stellar radiation pressure are seen projected on the plan perpendicu-lar to the line of sight. Because of the almost circuperpendicu-lar revolu-tion of the planet, the gas tail would hence appear trailing the planet orbit (Rauer et al. 2000; Moutou et al. 2001). Recent pre-dictions of the observational signature of the evaporation tail were provided by Schneiter et al. (2007). They assumed that the planet blows an isotropic neutral hydrogen wind at the escape velocity, with a mass loss rate set as a free parameter. Escaping atomic H atoms are submitted to gravitational forces from the star and the planet, and interact with the impinging ionized stel-lar wind. The interaction with the stelstel-lar wind, emitted from the star at a rate of 5.7 × 10¹² g s−1, carves the escaping
atmo-sphere into a comet-like tail (see their Fig. 1). When transiting the star following the planet itself, this tail produces a transit light curve which shape is changing depending on the assumed mass loss rate ˙M of the planet. A simulated light curve with
˙
M = 1.6×10⁻¹⁶M⊙yr−1= 1×10¹⁰g s−1(model M2 in Schneiter et al. 2007), obtained by integrating the flux between -320 and 200 km s−1around the center of the Lyα line, i.e., on the whole line, is plotted over our data points in Fig. 3.
A similar evaporation tail is obtained in simulations per-formed within our team, and which were used in previous studies (Vidal-Madjar et al. 2003). These simulations include the effect of gravity, stellar radiation pressure – which shapes the evapo-ration cloud into a comet-like tail –, and stellar EUV ionizing flux – which limits the lifetime of H atoms escaping from the planet (Lecavelier des Etangs, in preparation). The simulated absorption in the light curve was computed for ˙M = 1 × 10⁹, 1 × 10¹⁰
, and 3 × 10¹⁰g s−1assuming a low spectral resolution,
on the whole unresolved line, as this is the case for data treated
by Vidal-Madjar et al. (2004) and in the present work. The value of the ionizing stellar EUV flux in these simulations was set to the solar value.
Resulting light curves are plotted in Fig. 3 (lower panel). The simulated absorptions over the unresolved Lyα line fit our mea-surements correctly; however, the precision achieved in the data set does not allow us to put strong constraints on ˙M. Indeed,
the presence of an evaporation tail is mainly constrained by data from the last HST orbit of visit 1. While models of an evapo-ration tail ionized by stellar EUV radiation are all compatible with our measurement within 1σ, the model of Schneiter et al. (2007) seems to overestimate the absorption of the hydrogen tail by >∼ 8% after 4th contact. We suggest that this might be caused either by the width of the spectral interval chosen to integrate the Lyα absorption, which is barely covering the whole line, or by the value of the stellar wind mass loss rate assumed by these authors.
In addition, Schneiter et al.’s model do not include photoion-ization, that would decrease the length of the neutral hydrogen tail. Furthermore, none of the models presented here are consid-ering charge exchanges with stellar wind protons which might occur in the exosphere of the planet and which effect would be to lower the escape rate needed to account for the absorption ob-served (Holmstr¨om et al. 2008). In fact, Holmstr¨om et al. (2008) show that this last mechanism could produce ∼ 10% of the es-cape rate evaluated considering the stellar radiation pressure and gravity (Lecavelier des Etangs et al. 2004). However, because both the stellar radiation pressure and gravity field cannot be ne-glected in the present situation, the charge exchange process pro-posed by Holmstr¨om et al. is an additional effect rather than an alternative scenario. Hence, it could only enhance the escape rate above the original value evaluated by Vidal-Madjar et al. (2003). Nonetheless, looking back to our ACS data, more exposures obtained after 4th contact would be needed in order to test the presence of the hydrogen tail, better constrain ˙M for a given
stel-lar EUV flux, and precise the physical processes contributing to the observed absorption.
5. Conclusions
We observed two transits of the extrasolar planet HD 209458b in the stellar Lyα emission line with HST/ACS. Absorption depths of (9.6 ± 7.0)% and (5.3 ± 10.0)% were measured some 15-days apart. No significative evidence for a variability in the size of the hydrogen exosphere can be determined from these data.
The extended size of the exosphere is nevertheless confirmed and the absorption obtained by fitting data from both transits,
∆F/F = (8.0 ± 5.7)%, is in agreement with previous
measure-ments at similar spectral resolution (Vidal-Madjar et al. 2004). Because of the observed absorption over the unresolved Lyα line, the hydrogen upper atmosphere must extend beyond the Roche lobe, or equivalently the velocity of hydrogen atoms must largely exceed the escape velocity (i.e., the Lyα line is larger than ∼ 200 km s−1).
This study is limited by the low accuracy of photometry con-strained by photon noise. The rise of the sky background during each orbit of the spacecraft, due to the increasing contribution of the geocoronal Lyα emission, is an intrinsic problem of slit-less spectroscopy. Higher resolution and more sensitive slit spec-troscopy, associated with a better phase coverage of the transit
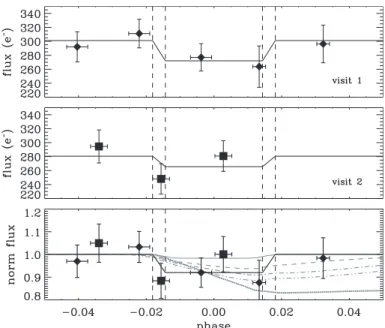
Fig. 3. Light curves obtained during visits 1 (filled diamonds,
up-per panel) and 2 (filled squares, middle panel). Each data point is the weighted mean of values gathered during one HST orbit. The phase coverage of each HST orbit is represented by an hori-zontal error bar. Trapezoidal transit curves are fitted to each time series (plain lines). Contacts are spotted by vertical dashed lines. Each time series is normalized by the out-of-transit flux of its best fit. Resulting values are plotted in lower panel and fitted together with a trapezoidal transit curve (thick black line). The transit depth seen in the visible is indicated for comparison (thin grey line). Predicted light curves of the transit of a hydrogen tail at low spectral resolution produced by two different modeling approaches are also represented in lower panel: (i) assuming the evaporation tail is ionized by the stellar EUV flux (Lecavelier des Etangs, in preparation), for ˙M = 1 × 10⁹g s−1(dashed line),
˙
M = 1 × 10¹⁰g s−1(dash-dotted line), and ˙M = 3 × 10¹⁰ g s−1
(dash-dot-dotted line); (ii) assuming the evaporation tail inter-acts with the ionized stellar wind (Schneiter et al. 2007), for
˙
M = 1 × 10¹⁰g s−1(dotted line).
aftermath, are needed to detect deneb-el-Osiris1, the hydrogen
tail expected by evaporation models.
While studies of the evaporation in other extrasolar planet, like HD 189733b, is still going on with the HST/ACS, high hopes are placed on the repair of STIS and the installation of the Cosmic Origin Spectrograph (COS) during HST Servicing Mission 4.
Acknowledgements. We thank Jeremy Walsh for his help with the
schedul-ing of the ACS observations, Jeffrey Linsky for his promptness to review the manuscript, and Roger Ferlet and Michel Mayor for their support. This work is based on observations made with the Advanced Camera for Surveys on board the NASA/ESA Hubble Space Telescope, obtained at the Space Telescope Science Institute, which is operated by the Association of Universities for Research in Astronomy, Inc., under NASA contract NAS 5-26555. These observations are associated with program #10145. DE acknowledges support of the ANR ‘Exoplanet Horizon 2009’.
References
Ballester, G. E., Sing, D. K., & Herbert, F. 2007, Nature, 445, 511 Ben-Jaffel, L. 2007, ApJ, 671, L61
1 The tail (deneb in Arab) of the planet Osiris, the nickname of
HD 209458b.
Brown, T. M. 2001, ApJ, 553, 1006
Brown, T. M., Charbonneau, D., Gilliland, R. L., Noyes, R. W., & Burrows, A. 2001, ApJ, 552, 699
Charbonneau, D., Brown, T. M., Latham, D., & Mayor, M. 2000, ApJ, 529, L45 Charbonneau, D., Brown, T. M., Noyes, R. W., & Gilliland, R. L. 2002, ApJ,
568, 377
Ehrenreich, D., Tinetti, G., Lecavelier des Etangs, A., Vidal-Madjar, A., & Selsis, F. 2006, A&A, 448, 379
Ford, H. C., Clampin, M., Hartig, G. F., et al. 2003, SPIE, 4854, 81 Garc´ıa-Mu˜noz, A. 2007, Planet. Space Sci., 55, 1426
Henry, G. W., Marcy, G. W., Butler, R. P., & Vogt, S. S. 2000, ApJ, 529, L41 Holmstr¨om, M., Ekenb¨ack, A., Selsis, F., et al. 2008, Nature, 451, 970 Hubbard, W. B., Fortney, J. J., Lunine, J. I., et al. 2001, ApJ, 560, 413 Knutson, H. A., Charbonneau, D., Noyes, R. W., Brown, T. M., & Gilliland, R. L.
2007, ApJ, 655, 564
Lecavelier des Etangs, A., Vidal-Madjar, A., McConnell, J. C., & H´ebrard, G. 2004, A&A, 418, 1
Lecavelier des Etangs, A. 2007, A&A, 461, 1185
Moutou, C., Coustenis, A., Schneider, J., et al. 2001, A&A, 371, 260 Penz, T., Micela, G., & Lammer, H. 2007, A&A, accepted (arXiv:0710.3534) Rauer, H., Bockel´ee-Morvan, D., Coustenis, A., Guillot, T., & Schneider, J.
2000, A&A, 355, 573
Schneider, J. 2008, The Extrasolar Planets Encyclopædia,
http://exoplanet.eu
Schneiter, E. M., Vel´azquez, P. F., Esquivel, A., Raga, A. C., & Blanco-Cano, X. 2007, ApJ, 671, L57
Seager, S. & Sasselov, D. D. 2000, ApJ, 537, 916
Tian, F., Toon, O. B., Pavlov, A. A., & De Sterck, H. 2005, ApJ, 621, 1049 Tinetti, G., Liang, M.-C., Vidal-Madjar, A., et al. 2007, ApJ, 654, L99 Vidal-Madjar, A., Lecavelier des Etangs, A., D´esert, J.-M., et al. 2003, Nature,
422, 143
Vidal-Madjar, A., D´esert, J.-M., Lecavelier des Etangs, A., et al. 2004, ApJ, 604, L69
Vidal-Madjar, A., Lecavelier des Etangs, A., D´esert, J.-M., et al. 2008, ApJ, 676, L57
Wittenmyer, R. A., Welsh, W. F., Orosz, J. A., et al. 2005, A&A, 632, 1157 Yelle, R. V. 2004, Icarus, 170, 167