A Design and Implementation of an Efficient,
Parallel Watershed Algorithm for Affinity Graphs
by
Aleksandar Zlateski
Submitted to the Department of Electrical Engineering and Computer
Science
in partial fulfillment of the requirements for the degree of
Master of Engineering in Computer Science and Engineering
at the
MASSACHUSETTS INSTITUTE OF TECHNOLOGY
February 2011
ARCHNES
MASSACHUSETTS INSTITUTE OF TECHN*OLOG-iYJUN 2
1
2011
LIBRARIJES
@ Massachusetts Institute of Technology 2011. All rights reserved.
Author...
...
I...
...
De.partment of Electrical Engineering and Computer Science
February 1, 2011
C ertified
by
...
.
.
... ...
H. Sebastian Seung
Professor
Thesis Supervisor
Accepted by ...
...
Christopher
..
T
.
A Design and Implementation of an Efficient, Parallel
Watershed Algorithm for Affinity Graphs
by
Aleksandar Zlateski
Submitted to the Department of Electrical Engineering and Computer Science on February 1, 2011, in partial fulfillment of the
requirements for the degree of
Master of Engineering in Computer Science and Engineering
Abstract
In this thesis, I designed and implemented an efficient, parallel, generalized watershed algorithm for hierarchical segmentation of affinity graphs. By introducing four vari-able parameters the algorithm envari-ables us to use previous knowledge about the input graph in order to achieve better results. The algorithm is very suitable for hierarchi-cal segmentintation of large shierarchi-cale 3D images of the brain tissue obtained by electron microscopy making it an essential tool for reconstructing the brain's neural-networks called connectomes. The algorithm was fully implemented in C++ and tested on a currently largest available affinity graph of size 90GB on which no existent watershed implementation could be applied.
Thesis Supervisor: H. Sebastian Seung Title: Associate Professor
Acknowledgments
e I would like to thank my supervisor Sebastian Seung for giving me the oppor-tunity to work on such an interesting and challenging project.
" I would also like to thank Srinivas Turaga for help, suggestions and valuable
feedback.
" I must also thank Michael Purcaro for help and support with OMNI integration.
" Uygar, Ignacio, Daniel, Matt and everyone else in the Seung lab, thanks for
being great labmates!
e Finally I want to thank my parents, my sister and my wife Julia for their love and support.
Contents
1 Introduction
1.1 Generating Connectomes . . . . 1.2 Motivations for Scalable Parallel Watershed Algorithm
1.3 Related W ork . . . . 1.4 Thesis Outline . . . . 2 Serial Watershed Algorithm
2.1 Basic Notions and Notations . . . . 2.1.1 G raphs . . . . 2.1.2 Affinity W eights . . . .
2.1.3 Labels and Segmentations . . . . 2.1.4 Region Graph and Segmentation Hierarchy . .
2.2 Additional Constraints . . . . 2.2.1 High Threshold Th . . . . 2.2.2 Low Threshold T, . . . . 2.2.3 Size Thresholds T, and Te . . . ..
2.3 The Watershed Algorithm . . . .
2.3.1 The Four Watershed Steps . . . .
2.3.2 The Watershed Procedure . . . . 2.4 Correctness and Running Time Analysis . . . .
3 Watershed Algorithm on Very Large Affinity Graphs
. . . . 2 5 11 . * 11 . . . . . 12 . . . . . 13 . . . . . 13 15 . . . . 15 . . . . 16 . . . . 16 . . . . 16 . . . .. 16 . . . . 17 . . . - 17 . . . . 18 . . . . 18 . . . . 18 . . . . 20 . . . . 23 . . . . 23 25
3.2 Cache Performance . . . .2
4 Parallel Watershed Algorithm 27 4.1 On Non-Maxima Plateaus . . . . 27
4.2 Algorithm Overview ... . . . .. 28
4.3 Modified Local Watershed . . . . 28
4.4 Merging Local Watersheds . . . . 29
4.5 Running Time and Space Analysis... . . . . . . . 30
5 Results 31 5.1 Serial Watershed . . . . 31 5.2 Parallel Watershed . . . . 32 5.2.1 In Memory . . . . 32 5.2.2 On Disk... . . . . . . . . 33 5.3 Segmentation Results.. . . . . . . . 34 A Implementation Details 37 A.1 The zi Library . . . . 37
A.1.1 Concurrency.. . . . . . . . . . 37
A.1.2 Parallel . . . . 38
A.1.3 Disjoint Sets . . . . 38
A.1.4 Heap . . . . 38 A.1.5 Cache . . . . 38 A.1.6 System . . . . 39 A.1.7 Time . . . . 39 A.1.8 Graph . . . . 39 B Figures 41 . . . . 26
List of Figures
1-1 Segmentation of brain tissue . . . . 12
4-1 Dividing the aflinity graph with one overlapping edge . . . . 28
5-1 Measured running time of the serial watershed algorithm . . . . 31
5-2 Measured running time of the in-memory parallel watershed algorithm 32 5-3 Measured Running Time of the On-Disk Parallel Watershed Algorithm 33 5-4 Measured running time of the on-disk parallel watershed algorithm using 4 threads . . . . 34
5-5 Visualization of watershed segmentation on a 20003 volume . . . . 35
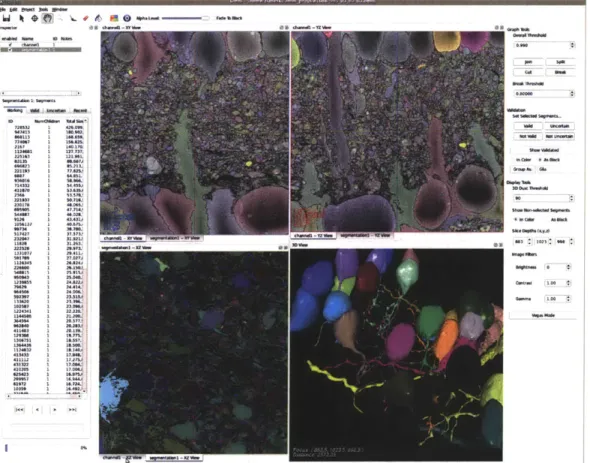
B-1 OM NI user interface . . . . 41
Chapter 1
Introduction
The human brain is estimated to contain more than 100 billion neurons. To fully understand the function of neurons and the brain development neuroscientists work on creating the wiring diagram of the brain - map of all neural connections. Recent advances in neural imaging developed at Harvard, and the Max Plank Institute for Medical Research in Heidelberg, Germany has enabled neuroscientists to gather vi-sual data of the brain tissue at previously unobtainable dimensions. Image processing and machine learning algorithms being developed at Massachusetts Institute of Tech-nology instructs the computer to automatically generate and analyze connectivity
networks.
A tool visually developed at Seung lab at MIT enables humans to inspect and
analyze the resulting networks in 3D as well as fix any possible errors made by the computer.
1.1
Generating Connectomes
Generating neural connectivity networks from raw images of brain tissue is done in three steps. In the first step convolutional networks described by S. Turaga et al. [12] are used to create an affinity graph directly from raw EM' images. In the second step a watershed transform is applied on the obtained affinity graphs to obtain
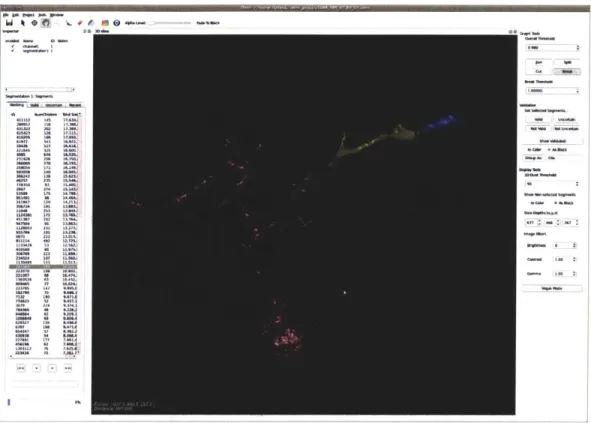
a hierarchical segmentation. This thesis describes an algorithm for a generalized watershed transform that is used as the second step. Finally in the third step the hierarchical transformation is examined by humans using a tool called OMNI [14, 10] and all the errors made by the computer are manually fixed. The Figure 1-1 (a) shows a raw image, Figure 1-1 (b) shows a hierarchical segmentation overlayed over the raw image. A 3D view of the final segmentation is shown on Figure 1-1 (c). The OMNI user interface is shown on Figure B-1. A screen shot of editing a hierarchical segmentation using OMNI is shown on Figure B-2
(a) (b) (c)
Figure 1-1: Segmentation of brain tissue
1.2
Motivations for Scalable Parallel Watershed
Algorithm
The watershed transform is the method of choice for hierarchical image segmentation. The intuitive idea underlying this method comes from geography: it is that of a landscape or topographic relief which is flooded by water, watersheds being the divide lines of the domains of attraction of rain falling over the region [9].
Many serial and parallel algorithms for the watershed transform of images and affinity graph have been developed in past. However applying any of currently avail-able algorithms on large data is either inefficient or impossible.
Applying the standard watershed transform on the affinity graphs obtained from neural images might not give satisfactory results. In this thesis we propose a
general-ized watershed transform algorithm that is able to handle an arbitrary large affinity
graphs and provides flexibility for obtaining good segmentation of neural images.
1.3
Related Work
In order to compute the watershed of a digital image or an affinity graph, several
approaches [1, 13, 5, 6, 7, 2, 3), have been proposed. Many of them consider a
gray-scale digital image as an affinity graph. One of the most popular approaches that
can be directly applied to affinity graphs consists of simulating a flooding of the
topographic surface from its regional minima
[13,
5]. We generalize and extend the
algorithm described by J. Cousty, G. Bertrand, L. Najman, and M, Couprie [3] in
order to support processing arbitrary large data.
1.4
Thesis Outline
The thesis proposes a design of an efficient, parallel watershed algorithm for affinity
graphs. It generalizes the standard watershed transform by introducing a set of
vari-able parameters. A serial watershed algorithm is presented in Chapter 2. Chapter 3
proposes a way to efficiently use the serial algorithm for very large affinity graphs.
The parallel watershed algorithm is proposed and analyzed in Chapter 4. Chapter 5
provides some result of both the serial and the distributed watershed algorithms.
Chapter 2
Serial Watershed Algorithm
This chapter provides a detailed description of a modified watershed algorithm and a serial implementation based on watershed cuts described by J. Cousty, G. Bertrand, L. Najman, and M, Couprie [3]. Section 2.1 details the notions and notations we use in the rest of the thesis. Section 2.2 introduces a set of paramaterized constraints that generalize the standard watershed transform. The user-defined parameters enable us to use the knowledge about the input in order to achieve better results. Our watershed algorithm is discussed in Section 2.3. Finally, Section 2.4 provides a proof of correctness and an analysis of the running time.
2.1
Basic Notions and Notations
This thesis is settled in the framework of undirected affinity graphs'. Following standard notations, we present some basic definitions to handle such kind of graphs. The standard watershed transform of an affinity graph consists of a segmentation with its segmentation hierarchy. Our algorithm also provides the region graph of the segmentation.
'We designed the watershed algorithm keeping in mind a 6-connected affinity graph of a 3D volume. However the described algorithm can be applied to an affinity graph of an arbitrary topology.
2.1.1
Graphs
We define a graph as a pair G = (V, E), where V is a finite set and E is a set of unordered pairs of V, i.e., E is a subset of {{x, y} | x, y E V,x y}. In affinity graphs used for image segmentation, V is the set of picture elements (pixels or voxels2) and E is any of the usual adjacency relations, e.g., the 4 or 8-adjacency in 2D, 6 or 18-adjacency in 3D. For the rest of the thesis we will assume 4-adjacency for 2D and 6-adjacency for 3D.
2.1.2
Affinity Weights
Let F be the set of all maps from E to R+, we say that a map F in F is an affinity map of G, and F weights the edges in G.
Let F E F and e E E, then, F[e] is an affinity or weight of the edge e. For a given F E
F
and u E V, let Fe [v] be the maximal value of all F[e] where e is an edge containing v. Fe[v] is the value of the strongest edge connecting v with one of its neighbours.2.1.3
Labels and Segmentations
We denote by L the set of all maps from V to No, and we say that any map L in L labels the vertices of G with L[v] being the label of v. If L[v] = 0 we say that the vertex v is unlabeled.
A given L in L is a valid segmentation of G iff for any two vertices u
#
v in Vthat have the same, positive label 1 there exist a path from u to v that visits only vertices labeled 1.
2.1.4
Region Graph and Segmentation Hierarchy
We define a region graph to be a graph obtained by collapsing all the vertices with same labels. Similarly we define region graph's affinities to be the maximal affinities of the corresponding collapsed edges.
2
Finally, we define the segmentation hierarchy to be a maximal spanning tree of the region graph. An edges of the segmentation hierarchy (the MST) represent affinity at witch the two segments merge. A subset of a hierarchical segmentation is shown on Figure B-2.
2.2
Additional Constraints
We extend the standard watershed transform by introducing four user-defined con-strains. The motivation for generalazing our watershed algorithm comes from the nature of the nature affinity graphs obtained directly from imaged volume by apply-ing CNs3 as described by S. Turaga at al. [12].
The affinity between two voxels depends on the field of view4 of the CNs. In simple terms, the the affinity is a function that maps the gray-scale values of the local voxels to R. Due to the noise and exposure difference between slices produced affinity graphs might have slight variations around in the places where the CN is most confident, e.g. near 0 affinity and near 1 affinity. As the watershed transform is based on relative values of the affinities, these small variations might lead to a large number of small segments as depicted on Figure 2-1 (a).
One solution would be to discretize the values of the affinity graph, in which case we would lose powerful property of the real valued affinity graphs which enable us to efficiently implement parallel version of our watershed algorithm without problems related to non-maxima plateaus. This topic is discussed in more detail in Section 4.1.
2.2.1
High Threshold Th
For a given high threshold value Th, we mandate that each edge with affinity greater or equal to Th forces the two vertices to belong to the same segment. We apply this threshold by simply changing the affinity of edges with value higher than Th to oo. An example result of applying Th is shown on Figure 2-1 (b).
3Convolutional networks
4
2.2.2
Low Threshold Ti
Low threshold T simply states that no segment should be grown using edges with affinity less than or equal to T. By growing a segment we consider the first step of the our watershed algorithm described in Section 2.3. The vertices whose all edges have affinity less than or equal to T will became single-vertex segments. For such vertices we set Fe(v) to oc. An example result of applying T is shown on Figure 2-1
(c).
2.2.3
Size Thresholds T and Te
The role of the last two thresholds T, and T, is a bit more elaborate. Once we have obtained a region graph we visit all its edges in decreasing order of affinity. In the case that an edge with affinity greater than Te connects two segments such that one of them has size5 lower than T, we merge the two segments. After we have visited all the edges in the region graph we discard all the segments with the size lower than T,. The main motivation for applying the size thresholds is preventing the tiny seg-ments inside and on the borders of the inner-cellular space. Usage of the size thresolds is shown on Figure 2-1 (d).
2.3
The Watershed Algorithm
We present the watershed algorithm by generalizing the drop of water principle ap-proach described in [3]. In addition to vertex labels we also calculate the region graph
and the segmentation hierarchy.
The algorithm consist of four steps. In the first step we apply the same approach as desribed in [3] with modified values of Fe in order to satisfy constraints Th and T described in Section 2.2. In the second step we generate the region graph. The third step applies the two remaining constraints T, and Te. Finally, in the fourth step we generate the segmentation hierarchy.
5
(c) (d)
Figure 2-1: Results obtained by using additional constraints (a) Standard watershed transform, (b) Watershed transform using Th = 0.98, (c) Watershed transform using
Th = 0.98 and T = 0.2, (d) Watershed transform using Th = 0.98, T = 0.2, Ts = 25
and Te = 0.1.
2.3.1
The Four Watershed Steps
In this subsection we present the pseudo code of the four steps required for our watershed algorithm.
INITIAL-WATERSHED(V,
E,
F)1 for each
u
E V2 L[u) = 0
3 labelnext = 1
4 for each u E V such that label[u] = 0
5 [1, L] = STREAM(U, V, E, F, L) 6 if 1 = 0 7 1 = labelnext 8 labelnext = labelnext + 1 9 for each x E L
10
L[x) = l
11 return L STREAM(U, V, E, F, L) 1Q
LIST(u) 2 L LIST(u) 3 while LIST-LENGTH(Q)/
0 4 y = POP-FRONT(Q)5 while there exist {y, z} E E such that
z
L and F(y,z
F (y)6 if L[z] # 0
7
return [L[z], L]
8 else if F9(z) < Fe(y) 9 PUSH-BACK(L, z) 10Q
= LIST(z) 11 else PUSH-BACK(L, z) 12 PUSH-BACK(Q, z) 13 return [0, L]The procedure INITIAL-WATERSHED applies the drop of water principle using
streams [3]. The output is a valid segmentation labeling of G.
CREATE-REGION-GRAPH(V, E, F, L)
1
E' =
0
2 for each
{u,
v} E E such that L[u] = L[v]3
1i = L[u]
4
l
2= L[v]
5 if {li, 2} E EL'
6 F'[{li,12
}1
= MAX(F'[{li,12}1,FF[{u,v}]) 7 elseE' = E'U{1
1,1
2}
8 F'[{ll,12}] = F[{u,v}]
9 return [E', F']
The procedure CREATE-REGION-GRAPH creates a region graph of the
APPLY-SIZE-THRESHOLD(L, EL, FL, SL, Ts, Te)
1 for each
{li,
12} E EL such that FL({ 1, 12}) > Te in decreasing order of F({11, 12})2 S1 FIND-SET(11)
3
S2 FIND-SET(12)4 if s1
f
s2 and either SL{si <T, or SL[s2] < sT,5 S = SL S1I + SL s21 6 SLsl1] = 0 7 SL [s21 0
8
SLJOIN-SETS(S1, S2)] = s 9 newlabelet = 1 10 for each 1 E L 11 if SL[1] > Ts 12 Si'newlabelnext] = SL[l] 13 L'[l] = newlabelnext 14 newlabelnext = newlabelnext + 1 15 else L'[l1] = 0 16 E - 017 for each
{li,12}
E EL18 si L'[FIND-SET(li)] 19 S2 L'[FIND-SET(12)] 20 if si
0
ands 2#
0
and si s 2 21 if {s1, s2} EEL
22 F'[{si, S2}] = MAX(FL[{s1,s2}1,
FL [{1, 12}])23
else
E =
EL U {si, s2}24
FL[{si,
s
2}1
=FL ({l1,
12}125 return [L', El, FL]
The procedure APPLY-SIZE-THRESHOLD applies the size thresholds on the given segmentation L of G. The procedure returns new labels and new region graph. In
order to assign new labels to the original set V, for each v E V we set Lnew[v]
GENERATE-SEGMENTATION-HIERARCHY(EL, FL)
1 for each {l1, 12} E EL in decreasing order of F({11 , 12})
2 S1 = FIND-SET(11) 3 S2 = FIND-SET(12) 4 if si s 2
5
EH =EH U11, 12 6 JOIN-SETS(si, S2) 7 return [EH]Given a region graph (EL, FL) the GENERATE-SEGMENTATION-HIERACHY
gener-ates the segmentation hierarchy.
2.3.2
The Watershed Procedure
Finally we present the main watershed procedure. The procedure SETUP-CONSTRAINTS generates values of Fe as described in Section 2.2 and CALCULATE-SIZES simply counts the number of vertices per segmentation label.
SERIAL-WATERSHED(V, E, F)
1 SETUP-CONSTRAINTS(Th, T1)
2 L = INITIAL-WATERSHED(V, E, F)
3 [EL, FL] = CREATE-REGION-GRAPH(V, E, F, L)
4 SL = CALCULATE-SIZES(L)
5 [L', EL, FL] = APPLY-SIZE-THRESHOLD(L, EL, FL, SL, Ts, Te)
6 for each v in V
7 L[v] = L'[L[v]]
8 [EH, FH] = GENERATE-SEGMENTATION-HIERARCHY(EL, FL)
9 return [L, EL, FL, EH]
2.4
Correctness and Running Time Analysis
A proof of correctness for the the procedure INITIAL-WATERSHED is given in [3]. Assuming correct implementation of the procedures FIND-SET and JOIN-SETS as
de-scribed in [11] the three remaining parts of our watershed algorithm are correct by design.
For the running time analysis we will assume that O(v) = O(e) which is the case
in the standard adjacency relations. The running time of INITIAL-WATERSHED is then O(v)
[3].
The worst case running time of CREATE-REGION-GRAPH is dominated by sorting the edges - O(v log v). Applying size threshold as well as generatingsegmentation have running time of O(v log* v),6 we make O(v) calls to union-find procedures [11].
The worst case running time of the watershed algorithm described in the previous section is then 0(v log v). The expected running time, however, depends on the input graph and given constraints. As shown on Figure 2-1 even a very tight high threshold might decrease the number of segments after the initial watershed stage by a factor much larger than log(v), bringing the running time much closer to O(v). We could further improve the running time by using parallel sorting rutines described in Section A.1.2.
The memory requirement of the presented algorithm is O(v). We need to store the set of labels, the region graph which is a subset of the original affinity graph and the segmentation hierarchy.
Chapter 3
Watershed Algorithm on Very
Large Affinity Graphs
In this chapter we explore a way of using the serial watershed algorithm on very large affinity graphs. Section 3.1 details a way of transparently using the watershed algo-rithm described in Chapter 2. Some of the bottlenecks of using the serial watershed
algorithm are explained in Section 3.2
3.1
Chunk Based Caching
As described in Section 2.4 the memory requirement for the serial watershed algorithm is O(v). Processing a very large affinity graphs would require a computer with large amount of RAM. We propose a solution using on-disk data structures.
The first step of the serial algorithm described in Section 2.3 visits the vertices of the affinity graph and labels them by alternating breath and depth first search. The nodes visited in the STREAM procedure are all reachable from the starting node. If we divide the original affinity graph into chunks1, we can dynamiclally load only subparts of the graph on demand. Using the most recently used cache algorithms described in Section A.1.5 and implementing wrappers around functions that access the affinity graph we can transparently use the serial watershed algorithm.
We also change the order in which we examine the vertices. By examining all the vertices in a single chunk we increase the likelihood that the affinity graph chunk required is cached in RAM. We store the vertex labels in similar, chunked fashion.
This approach allows us to process arbitrarly large affinity graphs. There are however some overheads described in the next section, some of which can't be easily overcome. For that reason we develop a parallel version of our watershed algorithm described in Chapter 4.
3.2
Cache Performance
The performance of the serial algorithm with cached data structures depends on number of cache hits/misses. Cache performance strongly depends on the affinity graph processed as well as the constraints described in Section 2.2. Small localized segments lead to more cache hits whereas large non-localized ones might lead to a lot of cache misses. The overheads induced by cache misses as well as the fact that we don't take advantage of multi-core machines are the two major reasons for developing an improved, parallel version of our watershed algorithm.
Chapter 4
Parallel Watershed Algorithm
In this chapter we propose a parallel watershed algorithm analogous to the algorithm presented in Chapter 2. Section 4.1 gives more insight into dealing with non-maxima plateaus. The overview of the algorithm is detailed in Section 4.2. Section 4.3 goes over the required modifications of the serial watershed algorithm. Section 4.4 de-scribes the way we merge the local results. Finally, Section 4.5 analyze the running time and space requirement of the algorithm.
4.1
On Non-Maxima Plateaus
Many authors describe the non-maxima plateaus problem as a major obstacle for developing an efficient parallel watershed algorithm [13, 5, 2, 3]. They further de-velop methods for dividing the non-maxima plateaus based on either topological or geographical distance. Fortunately, for the reasons described in Section 2.2 we do not have to worry about the non-maxima plateaus as they do not occur in the affinity graphs our watershed algorithm is designed to process. The empirical result from ex-amining a large set of affinity graphs obtained from EM images using CNs support the claim given in Section 2.2. The largest non-maxima plateaus that we find have size of 3, and they occur very rarely. There are only two ways to divide such plateaus, and they can both be considered correct. As described serial watershed algorithm handles non-maxima plateaus correctly based on topological distance, handling large
affinity graphs with non-maxima plateaus can be done using the method described in Chapter 3
4i2
Algorithm Overview
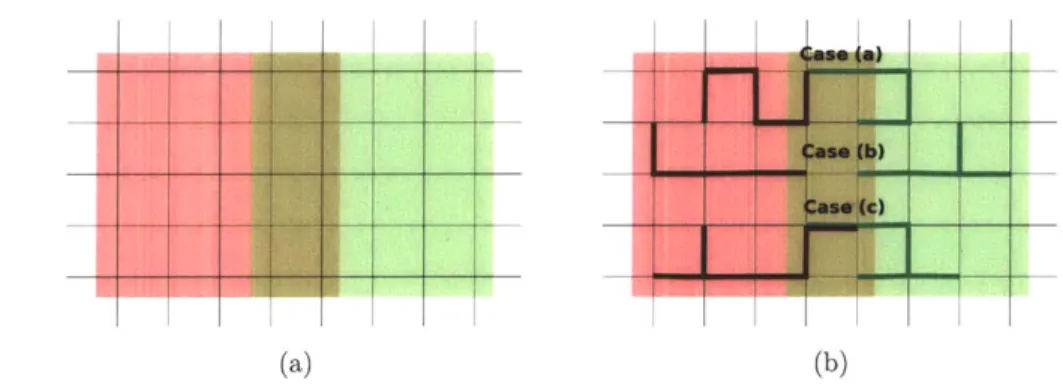
The parallel watershed algorithm consists of two steps. In the first step we apply a modified version of the serial watershed algorithm described in Section 4.3 locally. The affinity graph is divided into regions with an overlap of one edge in each dimension (a 2D affinity graph division is shown on Figure 4-1 (a). The result of each region is then stored on disk. In the second step we merge the results of all the regions by examining the overlapping edges.
4.3
Modified Local Watershed
(a) (b)
Figure 4-1: Dividing the afiinity graph with one overlapping edge
There are few modifications that have to be made to the serial watershed algorithm described in Chapter 2 in order to support merging the local results.
The vertices on the borders of the regions are always considered to be local max-ima. This can be simply done by setting Fe(v) for each border vertex v to be oc. Also, in the procedure INITIAL-WATERSHED we never examine the border vertices. As we 6bnsider the border edges to be local maxima, calling the procedure STREAM
on them would simply mark the single vertex as a segment. If a border edge is not reached from some other vertex inside the STREAM method we don't have to create
separate segment containing that single vertex, as that vertex will be included in some segment while processing the adjacent region.
Another change has to be made inside the APPLY-SIZE-THRESHOLD method. As
we don't know the final size of the segments that touch the border of the region we can't consider them during the stage of merging segments smaller than T,. We modify
APPLY-SIZE-THRESHOLD so that the segments touching the border have unknown
size. When we encounter an edge between a segment of unknown size and any other segment, while looping through the edges of the region graph, we mark both segments as unknown. This way we prevent merging any segment for which we don't know its final size.
Finally, we do not have to create the segmentation hierarchy as a global one will be created later.
4.4
Merging Local Watersheds
We merge local results by examining the edges included in adjacent regions. The three possible cases that might occur are shown on Figure 4-1 (b).
In the first case the edge is visited only in one of the two regions. This means that in one of the two regions a local maxima other than the border is found, and in the other the actual overlapping edge is the local maxima. In this case we can simply merge the two segments.
In the second case both regions have local maximas other than the overlapping edge in which case we don't do anything.
In the third case both regions have the overlapping edge as local maxima. In this case we merge the two segments. The overlapping edge might have been on a non-maxima plateau in both the regions in which case we can find an edge e between the resulting segment and some other segment with affinity equal to the one of the overlapping edge. Ifich an edge exist we merge the two segments connected by e. If there existed more than one edge between the resulting segment with affinity equal to the one of the overlapping edge we use any of them for merging the resulting segment.
This meant that the resulting segment was a part of a plateau.
After all the regions have been merged we apply the size threshold once again. And create the segmentation hierarcy the same way as in the serial watershed algorithm. Note that we don't have to merge local region graphs. As all the local region graphs are already sorted we can use a cache oblivious heap structure described in [8] to visit all the edges of all the region graphs in descending order of affinity.
4.5
Running Time and Space Analysis
Let v be the number of vertices of the affinity graph divided into n equal parts. The running time of processing each part is then O(L log(L)). Processing all the parts on k CPUs takes O(E log(L)). The global step of the algorithm visits all the edges of each part's region graph and applies at most constant number of union-find operations per visited edge. Extracting a maximum from n pre-sorted lists take O(log(n)) time. The running time of the global step is then O(v log(n) log*(v)). The total running time of the parallel watershed is then
0 (vlog(v) + o log(n) log*(v)) = 0 (log(v) + k log(n) log*(v)))
The space requirement for the first part of the algorithm is O(v). We assume that the second part of the algorithm is done using only on-disk data structures.
As increasing n increases the running time but decreases the space requirement the value of n should be minimized while making sure that we can fit O(k) in RAM.
Chapter 5
Results
This chapter provides some results of both the serial and parallel watershed algo-rithms. We compare the running time of the standard watershed transform - with no additional constraints and watershed transform with commonly used constraints.
All results are the average of two trials performed on a 16 core Intel Xeon 3.2GHz CPU with 48GB of RAM running Ubuntu Linux 10.10.
5.1
Serial Watershed
45 40 35 30 25 E .G 20 15 10 5 20 40 60 80 100 120Number of vertices (in millions)
140 160 180 200
Figure 5-1: Measured running time of the serial watershed algorithm
-- Standard Watershed Th = 0.99 and T = 0.2 Th = 0.99, T 0.2, T= 20, T 0.2 VA -0 - V-- -- -.. . ... ... In
Figure 5-1 shows results of the serial watershed implementation ran on different size affinity graphs. The introduced constraints result in lower number of segments and smaller region graph. According to the analysis in Section 2.4 this should lead to lower running and is therefore consistent with the measured results.
5.2
Parallel Watershed
In order to minimize RAM usage, the parallel watershed implementation stores in-termediate results either on disk or in memory. Storing the inin-termediate results in memory reduces the i/o overhead but increses the memory usage, and is not possible for very large affinity graphs. In all the tests a chunk size of 2563 was used.
5.2.1
In Memory
1000-
500-0 2 4 6 8
Number of threads used
10 12 14 16
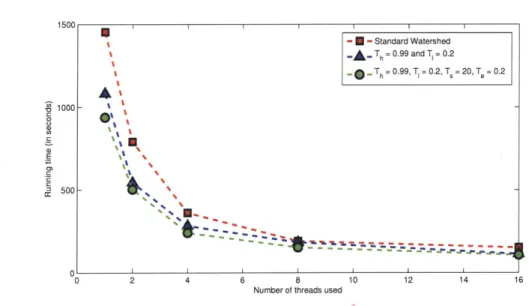
Figure 5-2: Measured running time of the in-memory parallel watershed algorithm
Figure 5-2 shows results of the parallel watershed implementation ran on an affinity graph with 1 billion vertices'. The input affinity graph, the output segmentation and
11000 x 1000 x 1000 volume. -fl-Standard Watershed Th = 0.99 and T, = 0.2 Th = 0.99, T, = 0.2, T = 20, T = 0.2 % -%U *% %. __ -... 1 NW)
the intermediate results were stored on a ramfs partition2. Once again we confirm that the introduced constraints result in lower running times.
5.2.2
On Disk
16001 1 1 1 1 1400 F 1200-8 S1000o800 -200' 0 2 4 6 8Number of threads used
10 12 14 16
Figure 5-3: Measured Running Time of the On-Disk Parallel Watershed Algorithm
Figure 5-3 shows results performed on the same affinity graph using on-disk stor-age. Before running the algorithm all system caches were dropped to ensure correct measurements. The runtime includes the time needed to read the input affinity graph from the disk, and store the results on the disk. The results show that when using more than 4 threads the disk i/o becomes the major overhead. The maximal number of threads that improve the overal running time strongly depends on the disk speed.
2
Virtual disk stored in RAM
-. - Standard Watershed Th = 0.99 and T, = 0.2 * Th = 0.99, TI = 0.2, TS = 20, T = 0.2 it - --- --- 4A ... . ... . ...
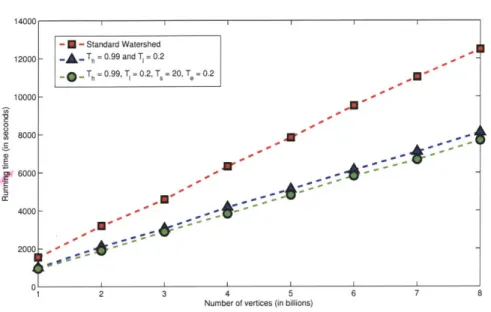
-E - Standard Watershed 12000- -A- Th = 0.99 and T = 0.2 Th = 0.99, T= 0.2, T =20, T =0.2 10000-W 8000 -6000 -4000 -2000 ~ 1 2 3 4 5 6 7 8
Number of vertices (in billions)
Figure 5-4: Measured running time of the on-disk parallel watershed algorithm using 4 threads
Measured running time of the parallel watershed algorithm using 8 threads ran on very large affinity graphs is shown on Figure 5-4. As the performances are limited
by disk i/o speed we see a linear increase running time.
5.3
Segmentation Results
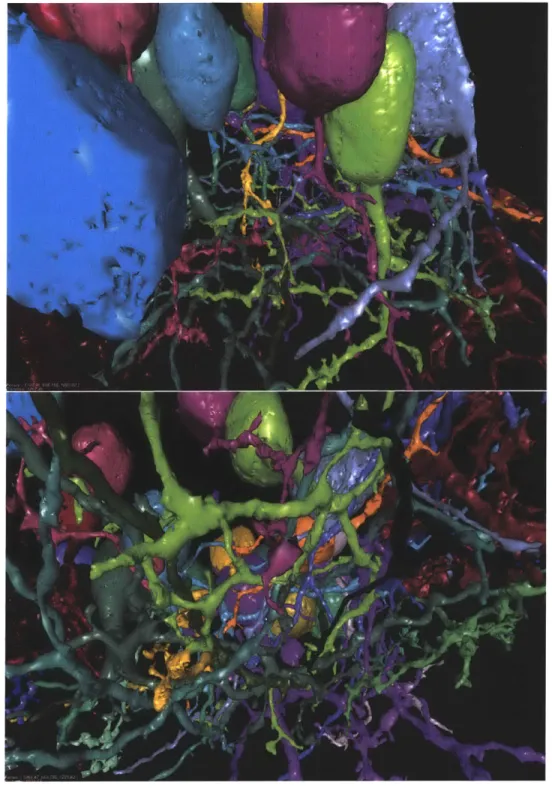
Figure 5-5 shows a 3D representation of a subset of segments obtained by the gener-alized watershed transform on a 20003 volume using our parallel algorithm.
Figure 5-5: Visualization of watershed segmentation on a 20003 volume
35
Appendix A
Implementation Details
The implementation of both serial and parallel watershed are provided as a part of the zi libraries. The code takes advantage of C++'s templates in order to achieve optimal performance based on the affinity graph sizes and data types. For example, smaller affinity graphs lead to smaller number of labels in which case a smaller integral type is used for labeling the vertices.
A.1
The zi Library
The zi libraries provides all the necessary functionality needed for both the serial and parallel versions of the algorithm. Many libraries are extensively used by OMNI to provide real time editing of the hierarchical segmentation obtained by the watershed transform. In the rest of this chapter we describe some of the libraries.
A.1.1
Concurrency
The library enables the use of multiple threads of execution with shared data in portable C++ code. It provides classes and functions for managing the threads themselves, along with others for synchronizing data between the threads.
The Concurrency library also provides some higher level functionality such as prioritized task managers, periodic functions, state managers, et cetera.
A.1.2
Parallel
The Parallel library provides a parallel implementation of many algorithms from the
C++ Standard Library. Depending on the platform and compiler flags, the library
will either wrap the gnu parallel implementations that use OpenMP annotations, or provide an efficient parallel implementation using the Concurrency library described in section A.1.1.
The watershed implementation strongly relies on the Parallel library, especially during the global step of the distributed watershed.
A.1.3
Disjoint Sets
The library provides a fast and memory efficient, generic implementation of the
union-find data structures as described by R. Tarjan [11].
A.1.4
Heap
The Heap library provides an easy way to create dynamic heaps for arbitrary data structures. The heap elements can be of any type when the key and value extractors are described. An extractor can be any global function, type's member function or type's member variable. The library provides both the standard binary heap implementation as well as the fibonacci heaps as described by M. Fredman and R. Tarjan [4].
A.1.5
Cache
The Cache library provides a set of classes and functions for transparently using external storage for large data containers. It provides a set of caching strategies: most recently used, most commonly used, et cetera.
A.1.6
System
The System library enables us to detect the currently used platform amounts of used/free memory, number of CPUs and many other system parameters.
A.1.7
Time
This library provides a set of tools for accurately measuring running time and CPU time. It is an essential tool for performance testing.
A.1.8
Graph
The Graph library provides a large set of graph algorithms including, but not limited to: matchings, topological sorting, dynamic trees, network flows, etc. The library is
Appendix B
Figures
Wteto ,*- fl* W .. met L w g all- 14 u6 - - 25 -805 M I P25U 12. 17n1 04085 v4 6.3 06064 a1 *AMA4 ME2 2? 1,5 238M 2U SA.KA, Mi4 0 14.2L).
Figure B-2: Hierarchical segmentation in OMNI
42
... ... ... . . ... ... a--- -- - - I- -= - - - - - - - - -- -
---Bibliography
[1] S. Beucher and C. Lantuejoul. Use of watersheds in contour detection, 1979.
[2] A. Bieniek and A. Moga. A connected component approach to the watershed segmentation, 1998.
[3] Jean Cousty, Gilles Bertrand, Laurent Najman, and Michel Couprie. Watershed
cuts: Minimum spanning forest and the drop of water principle. IEEE
Transac-tions on Pattern Analysis and Machine Intelligence, 31(8):1362-1374, 2009.
[4] M L Fredman and R E Tarjan. Fibonacci heaps and their uses in improved network optimization algorithms. JACM, (34), 1987.
[5] F. Meyer. Un algorithme optimal de ligne de partage des eaux, 1991. [6] F. Meyer. Topographic distance and watershed lines, 1993.
[7] L. Najman and M. Schmitt. Watershed of a continuous function, 1993.
[8] Christian Scheideler and Stefan Schmid. A distributed and oblivious heap, 2009. [9] J. Serra. Image analysis and mathematical morphology, 1982.
[10] Rachel Welles Shearer. Omni: Visualizing and editing large-scale volume
seg-mentations of neuronal tissue. Master's project, Massachusetts Institute of Tech-nology, 2008.
[11] Robert E Tarjan. Data structures and network algorithms. In Society for
Indus-trial and Applied Mathematics, 1983.
[12] Srinivas C. Turaga, Kevin L. Briggman, Moritz Helmstaedter, Winfried Denk, and H. Sebastian Seung. Maximin affinity learning of image segmentation.
[13] L. Vincent and P. Soille. Watersheds in digital spaces: An efficient algorithm
based on immersion simulations, 1991.
[14] Brett M. Warne. A system for scalable 3d visualization and editing of connec-tomic data. Master's project, Massachusetts Institute of Technology, 2008.