HAL Id: hal-00765722
https://hal.archives-ouvertes.fr/hal-00765722
Submitted on 10 Jun 2014
HAL is a multi-disciplinary open access
archive for the deposit and dissemination of sci-entific research documents, whether they are pub-lished or not. The documents may come from teaching and research institutions in France or abroad, or from public or private research centers.
L’archive ouverte pluridisciplinaire HAL, est destinée au dépôt et à la diffusion de documents scientifiques de niveau recherche, publiés ou non, émanant des établissements d’enseignement et de recherche français ou étrangers, des laboratoires publics ou privés.
A non-linear statistical downscaling model: El
Niño/Southern Oscillation impact on precipitation over
New Caledonia
Martin Fischer, Boris Dewitte, Luc Maîtrepierre
To cite this version:
Martin Fischer, Boris Dewitte, Luc Maîtrepierre. A non-linear statistical downscaling model: El Niño/Southern Oscillation impact on precipitation over New Caledonia. Geophysical Research Letters, American Geophysical Union, 2004, 31 (L16204), pp.4. �10.1029/2004GL020112�. �hal-00765722�
A non-linear statistical downscaling model: El Nin˜o//Southern
Oscillation impact on precipitation over New Caledonia
Martin Fischer,1 Boris Dewitte,2 and Luc Maıˆtrepierre3
Received 29 March 2004; revised 9 June 2004; accepted 21 July 2004; published 20 August 2004.
[1] A new multivariate non-linear non-parametric
regression method, called MARS, is used in a statistical downscaling problem for simulating New Caledonian rainfall anomalies induced by El Nin˜o/Southern Oscillation (ENSO). The use of a non-linear method was motivated by wavelet analyses, pointing to a complex interaction between interannual and intraseasonal rainfall variability. The proposed method is very flexible and computationally efficient. It can be applied to a wide range of problems and its use is not limited to spatial downscaling applications. Furthermore the method provides great potential for comprehensive diagnostics of multivariate problems in climate research. It is shown that this method can take into account the asymmetry between El Nin˜o and La Nin˜a periods and also the type of El Nin˜o. INDEXTERMS: 3210
Mathematical Geophysics: Modeling; 3220 Mathematical Geophysics: Nonlinear dynamics; 3339 Meteorology and Atmospheric Dynamics: Ocean/atmosphere interactions (0312, 4504); 4215 Oceanography: General: Climate and interannual variability (3309); 4522 Oceanography: Physical: El Nino. Citation: Fischer, M., B. Dewitte, and L. Maıˆtrepierre (2004), A non-linear statistical downscaling model: El Nin˜o/Southern Oscillation impact on precipitation over New Caledonia, Geophys.
Res. Lett., 31, L16204, doi:10.1029/2004GL020112.
1. Introduction
[2] ENSO impacts on precipitation at large spatial scales
in the tropical Pacific sector are qualitatively well known. The spatial distribution of the correlation between, the upper-tropospheric relative humidity and the NINO3 index (SST anomalies averaged over 150°W–90°W; 5°S–5°N) at zero lag reflects the enhanced local Hadley cell over the eastern Pacific during El Nin˜o. Thus, zones of significant positive values in an elongated band over the central and eastern Pacific and negative values over the Indonesian Archipelago are found. The elongated band of positive correlations along the equatorial Pacific is flanked by negative correlation to the north and south [see Klein et
al., 1999, Figure 3a]. New Caledonia is located at the
latitude of the southern center of this negative correlation zone. Thus precipitation over the island is positively corre-lated with the Southern Oscillation Index (SOI) as demon-strated by Nicet and Delcroix [2000] (hereinafter referred to as ND2000) for the 1969 – 2000 period.
[3] In that paper, the authors show that a 20% – 50%
decrease in precipitation generally occurs during El Nin˜o events, and an even stronger increase is observed during La Nin˜a. They noticed that the magnitude of the precipitation anomalies is not strictly proportional to the strength of ENSO, pointing to the limitations associated with linear analyses. Whereas the persistent but moderate warm con-ditions during 1992/93 led to rather dramatic concon-ditions for the New Caledonian agriculture (Chambre de l’Agriculture de Nouvelle Cale´donie, personal communication, 2003), the intense 1997 – 1998 El Nin˜o event was not followed by a severe drought in New Caledonia (and over North Eastern Australia). Similarly the moderate 2002 El Nin˜o event was followed by dry conditions over the territory ( 38% rainfall deficit from May 2002 to February 2003, for 36 stations (Me´te´o France, personal communication, 2004)).
[4] ND2000 conclude that the weakness of simple linear
regression models for quantifying precipitation (P) changes over New Caledonia calls for more sophisticated statistical and/or dynamical models.
[5] In this paper, we present a multivariate non-linear
non-parametric statistical downscaling method. Six climate indices are projected onto Empirical Orthogonal Functions (EOF) of New Caledonian rainfall anomalies, measured at 28 stations. For the mapping we use Multivariate Adaptive Regression Splines (MARS) [Friedmann, 1991]. MARS yields very robust models with very little tendency for over-fitting, a persistent problem in statistical modeling. Furthermore, MARS models can be easily interpreted, and hence help to unveil and understand complicated multivar-iate relationships. It is shown that this method can take into account the asymmetry between El Nin˜o and La Nin˜a periods and the type of El Nin˜o. MARS has great potential in climate research not only as a modeling tool, but also for diagnostic purposes.
2. Data and Methods 2.1. Data
[6] The ENSO indices used in this study consist of
monthly average of the NINO3, NINO4 (SST anomalies averaged over (160°E–150°W; 5°S–5°N)) and SOI indices and three monthly indices characterizing the strength of the Walker and Hadley circulation in the Pacific. The latter are defined as in the work of Wang [2002] from the NCEP/ NCAR Reanalysis. The Pacific Walker index (PACW) is defined as the 500-mb vertical velocity anomaly difference between the equatorial eastern Pacific (5°S–5°N; 160°W– 120°W) and the equatorial western Pacific (5°S – 5°N; 120°E–160°E). The eastern Pacific Hadley index (EPACH) is defined as 500-mb vertical velocity differences between the central North Pacific (25°N–35°N; 170°E–150°W) and
1
MIKAN, Noume´a, New Caledonia.
2IRD, Centre de Noume´a, Noume´a, New Caledonia. 3
Me´te´o-France, Noume´a, New Caledonia. Copyright 2004 by the American Geophysical Union. 0094-8276/04/2004GL020112
the equatorial eastern Pacific (5°S–5°N; 160°W–120°W). The western Pacific Hadley index (WPACH) is defined as the vertical velocity anomaly difference between the western North Pacific (25°N–35°N; 110°E–150°E) and the equatorial western Pacific (5°S–5°N; 120°E–160°E). The SOI is defined as the difference between normalized pressure anomalies at Tahiti and Darwin, divided by the standard deviation of this difference (http://www.ncdc.noaa. gov/oa/climate/research/teleconnect/soi.txt).
[7] The NCEP data from which the indices for the strength
of the Walker and Hadley circulation were computed show a distinct shift during the late seventies (G. Alory, personal communication, 2004). To obtain consistent anomalies over the whole period we subtracted linear trends that were calculated separately for the period 1951 to 1976 and 1976 to 2002. The monthly precipitation data were obtained from Me´te´o-France in Noume´a. 28 stations were selected, which represents a superset of the 21 stations used in ND2000. The data cover the period January 1951 to December 2002. 23 stations are distributed along the coast of the main island. The remaining 5 stations are located on the Loyalty Islands and on the Isle of Pines. Anomalies were computed with respect to the climatology derived from the period 1951 to 2002. The rainfall anomalies were normalized by their respective variance and smoothed applying a 7 months running mean. 2.2. Wavelet
[8] The wavelet transform is used to isolate the different
timescales and to determine how the dominant modes vary in time. The Morlet wavelet is used, and the transform is performed in Fourier space using the method described in
Torrence and Compo [1998]. To test the significance of
peaks in the wavelet power spectrum, a Fourier red noise background spectrum was chosen.
2.3. MARS
[9] Multivariate Adaptive Regression Splines (MARS)
were first introduced by Friedmann in 1991 [Friedmann, 1991]. MARS is a non-linear non-parametric statistical modeling method. It finds automatically the quantitative relationship between a set of independent predictor variables (covariates) and the dependent target variables. Predictor variables that do not contribute to explain the target variables are automatically rejected. As one of the results the used predictor variables are listed in ascending order, according to their respective importance. Thus MARS not only allows modeling non-linear relationships efficiently, but it also provides interpretable results and hence enables a better understanding of the underlying dynamics.
[10] MARS models take the form of an expansion in
(linear) product spline basic functions. The number of basis functions as well as the parameters associated with them are determined automatically from the data. MARS divides the whole space spanned by the covariates into sub-regions, similar to a recursive partitioning algorithm. For each sub-region low dimensional linear local solutions are fitted. Even though the model may depend on a large number of variables globally, in any local region the dependence is strong on only a few of them. These few variables may be different in different regions [Friedmann, 1991]. This local representation of the final model ensures that MARS needs relatively few data points compared to other non-linear modeling methods and that it is less prone to overfitting.
This first part of the algorithm is called forward stepwise regression. It is followed by a backwards stepwise proce-dure to remove basis functions that no longer contribute sufficiently to the accuracy of the fit, and thus simplify the model even further. To find the best model a cost function is minimized that consists of a term to represent the goodness of fit and a second term that penalizes model complexity. A detailed description of the MARS algorithm would be beyond the scope of this paper. For those interested in a detailed description we refer to the original publication [Friedmann, 1991].
[11] The method has been applied with great success in
econometrics [Sephton, 2001] and in risk estimation for insurance companies [Kolyshkina and Brookes, 2002] and offers great potential for diagnostics and modeling. 3. Results
3.1. Predictor and Target Time Series Analysis [12] An EOF analysis is performed on the normalized
precipitation anomalies of the 28 stations for the period January 1951 to December 2002. The first EOF explains by far most of the variance (69%) and the associated time series is significantly correlated with ENSO indices. Since the data were normalized the contribution of each station to the first EOF reflects the relative level of variability. This was found to be approximately equal for all stations, indicating that mean precipitation and the respective variability are pro-portional to each other.
[13] As pointed out in ND2000, despite the general phase
agreement between the EOF time series and the ENSO indices, the magnitudes of the precipitation (P) changes are not proportional to the SOI or NINO3 and NINO4 indices. We attribute this to a non-linear interaction between ENSO induced interannual variability and the level of intraseasonal variability.
[14] As an illustration, Figure 1a displays the wavelet
power spectrum of the precipitations anomalies at Hienghene (north east of the main island). The power spectrum indicates a significant amount of energy being present in the intraseasonal band. The ratio between the variance of the integrated energy in the intraseasonal band and in the interannual band ([1 – 6 yrs]) is 4.9. Ignoring the intraseasonal frequency band, the wavelet power spectrum is comparable to the cross wavelet spectrum between P changes in Hienghene and the NINO3 SST index (not shown) indicating that there is not a straight relationship between precipitation events and El Nin˜o events although correlations can be high for the interannual frequency band. Figure 1b summarizes the above observations: The integrated energy in the intra-seasonal band of the Hienghene precipitation anomaly wavelet power spectrum coincides with some anomalous climatic events in New Caledonian, in particular the ones associated to La Nin˜a (see arrows on Figure 1b), e.g., the 1965 anomalous cold conditions, the persistent cold conditions between 1973 and 1976, the 1989 La Nin˜a, and to some extent the wet conditions during the 1999 – 2001 La Nin˜a period. During El Nin˜o events the relationship between large scale SST anomalies and anomalous rainfall in New Caledonia is less pronounced.
[15] For simplicity, we chose three ENSO indices and
three indices characterizing the strength of the Walker and Hadley circulation in the Pacific. The combination of
L16204 FISCHER ET AL.: NONLINEAR STATISTICAL DOWNSCALING L16204
NINO3 and NINO4 indices contains specific information on the type of ENSO events that the multivariate regression method can identify through their relationship to P changes in New Caledonia. To emphasize the differences between the two ‘oceanographic’ indices which are highly correlated (c = 0.73 over 1951 – 2003), we display the average wavelet power in the 1 – 6-yr band (Figure 2). Two periods can be distinguished: before 1980, both time series are concomi-tant, whereas after 1980, differences in amplitude and phase emerge. Before about 1980, El Nin˜o events tended to develop first along the coast of South America and then spread westward. More recent events developed first in the central Pacific and then spread eastward [e.g., Wang, 1995]. Other differences include the magnitude of the anomalies and their duration: Strong El Nin˜os (NINO-3 index above 1.5) usually exhibit a larger NINO3 than NINO4 index, whereas the NINO4 anomalies last longer than NINO3 anomalies during moderate El Nin˜os (NINO-3 index between 0.5 and 1.5). La Nin˜a periods are generally char-acterized by comparable anomalies for NINO3 and NINO4. 3.2. The Statistical Model
[16] A MARS model was fitted to explain the
relation-ship between large scale climate indices (predictors) and the
time series of the first EOF of normalized New Caledonian rainfall anomalies. As a first approach we chose as pre-dictors all six indices (NINO3, NINO4, SOI plus 3 indices characterizing the strength of the Walker and Hadley circulation in the Pacific). Time lags, ranging from 12 months to +12 months between the climate indices and the EOF time series were tested. Positive time lags indicate the EOF time series lagging the ENSO indices. The best modeling results were found for a time lag of 2 to 3 months (see Figure 3, solid line). At this time lag the MARS model is able to explain about 39% of the total variance of the first EOF time series. MARS identifies NINO4 as the most important index, followed by the NINO-3 index. SOI and the other indices help to improve the model, but overall their contribution is minor compared to the NINO3 and NINO4 indices.
[17] Considering the slight improvement with more
pre-dictors than the sole NINO3 and NINO4 indices, and to ease the interpretation of the model’s results, we fitted in a second step a MARS model using the NINO3 and NINO4 indices only. Furthermore we forced MARS to search for a very simple model without sacrificing accuracy (Figure 3, dashed line). The best compromise between model simplicity and accuracy was found to be a model with four terms only. Compared to the most complex model, which uses 12 terms, the accuracy expressed as explained variance dropped from 39% to about 34%. As a benchmark we also tested a linear regression using the SOI index only (Figure 3, dotted line). Both MARS models clearly outperform the univariate linear regression. The robustness of the models was tested by dividing the data into two chunks (Jan 1951 – Dec 1979 and Jan 1980 to Dec 2002) and fitting models to each subset separately. The results for the two subsets and the whole period are very close (not shown here), which indicates robust results.
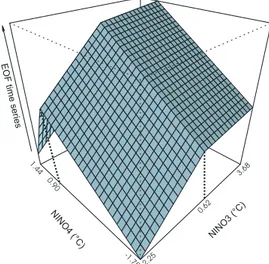
[18] In Figure 4 the structure of the simple model is
shown. The variation of the target variable ‘‘EOF time series’’ is shown as a function of the NINO3 and NINO4 indices. The sign of the EOF time series is such that positive values correspond to dryer than normal condi-tions. The general structure of the model confirms findings in studies carried out with linear regression models [Delcroix and Lenormand, 1997; ND2000]. During El Nin˜o conditions New Caledonia experiences dryer than normal conditions and the opposite during La Nin˜a. The model reveals, however, that the response is asymmetric and non-linear. With increasingly positive NINO3 values Figure 1. Modulus of Morlet wavelet transform of the
time series associated with (a) precipitation anomalies in Hienghene. (b) Average wavelet power in the intraseasonal band for precipitation in Hienghene (thick full line) and in the interannual band (1 – 6 yr) for the first EOF of P changes (thick dotted line). The curves were normalized by their respective means over the period and a 0.5 coefficient was applied for the precipitation in Hienghene. The limits of the ‘cone of influence’ where edge effects become important are indicated by the straight full black line. The white contour is the 95% confidence level.
Figure 2. Average wavelet power in the 1 – 6-yr band for the NINO3 (full line) and NINO4 (dotted line) indices and the GMSLP Southern Oscillation Index (dashed line). Each curve was divided by its mean.
Figure 3. Model performance expressed as the ratio of variance of the first EOF time series, explained by the complex MARS model (solid), the simple MARS model (dashed), and a linear regression model (dotted).
the response variable reaches saturation. This saturation starts – according to the model – at a threshold value of NINO3 = 0.62. The asymmetry in terms of NINO4 is even more pronounced. Up to a threshold value of NINO4 = 0.9 the correlation between the index and the response variable is positive. Beyond that the response weakens very substantially.
[19] The largest absolute response is obtained for strongly
negative values of NINO3 and NINO4. This combination corresponds to a basin wide La Nin˜a event as for instance during 1988/89 (NINO-3 and NINO-4 below 1.50) and 2000/01 (NINO-3 and NINO-4 below 0.65) and induces heavily positive rainfall anomalies in New Caledonia.
[20] The most negative precipitation anomalies are found
for a NINO4 index around 0.9 together with a NINO3 index above 0.62. These values correspond to a moderate basin wide El Nin˜o event. Such conditions were for instance found during the 1992/93 (NINO-3 between neutral and 1.04 and NINO-4 around 0.5) and the 2002/03 (NINO-3 = 1.4, NINO-4 = 1.22) El Nin˜o events. These years rank amongst the driest on record in New Caledonia. During the extreme El Nin˜o events 1982/83 and 1997/98 (NINO-3 above 3.3) New Caledonia encountered anomalous low precipitation, however, less dramatic than 1992/93, which is in agreement with the model.
4. Conclusions
[21] We presented the use of a non-linear non-parametric
regression method for statistical downscaling. The use of a non-linear method relating the ENSO cycle to New Caledonian rainfall anomalies was motivated by previous studies [ND2000; Delcroix and Lenormand, 1997; Me´te´o-France, unpublished manuscripts, 2002, 2003] and by an analysis of the interaction between interannual and intra-seasonal rainfall variability. The wavelet transform allows emphasizing the complex nature of this interaction. Whereas the modulation of the precipitation anomaly in the intra-seasonal band grasp most ENSO events, its relationship to the precipitation anomaly modulation in the interannual
band is not straightforward, which suggests a relatively large degree of non-linearity in the system.
[22] The structure of the model found shows a
pro-nounced non-linear relationship between large scale anomaly patterns in the Pacific and precipitation anomalies in New Caledonia. The response to El Nin˜o and La Nin˜a events is asymmetrical. During warm events (El Nin˜o) the response strongly depends on the strength and on the type (basin wide/coastal) of the event. Qualitatively this was already found in previous studies (ND2000; see also The
Island Climate Update bulletins from NIWA (http://
www.niwa.co.nz)). Our approach, however, allows to quantify the non-linearities. MARS yields threshold values for the independent predictor variables where the character-istics of the response change. Results of a linear regression model were confronted to the results presented here. They exhibit less skill with a substantial drop of the amount of explained rainfall variance.
[23] Considering the socio-economic impact for New
Caledonia (agriculture, public construction, mining industry, tourism, health..) and the difficulty to develop a dynamical regional model, such a study is seen as an important contribution to the development of socio-economic models for New Caledonia - and other regions of the world - that include climate variability as a critical variable.
[24] Since the proposed method is very flexible and
computationally efficient it can be applied to a large range of problems. Its use is not limited to spatial downscaling applications. It basically can replace commonly used linear regressions in all cases where the linear approach is questionable. Furthermore the method provides great potential for comprehensive diagnostics of multivariate problems in climate research.
[25] Acknowledgments. The principal author was supported by the contract #R0210389Q of the Concours national 2002 d’aide a` la
cre´ation d’entreprises de technologies innovantes organized by the French
research ministry. Fruitful discussions with colleagues at IRD were highly appreciated. The comments of Mike Harrison, who reviewed the paper, enhanced the quality of the manuscript and were greatly appreciated.
References
Delcroix, T., and O. Lenormand (1997), ENSO signals in the vicinity of New Caledonia, South Western Pacific, Oceanol. Acta, 20, 481 – 491. Friedmann, J. (1991), Multivariate adaptive regression splines (with
discus-sion), Ann. Stat., 19, 1 – 141.
Nicet, J.-B., and T. Delcroix (2000), ENSO-related precipitation changes in New Caledonia, Southern tropical Pacific: 1969 – 98, Mon. Weather Rev.,
128, 3001 – 3006.
Klein, S. A., B. J. Soden, and N.-C. Lau (1999), Remote sea surface temperature variations during ENSO: Evidence for tropical atmospheric bridge, J. Clim., 12, 917 – 932.
Kolyshkina, I., and R. Brookes (2002), Data mining approaches to model-ing insurance risks, report, PricewaterhouseCoopers, New York. Sephton, P. (2001), Forecasting recessions: Can we do better on MARS?,
report, Fed. Reserve Bank of St. Louis, Mo.
Torrence, C., and G. P. Compo (1998), A practical guide to wavelet analysis, Bull. Am. Meteorol. Soc., 79, 61 – 78.
Wang, B. (1995), Interdecadal changes in El Nino onset in the last four decades, J. Clim., 8, 267 – 285, February.
Wang, C. (2002), Atmospheric circulation cells associated with E Nin˜o Southern Oscillation, J. Clim., 15, 399 – 419.
B. Dewitte, IRD, Centre de Noume´a, 101 Promenade Roger Laroque – Anse Vata, BP A5-98848 Noume´a Cedex, New Caledonia.
M. Fischer, MIKAN, 27 rue de Se´bastopol, BP 12270, 98802 Noume´a, New Caledonia. (mfischer@mikan.nc)
L. Maıˆtrepierre, Me´te´o-France, 1 rue Vincent Auriol, Faubourg Blanchot, BP 151-98845 Noume´a Cedex, New Caledonia.
Figure 4. Structure of the simple MARS model. The modeled EOF time series is shown as a function of the NINO3 and NINO4 indices.
L16204 FISCHER ET AL.: NONLINEAR STATISTICAL DOWNSCALING L16204