HAL Id: inserm-01157477
https://www.hal.inserm.fr/inserm-01157477
Submitted on 28 May 2015HAL is a multi-disciplinary open access archive for the deposit and dissemination of sci-entific research documents, whether they are pub-lished or not. The documents may come from teaching and research institutions in France or abroad, or from public or private research centers.
L’archive ouverte pluridisciplinaire HAL, est destinée au dépôt et à la diffusion de documents scientifiques de niveau recherche, publiés ou non, émanant des établissements d’enseignement et de recherche français ou étrangers, des laboratoires publics ou privés.
Neuroticism and cardiovascular disease mortality:
socioeconomic status modifies the risk in women (UK
Health and Lifestyle Survey).
Gareth Hagger-Johnson, Beverly Roberts, David Boniface, Séverine Sabia,
David Batty, Alexis Elbaz, Archana Singh-Manoux, Ian Deary
To cite this version:
Gareth Hagger-Johnson, Beverly Roberts, David Boniface, Séverine Sabia, David Batty, et al.. Neu-roticism and cardiovascular disease mortality: socioeconomic status modifies the risk in women (UK Health and Lifestyle Survey).. Psychosomatic Medicine, Lippincott, Williams & Wilkins, 2012, 74 (6), pp.596-603. �10.1097/PSY.0b013e31825c85ca�. �inserm-01157477�
Neuroticism and Cardiovascular Disease Mortality: Socio-economic Status Modifies the Risk in Females (UK Health and Lifestyle Survey)
Gareth Hagger-Johnson, PhD* Beverly Roberts, PhD
David Boniface, MA, MSc, C.Stat.1 Séverine Sabia, PhD
G David Batty, PhD Alexis Elbaz, MD, PhD Archana Singh-Manoux, PhD
Ian Deary, MB, ChB, PhD, FRCPsych, FRCPE, FBA, FRSE, FMedSci * Corresponding author & address:
1
Department of Epidemiology and Public Health University College London
1-19 Torrington Place, London WC1E 6BT, UK Telephone: +44 (0)207 679 1820
Fax: +44 (0)207 419 6732
Email: g.hagger-johnson@ucl.ac.uk
Acknowledgments: Gareth Hagger-Johnson and Séverine Sabia are supported by a grant from the National Institute on Aging, NIH (R01AG034454, PI: Singh-Manoux & Kivimaki). The Centre for Cognitive Ageing and Cognitive Epidemiology is supported by the Biotechnology and Biological Sciences Research Council, the Engineering and Physical Sciences Research Council, the Economic and Social Research Council, the Medical Research Council, and the University of Edinburgh. David Batty is a Wellcome Trust Career Development Fellow. David Boniface is a senior research associate at University College London and is a Wellcome Trust Fellow.
Abstract
Objective. The association between personality traits and mortality might differ as a function of
socio-economic status (SES). Our aim was to evaluate the risk of all-cause, CVD- and cancer-mortality risks associated with neuroticism or extraversion and their interactions with SES in a representative sample of the UK adult population.
Methods. The analytic sample comprised 5450 participants (2505 male) from the Health and Lifestyle
Survey (HALS, 1984) who completed the Eysenck Personality Inventory at baseline and were monitored for vital status over 25 years. SES was defined as a latent variable comprising occupational social class,
educational attainment and income.
Results. A significant neuroticism*SES*sex interaction (p = .04) for CVD mortality revealed
aneuroticism*SES interaction which differed by sex. Compared to females with average SES, those with both high neuroticism and low SES were at increased risk of CVD mortality (HR = 2.02, 95% CI 1.45, 2.80) whereas those with high neuroticism and high SES combined were at decreased risk of CVD mortality (HR = 0.61, 95% CI 0.38, 0.97; p interaction = 0.003). The interaction term was not explained by health
behaviours (10.0% attenuation) and physiological variables (11.4% attenuation). This interaction was not observed for all-cause and cancer mortality, nor among males for CVD mortality.
Conclusions. High neuroticism is a risk factor for cardiovascular mortality in low SES women, whereas in
women with higher SES it is protective. Further research is needed to replicate this finding and identify the mechanisms behind the modifying effect of SES on the risk associated with neuroticism.
Key words: cardiovascular disease, Health and Lifestyle Survey, mortality, neuroticism, socio-economic
status, moderator
Acronyms:
BMI = body mass index
CRP = C-reactive protein
CHD = coronary heart disease
CVD = cardiovascular disease
DBP = diastolic blood pressure
EPI = Eysenck Personality Inventory
FEV1 = Forced Expiratory Volume in 1 second
FFQ = food frequency questionnaire
HALS = Health and Lifestyle Survey (1984)
HR = hazard ratio
ICD9 = Ninth International Classification of Diseases
NHS = National Health Service
SD = standard deviation
SES = socio-economic status
SBP = systolic blood pressure
Introduction
Neuroticism, defined as a stable tendency to experience negative emotionality, such as anxiety, low mood and depression (1) has an unclear association with mortality (2). Shipley et al. (3) identified four studies suggesting neuroticism is a risk factor for mortality (4-7), two suggesting a protective influence (8, 9) and four reporting no association (10-13). In the UK Health and Lifestyle Survey (HALS), a
representative sample of UK adults covering the entire adult age range, neuroticism was associated with all-cause mortality, particularly in older age groups (3). Extraversion, referring to sociable, excitement-seeking tendencies (1) has also been examined for its association with mortality; four studies suggested a protective effect (5, 6, 10, 14) and six reported no association (7-9, 12, 13, 15). In HALS extraversion was associated with CVD mortality in the 40-59 age group only, but not after adjusting for health behaviors and
physiological variables.
Several more recent studies also support an association between higher neuroticism and mortality. In the Baltimore Longitudinal Study of Aging (16), high neuroticism and low extraversion were associated with all-cause mortality risk and neuroticism was associated with CVD mortality risk. In the Vietnam Experience Study Cohort (17), neuroticism was associated with all-cause mortality in analysis adjusted for SES, physical/mental health and health behavior. In the Mayo Clinic Cohort Study (18), a composite of several personality traits which are phenotypically similar to neuroticism was associated with mortality, surviving adjustment for SES, health behaviors and health status. Analyses of the Veterans Administration (VA) Normative Ageing Study (19) suggest that neuroticism and increasing neuroticism over time (20) increase the risk of all-cause mortality in older men. In the Edinburgh Artery Study Cohort (21), neither neuroticism nor extraversion were associated with all-cause mortality, over a 10-year follow-up with an age range of 55 to 74 at baseline. Results from the MIDUS cohort (22) indicated an association between
neuroticism and all-cause mortality. Health behaviors attenuated the association, by 26%. Finally, in a study of older Japanese adults (23) followed for five years, extraversion was associated with decreased mortality risk, but not neuroticism. The short follow-up time may have contributed to the null effect. Across the totality of available evidence to date, neuroticism and low SES both appear to be independent risk factors for mortality, although there are methodological differences across studies which may account for inconsistent
findings. There is a scarcity of research into cause-specific mortality, interactions with SES and into possible sex differences. Representative samples of national populations, longer follow-up times and evaluation of effect modification by age, sex and SES may clarify the specificity of associations. Cause-specific mortality can help unpick disease-specific effects, which are not available from all-cause mortality data.
Low SES in adulthood is a strong risk factor for all illness and particularly CVD mortality (24). Education is sometimes preferred as a measure of SES because it is more stable across the life course, and less susceptible to concerns about reverse causality (25). Separate indicators of SES can be combined into a single latent variable, summarizing their covariance and removing measurement error (providing that measurement errors are not correlated) (26, 27). The latent variable ‘SES’ then represents the shared component of the separate indicators of SES.
Very few studies have examined interactions between personality traits and SES as predictors of CVD mortality. Effect modification (interaction) occurs when the personality-disease association is different at different levels of SES. The influence of traits could be stronger for individuals who are more vulnerable (28), for example, because they have fewer socio-economic resources (22). Studying effect modification in this context is important because it can increase precision in estimating the association between personality traits and mortality. Interactions with sex can also highlight the need to present separate results for males and females if, for example, either one has a greater susceptibility to the hazardous effects of neuroticism. Interactions can also be useful for developing hypotheses about underlying mechanisms, or for defining high-risk groups of the population that might benefit more from targeted interventions. Interactions have also been found between personality and SES for health behaviors and other health outcomes besides
mortality. For example, the association between low SES and psychiatric morbidity was recently found to be stronger at higher levels of neuroticism, in a sample of young Finnish adults (29). In the US Midlife
Development survey (30), lower conscientiousness and higher openness were stronger risk factors for smoking at lower levels of education.
The purpose of the current study was to identify whether SES interacts with personality traits in the HALS study, with particular reference to age and sex differences. We sought to compare all-cause mortality with mortality from the major causes of death (CVD and cancer), in order to unpick disease-specific effects.
Our working hypothesis is that vulnerability to the effects of neuroticism are amplified when
socio-economic resources are limited. Conversely, higher SES might enable adults with high neuroticism to adapt negative emotionality into behaviors that benefit health.
Methods
The Health and Lifestyle Survey (HALS) is a prospective cohort study that began in 1984/85, representative of the United Kingdom population (31). Females, single people and older women were over-represented slightly (3) which principally reflected availability for home visits (31). The sample was nearly identical to the previous UK census in terms of SES (32). The study comprised a home interview, nurse visit and postal questionnaire. The interview lasted approximately one hour and included questions on SES and health behaviors. The nurse visit included measurement of height, weight, blood pressure, lung function, and introduction to the personality questionnaire which was returned separately by post. NHS Central Register data is available for 96.3% of the cohort, providing information about date and cause of death. Ethical approval for the study was received from the BMA Ethical Committee (31).
Measures
Personality traits. Neuroticism and extraversion were measured using the Eysenck Personality Inventory
(EPI)(1). The EPI includes 24 items for each trait, counterbalanced with reversed keyed items to reduce the impact of acquiescent responding. Example items include ‘Does your mood often go up and down?’ and ‘Would you be very unhappy if you could not see lots of people most of the time?’ Items are rated as yes (1) or no (0), producing a maximum total score of 24 (range 0 to 24) representing higher values of the
personality trait. The internal consistencies (Cronbach alpha) of neuroticism and extraversion are .84 and .76 in the HALS study. One-year test-retest reliabilities in a previous validation study were .84 for neuroticism and .88 for extraversion (1).
Socio-economic status (SES). Three indicators of SES were used: educational attainment; occupational
social class; and income grouping. Occupational social class was coded to range from 1 (lowest) to 6 (highest), following the Registrar General classification scheme (33). Married women were classified by their husband’s occupation. Last highest qualification was re-coded into a 6-point scale representing
educational attainment, ranging from 0 (no education) to 5 (degree level or higher). Household income categories were coded on a 12-point scale ranging from 1 (lowest) to 12 (highest). All three indicators were combined into a single latent variable, reducing measurement error associated with any single indicator and allowing cases with missing data on one or two indicators to be included in the analysis. The latent variable was standardized to have a mean of zero and a standard deviation of one.
Health behaviors. Cigarette smoking was recorded as the number of cigarettes smoked daily. Weekly
alcohol consumption was recorded as part of an interviewer-administered drinking diary, referring to the previous seven days starting with yesterday. The drink diaries were converted into standard units of alcohol (1 unit = half a pint of beer, a single measure of spirits, 1 glass of wine or equivalent). Saturated fat intake (grams per week) were calculated by calibrating a food frequency questionnaire (FFQ) against a weighed national dietary survey (34). Example items from the FFQ include ‘green vegetables’ and ‘sweets,
chocolates’ recoded on a six-point scale ranging from 0 (never) to more than once a day (5). Participation in vigorous physical activities was self-reported and converted into average minutes daily. All four health behaviors were treated as continuous variables.
Physiological variables. Body mass index (kg/m2; hereafter BMI) was derived from height and weight
measurements. Height was measured using a portable stadiometer and weight using portable scales provided by the nurse. Systolic (SBP) and diastolic blood pressure (DBP) recordings (mmHg) were taken as the lowest of four serial recordings made at one minute intervals, using an automatic blood pressure monitor. A portable electronic spirometer was used to measure forced expiratory volume (in litres) in one second (FEV1). FEV1 is considered an index of lung function and is strongly associated with physical health status (35). FEV1 values are divided by height squared in meters, to adjust for individual differences in body size.
Vital status statistics. Vital status was provided by death certificates from the UK National Health Service
Central Register at the Office of National Statistics Southport, up to June 2009. The Ninth International Classification of Diseases (ICD9) method was used to identify the single underlying cause of death. Cardiovascular disease (CVD) mortality was represented by ICD9 codes 390 to 459, cancer mortality by codes 140 to 208.
Statistical Methods
Survival time was taken from study induction in 1984/1985 until death, loss to follow-up, or end of mortality surveillance (June 2009), whichever came first. Cox proportional hazards regression analysis was performed in Mplus version 6.2 (36), using the maximum likelihood with robust standard errors (MLR) estimator. Estimates were used to calculate hazards ratios (HR), 95% confidence intervals (CI) and p values for estimated change in mortality risk for each standard deviation (SD) change in neuroticism and
extraversion. Age was centred at age 46. Supplementary analyses (not shown) showed that taking competing risks into account in order to compare cumulative incidences using the Fine & Gray method yields very similar results to that from the Cox model (37) (38). This is because the rate of competing risks is small in this population, and not very strongly related to the exposures of interest. The Cox model, by censoring observations at time of non-CVD death, is therefore the most appropriate way to estimate the relative hazard in the presence of competing risks, providing an unbiased estimate of the HR.
Preliminary analyses identified a significant neuroticism*SES*sex interaction term by including the individual effects of each variable in a model that also contained their product terms. The
neuroticism*SES*sex interaction was significant for CVD mortality (p = 0.04), with no significant interactions for all-cause (p = 0.22) or cancer (p = 0.56) mortality. Males and females were therefore
analysed separately for CVD mortality, together for all-cause and cancer mortality. For reference, the results for all-cause and cancer mortality separated by sex are available as online supplementary material. Estimates were adjusted for age, age squared and extraversion. Interactions with age allowed the associations for traits and SES to vary with age. This allowed us to analyse all participants together rather than separating into age groups, which would reduce statistical power (39). To evaluate the effect of adjusting for possible
confounding factors and covariates on the interaction term for CVD mortality in females, the percentage attenuation for the interaction term was calculated using the formula 100*[(Bage and sex adjusted-Bage, sex and covariate adjusted)/Bage and sex adjusted]. The possible impact of reverse causality was addressed using a washout period that involves reanalysis of data excluding participants who died within the first five years of personality testing. The decision to model SES as a single latent variable could potentially ignore specific or stronger
contributions made by its individual indicators of SES (occupational social class, educational attainment and income). Therefore, analyses were repeated comparing each single indicator of SES, to identify which indicator had the strongest association with mortality. Finally, the possible influence of outliers on interaction terms was evaluated in SPSS Cox Regression with bootstrap replicates, for the occupational social class indicator.
Results
The analytic sample comprised 5450 study members (2505 males), after excluding 666 participants not registered for mortality surveillance, or those without data on predictor variables or covariates.
Participants excluded from the analytic sample were slightly older (OR = 1.003, 95% CI 1.001, 1.006, p = .01) and males were less likely to be excluded (OR = 0.75, 95% CI 0.69, 0.82). Mortality was higher among those excluded (35.1% vs. 30.2%, p <.01). Table 1 shows the descriptive statistics for the study variables, separated by sex. Of the 804 deaths, 441/395 (49.3/49.1%) were CVD and 254/225 (28.4/28.0%) were cancer deaths in males/females. Traditional chi-square derived fit indices are not available for Cox
regression with latent variables. To illustrate goodness of fit of the measurement model for SES as a latent variable in principle, we chose a continuous variable (BMI) and regressed this on the latent variable in preliminary analyses (χ²(2) = 11.17 p = .004, CFI = .995, TLI = .99, SRMR = .01). Fit was similarly good, regardless of the continuous variable chosen. The standardized factor loadings were .60 for social class, .68 for educational attainment and .54 for income.
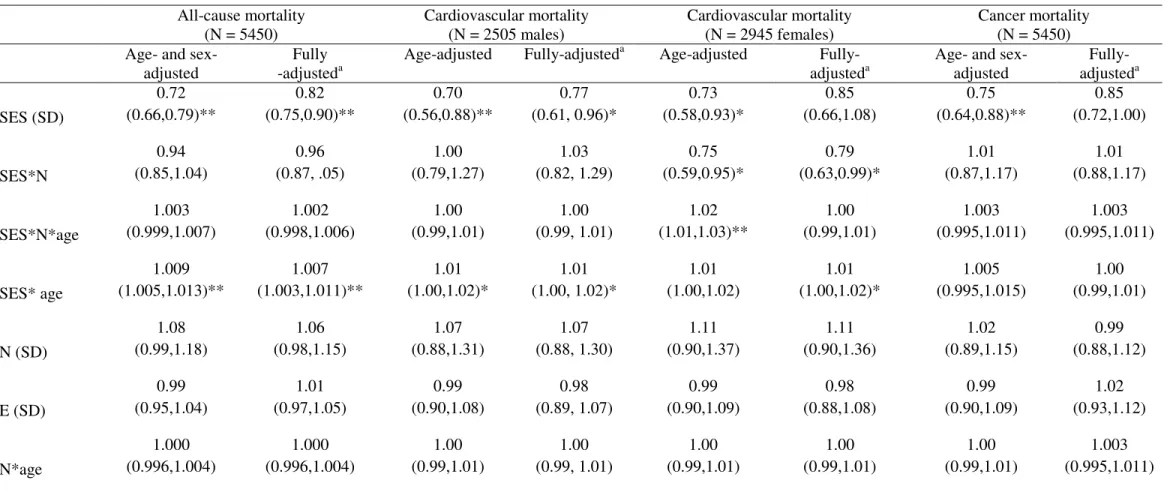
Table 2 shows the hazard ratios for all-cause, CVD and cancer mortality associated with 1 SD
increase in neuroticism and extraversion, unadjusted for age, SES or any other covariate. These estimates are for illustrative purposes only, and illustrate the importance of adjusting for relevant confounding factors, possible mediators and effect modifiers. Table 3 shows the hazard ratios for all-cause, CVD and cancer mortality associated with each exposure (neuroticism, SES, age) and interaction terms (neuroticism*SES, neuroticism*SES*age, neuroticism*age, SES*age) after adjusting for age and sex, and in fully-adjusted models. There was no association between extraversion and mortality from all causes, CVD or cancer, either for the whole sample or when males and females were separated. Similarly, there were no significant
risk of all-cause (HR = 0.72, 95% CI 0.66, 0.79), CVD (HR for males = 0.70, 95% CI 0.56, 0.88; HR for females = 0.73, 95% CI 0.58, 0.93) and cancer (HR = 0.75, 95% CI 0.64, 0.88) mortality, with little attenuation in fully adjusted models except for cancer mortality where SES was no longer significant. The interaction between SES and age indicated that aging increased slightly the association between SES and all-cause (HR = 1.009, 95% CI 1.005, 1.013), similarly for CVD but not cancer mortality.
An interaction between neuroticism and SES was observed specifically for CVD mortality in females (HR = 0.75, 95% CI 0.59, 0.95), which remained significant in the fully adjusted model (HR = 0.79, 95% CI 0.63,0.99). The interaction is illustrated in Figure 1, which shows the estimated log hazard ratio (y axis) at different levels of neuroticism (x axis) and SES (three separate lines). The lines represent low (1 SD below the mean), average (the mean) and high (1 SD above the mean) SES. By constraining parameters in the model, we estimated the HR for CVD mortality in females for different combinations of being high or low on either risk factor. Compared to females with average SES, those with high neuroticism and low SES combined were at increased risk of CVD mortality (HR = 2.02, 95% CI 1.45, 2.80). Those with high neuroticism and high SES combined were at decreased risk of CVD mortality (HR = 0.61, 95% CI 0.38, 0.97). The overall estimate for the interaction (HR = 0.75, 95% CI 0.59, 0.95) refers to the reduction in relative risk when 1 SD higher neuroticism is combined with 1 SD higher SES.
An effect decomposition analysis (Table 4) showed lung function (12.1% attenuation) and smoking (8.3% attenuation) to have the largest attenuating effect on the interaction term, although none explained it completely. All health behaviours together explained 10.0% and all physiological variables 11.4%. Analysis using a washout period (111 females who died within five years of personality testing) did not change the interaction materially, mitigating concerns about reverse causality.
The effect sizes were remarkably similar across indicators in models using each indicator separately: 1 SD increase in occupational social class (N=2893; HR = 0.81, 95% CI 0.67, 0.99), educational attainment (N = 2934; HR = 0.89, 95% CI 0.73, 1.08) and income (N = 2350; HR = 0.84, 95% CI 0.68, 1.04). The effect sizes were smaller and the confidence intervals were wider because using single indicators increases measurement error, introduces restriction of range (e.g. ceiling effects) and reduces the available sample size, particularly for income. These results suggest that occupational social class interacts most strongly with
neuroticism, followed by income and education. To evaluate the possible impact of outliers and anomalies on the interaction term over sampling variation, we examined the distribution of the interaction coefficient over 1000 bootstrap replicates using SPSS Cox Regression using the occupational social class model (bias = .008; HR = 0.80, 95% CI 0.66, 0.98, p = .04). This suggests that the interaction was stable and not
influenced strongly by outliers.
Discussion
The main finding of this study was that socio-economic status (SES) interacted with neuroticism to influence cardiovascular disease mortality (CVD) risk in a representative sample of adult females, over a follow-up period of 25-years. The combination of low SES and high neuroticism increased the risk of CVD mortality, compared to average levels of either variable. In contrast, the combination of high SES and high neuroticism decreased the risk. The interaction effect was not explained by health behaviors, physiological variables, the decision to use three indicators of SES as a latent variable, multivariate outliers or competing risks. These results extend a previous report, that neuroticism is associated with CVD mortality in older adults (males and females), before adjusting for health behaviors and physiological variables (3). Here, we demonstrate for the first time that SES modifies the risk among females and that this effect modification is not attenuated following adjustment for confounding or proposed mediating variables. The interaction was specific to CVD mortality in females.
Strengths of the study include the large sample size, long follow-up time of 25 years and largely representative sample covering the entire adult age range. Personality traits were measured using reliable and validated instruments, and SES was measured using three indicators in order to reduce measurement error and make full use of all available data. We conducted sensitivity analyses to rule out the possibility of reverse causality, and to mitigate concerns that the choice of indicator influenced the findings. The latent variable approach represents the commonality among the three indicators (occupational social class,
educational attainment and income) but does not appear to suffer from loss of unique contribution from any one indicator – patterns were consistent, but weaker, when using one indicator only. Results were
comparable when using women’s own educational attainment, and when using indicators that relied upon their husband’s occupation for married women. Taken together, results suggest that summarizing a wide
range of socio-economic resources best captured the protective effect of SES, although social class may have a larger effect size for an interaction with neuroticism. Future research should involve replicating the interaction in other cohorts, identifying explanations for this interaction, and reasons why it appeared to be specific to females.
Limitations of the study include the lack of information about openness to experience, agreeableness and conscientiousness – other traits in the comprehensive ‘big five’ model of personality that may also influence mortality (7, 8, 10, 14-16, 21-23, 30). Additionally, we were not able to control for more recently established CVD risk factors such as C-reactive protein (CRP) (11, 40). Since neuroticism is associated with inflammation (41) it will be important to consider inflammatory markers such as CRP and interleukin-6 in future studies. Another limitation is that a small number of participants considered economically inactive (e.g. students, armed forces) may have been excluded from the analysis because they did not have data on occupational social class. They were included if data was available on at least one other indicator. Women whose occupation was higher than a husband’s occupation may have been misclassified as having lower occupational social class. Although females tend to have higher neuroticism scores, the variability is similar in males and females (Table 1) and so controlling for sex or stratifying by sex should address concerns that higher female mean scores might influence the effect. Finally, despite the broadly representative nature of the sample, the analysis may contain survivor effects. Older participants in the population who survived until the study inception were more likely to be healthy. This could lead to underestimation of the association between neuroticism, SES and CVD mortality.
Our results are comparable to existing reports that neuroticism is associated with CVD mortality, although given the paucity of published findings on cause-specific mortality, and interactions with SES, they should be regarded as tentative at this time. In the Baltimore Longitudinal Study of Aging (16), high neuroticism and low extraversion were associated with all-cause mortality risk and neuroticism was associated with CVD mortality risk. This report was based on a smaller number of CVD deaths (N = 321) and was not evaluated at different levels of SES. The effect size was not directly comparable with our findings because it was based on unit increases in neuroticism rather than standard units (HR = 1.02, 95% CI 1.01 to 1.04) and was evaluated at the mean SES for the cohort. The association between neuroticism and CVD mortality
remained significant following adjustment for smoking and obesity, consistent with our analyses which additionally controlled for other health behaviors and physiological variables. We did not find an association between extraversion and CVD mortality for males or females, nor when evaluated at different levels of SES. It is also important to note the neuroticism as measured in the EPI (1) has a stronger focus on emotional reactivity, nervous tension/psychasthenia and somatic-sensitivity/hypochondriasis than more recently developed measures of neuroticism, which consider negative emotionality more generally. These differences may contribute to inconsistent findings across cohorts. Our findings differ from the Terman cohort, where mean SES was relatively high and neuroticism was associated with decreased risk of all-cause mortality in men and increased risk in women (42).
It is also important to note differences between our analytic strategy and a previous report from the HALS study (3) showing that neuroticism was associated with all-cause and CVD mortality for both sexes and all ages combined, but not when the sample was divided into age groups and the estimate was adjusted for health behaviors and physiological variables. This finding is not comparable directly with the results
reported here, because there are additional years of follow-up (from 21 to 25 years), additional indicators of SES (the previous report utilized occupational social class and education but not income), a different analytic sample and no division into age groups. We did see the same main effect of neuroticism and all-cause mortality although this was not statistically significant in our analyses (Table 3).
There is comparatively little research on personality traits, SES and CVD mortality (2). It will be
particularly important to replicate the interaction and identify reasons why an interaction might be present in females but not in males. Our results underscore the importance of screening for interaction terms in models that attempt to describe the association between personality and mortality risk, particularly by sex and SES. As shown in Figure 1, ignoring significant effect modification (interaction) would have led to the
simultaneous underestimation and overestimation of the impact of neuroticism at low and high levels of SES respectively – the risk was increased for high SES women and decreased for low SES women. Large sample sizes with sufficient numbers of CVD deaths are required for adequate statistical power, although there has been recent debate about the utility of reporting results from smaller studies if they can inform larger ones in the future (43).
Understanding if and why psychological traits interact with SES to influence health inequalities is important because it will further our understanding of health inequalities and better inform strategies for intervention. Interactions between neuroticism and SES might help explain why results have been sometimes inconsistent across studies. Those with greater socio-economic resources might adapt their neuroticism into practical strategies that improve health, such as seeking advice (16), requesting tests and results from screening programs (44) reporting symptoms more frequently, and monitoring lifestyle more closely (45). In the absence of such resources, maladaptive responses such as chronic stress, smoking and avoiding health information might appear more attractive. The interaction we report could be regarded as evidence supporting the concept of healthy neuroticism. Neuroticism can lead people down to different pathways, one maladaptive (e.g. substance abuse) and the other adaptive (e.g. undergoing tests to reveal CVD risk) (46). The results also support the vulnerability modelin which low SES increases CVD risk more strongly in vulnerable persons, as defined by a personality phenotype (28). If the socio-economic profile of samples is particularly high, this might produce protective effects for neuroticism that do not reflect the pattern when SES is low. This hypothesis can be tested in future research, by checking whether CVD risk factors accumulate more strongly in low SES women high in neuroticism. It would also be useful to ask low vs. high SES women who have high levels of neuroticism what action they take when worrying about health (e.g. comfort eating, health checks) and then consider the CVD risk associated with these strategies; a form of ‘healthy neuroticism’. From an evolutionary perspective, neuroticism has not been selected out of the population which means that it may have adaptive benefits for some people and in specific situations (47). We emphasize however, the importance of first replicating the interaction we report here. Analyses should begin by checking whether the risk associated with personality traits is different for different
economic groups within a study and for different sexes. Neuroticism may be protective when socio-economic conditions are favourable, hazardous when combined with socio-socio-economic deprivation. Understanding such interactions could help reduce health inequalities and improve public health.
Figure caption
Figure I. Estimated log hazard ratio for cardiovascular disease (CVD) mortality risk at different levels of
References
1. Eysenck SB, Eysenck HJ: An improved short questionnaire for the measurement of extraversion and neuroticism. Life Sciences 3:1103-1109, 1964
2. Deary I, Weiss A, Batty D: Intelligence and Personality as Predictors of Illness and Death. Psychological Science in the Public Interest 11:53-79, 2010
3. Shipley BA, Weiss A, Der G, Taylor MD, Deary IJ: Neuroticism, Extraversion, and Mortality in the UK Health and Lifestyle Survey: A 21-Year Prospective Cohort Study. Psychosomatic Medicine 69:923-931, 2007
4. Brummett B, Helms M, Dahlstrom G, Siegler I: Prediction of all-cause mortality by the Minnesota Multiphasic Personality Inventory Optimism-Pessimism Scale scores: study of a college sample during a 40-year follow-up period. Mayo Clinic proceedings.Mayo Clinic 81:1541-1544, 2006 5. Martin P, da Rosa G, Siegler IC: Personality and longevity: findings from the Georgia Centenarian
Study. Age 28:343-352, 2006
6. Wilson RS, Krueger KR, Gu L, Bienias JL, Mendes de Leon CF, Evans DA: Neuroticism, Extraversion, and Mortality in a Defined Population of Older Persons. Psychosomatic Medicine 67:841-845, 2005
7. Christensen AJ, Ehlers SL, Wiebe JS, Moran PJ, Raichle K, Ferneyhough K, Lawton WJ: Patient personality and mortality: a 4-year prospective examination of chronic renal insufficiency. Health psychology 21:315-320, 2002
8. Weiss A, Costa: Domain and Facet Personality Predictors of All-Cause Mortality Among Medicare Patients Aged 65 to 100. Psychosomatic Medicine 67:724-733, 2005
9. Korten AE, Jorm AF, Jiao Z, Letenneur L, Jacomb PA, Henderson AS, Christensen H, Rodgers B: Health, cognitive, and psychosocial factors as predictors of mortality in an elderly community sample. Journal of Epidemiology and Community Health 53:83-88, 1999
10. Masui Y, Gondo Y, Inagaki H, Hirose N: Do personality characteristics predict longevity? Findings from the Tokyo centenarian study. Age 28:353-361, 2006
11. Almada SJ, Zonderman AB, Shekelle RB, Dyer AR, Daviglus ML, Costa PT, Stamler J: Neuroticism and cynicism and risk of death in middle-aged men: the Western Electric Study. Psychosomatic Medicine 53:165-175, 1991
12. Huppert FA, Whittington JE: Symptoms of psychological distress predict 7-year mortality. Psychological Medicine 25:1073-1086, 1995
13. Maier H, Smith J: Psychological predictors of mortality in old age. Journals of Gerontology Series B: Psychological Sciences and Social Sciences 54:P44-54, 1999
14. Wilson R, Mendes, Bienias J, Evans D, Bennett D: Personality and mortality in old age. The Journals of Gerontology Series B: Psychological Sciences and Social Sciences 59:P110-P116, 2004
15. Friedman HS, Tucker JS, Tomlinsonkeasey C, Schwartz JE, Wingard DL, Criqui MH: Does childhood personality predict longevity? Journal of Personality and Social Psychology 65:176-185, 1993
16. Terracciano A, Lockenhoff CE, Zonderman AB, Ferrucci L, Costa PT: Personality predictors of longevity: Activity, emotional stability, and conscientiousness. Psychosomatic Medicine 70:621-627, 2008
17. Weiss A, Gale CR, Batty GD, Deary IJ: Emotionally Stable, Intelligent Men Live Longer: The Vietnam Experience Study Cohort. Psychosomatic Medicine 71:385-394, 2009
18. Grossardt BR, Bower JH, Geda YE, Colligan RC, Rocca WA: Pessimistic, Anxious, and Depressive Personality Traits Predict All-Cause Mortality: The Mayo Clinic Cohort Study of Personality and Aging. Psychosomatic Medicine 71:491-500, 2009
19. Mroczek DK, Spiro A, Turiano NA: Do health behaviors explain the effect of neuroticism on mortality? Longitudinal findings from the VA Normative Aging Study. Journal of Research in Personality 43:653-659, 2009
20. Mroczek DK, Spiro A: Personality change influences mortality in older men. Psychological Science 18:371-376, 2007
21. Taylor MD, Whiteman MC, Fowkes GR, Lee AJ, Allerhand M, Deary IJ: Five Factor Model Personality Traits and All-Cause Mortality in the Edinburgh Artery Study Cohort. Psychosomatic Medicine 71:631-641, 2009
22. Chapman BP, Fiscella K, Kawachi I, Duberstein PR: Personality, Socioeconomic Status, and All-Cause Mortality in the United States. American Journal of Epidemiology 171:83-92, 2010
23. Iwasa H, Masui Y, Gondo Y, Inagaki H, Kawaai C, Suzuki T: Personality and all-cause mortality among older adults dwelling in a Japanese community: A five-year population-based prospective cohort study. American Journal of Geriatric Psychiatry 16:399-405, 2008
24. Kaplan GA, Keil JE: Socioeconomic factors and cardiovascular disease: a review of the literature. Circulation 88:1973-1998, 1993
25. Singh GK, Siahpush M: Increasing inequalities in all-cause and cardiovascular mortality among US adults aged 25-64 years by area socioeconomic status, 1969-1998. International Journal of
Epidemiology 31:600-613, 2002
26. Hagger-Johnson G, Shickle D, Deary I, Roberts B: Direct and Indirect Pathways Connecting Cognitive Ability With Cardiovascular Disease Risk: Socioeconomic Status and Multiple Health Behaviors. Psychosomatic Medicine 72:777-785, 2010
27. Bollen KA, Glanville JL, Stecklov G: Socio-economic status, permanent income, and fertility: A latent-variable approach. Population Studies-a Journal of Demography 61:15-34, 2007
28. Elovainio M, Kivimaki M, Kortteinen M, Tuomikoski H: Socioeconomic status, hostility and health. Personality and Individual Differences 31:303-315, 2001
29. Jokela M, Keltikangas-Järvinen L: The association between low socioeconomic status and depressive symptoms depends on temperament and personality traits. Personality and Individual Differences In Press, Corrected Proof
30. Chapman B, Fiscella K, Duberstein P, Kawachi I: Education and smoking: confounding or effect modification by phenotypic personality traits? Annals of behavioral medicine : a publication of the Society of Behavioral Medicine 38:237-248, 2009
31. Cox BD: Health and Lifestyle Survey, 1984-1985 (HALS1) User Manual. Essex/Manchester, Economic and Social Data Service, 1988
32. Batty GD, Gale CR: Impact of resurvey non-response on the associations between baseline risk factors and cardiovascular disease mortality: prospective cohort study. Journal of Epidemiology and Community Health 63:952-955, 2009
33. Office of Population Censuses and Surveys: Classification of Occupations 1980. London, HMSO, 1980
34. Boniface DR, Tefft ME: The application of structural equation modelling to the construction of an index for the measurement of health-related behaviours. The Statistician 46:505-514, 1997
35. Singh-Manoux A, Dugravot A, Kauffmann F, Elbaz A, Ankri J, Nabi H, Kivimaki M, Sabia S: Association of lung function with physical, mental and cognitive function in early old age. Age:1-8, in press
36. Muthén LKaM, B.O.: Mplus User’s Guide. Los Angeles, CA, Muthén & Muthén, 1998-2010 37. Fine J, Gray R: A Proportional Hazards Model for the Subdistribution of a Competing Risk. Journal
of the American Statistical Association 94:496-509, 1999
38. Lau B, Cole SR, Gange SJ: Competing Risk Regression Models for Epidemiologic Data. American Journal of Epidemiology 170:244-256, 2009
39. Babyak M: What you see may not be what you get: a brief, nontechnical introduction to overfitting in regression-type models. Psychosomatic Medicine 66:411-421, 2004
40. Mottillo S, Filion K, Genest J, Joseph L, Pilote L, Poirier P, Rinfret S, Schiffrin E, Eisenberg M: The Metabolic Syndrome and Cardiovascular Risk: A Systematic Review and Meta-Analysis. J Am Coll Cardiol 56:1113-1132, 2010
41. Sutin AR, Terracciano A, Deiana B, Naitza S, Ferrucci L, Uda M, Schlessinger D, Costa PT: High neuroticism and low conscientiousness are associated with interleukin-6. Psychological medicine 40:1485-1493, 2010
42. Friedman H, Kern M, Reynolds C: Personality and health, subjective well-being, and longevity. Journal of Personality 78:179-216, 2010
43. Jewett L, Newton E, Smith S, Thombs B: Time to abandon small-sample cohort research in health psychology? Health psychology 29, 2010
44. Johnson MO: Personality correlates of HIV vaccine trial participation. Personality and Individual Differences 29:459-467, 2000
45. Williams P, Colder C, Lane J, McCaskill C, Feinglos M, Surwit R: Examination of the Neuroticism-Symptom Reporting Relationship in Individuals with Type 2 Diabetes. Personality and Social Psychology Bulletin 28:1015-1025, 2002
46. Friedman HS: Long-term relations of personality and health: Dynamisms, mechanisms, tropisms. Journal of Personality 68:1089-1107, 2000
47. Nettle D: The evolution of personality variation in humans and other animals. The American psychologist 61:622-631, 2006
Table 1. Descriptive Statistics for the Analytic Sample (N = 5450) Females (N =2945) Males (N =2505) Mean (SD) N Mean (SD) N P† Age (years) 45.96 (16.76) 2945 46.41 (17.30) 2505 .18 Neuroticism (range 0 to 24) 10.66 (4.90) 2945 8.40 (4.94) 2505 <.001 Extraversion (range 0 to 24) 12.65 (4.26) 2945 12.32 (4.36) 2505 .002 Social class (range 1 to 6) 3.55 (1.31) 2893 3.49 (1.29) 2467 .01 Education (range 1 to 5) 1.66 (1.95) 2934 1.99 (2.05) 2488 <.001 Income (range 1 to 12) 5.32 (2.56) 2350 5.79 (2.53) 2132 <.001 Cigarettes smoked daily 4.73 (8.30) 2945 5.87 (9.90) 2505 <.001 Alcohol units (weekly) 3.74 (6.26) 2945 14.66 (19.21) 2505 <.001 Saturated fat (g/week) 230.53 (97.75) 2945 323.11 (136.95) 2505 <.001 Physical activity (minutes/day) 8.78 (21.51) 2945 13.58 (30.30) 2505 <.001 Lung function (FEV1, litres) 2.32 (0.70) 2945 3.12 (1.00) 2505 <.001 Systolic blood pressure (mmHg) 123.22 (19.12) 2945 129.15 (16.41) 2505 <.001 Diastolic blood pressure (mmHg) 74.11 (11.95) 2945 77.91 (11.15) 2505 <.001 Body Mass Index (BMI, kg/m2) 24.29 (4.35) 2945 24.82 (3.65) 2505 <.001
Deaths N (% of female sample) N (% of male sample)
All-cause mortality 804 (27.3%) 895 (35.7%)
Cardiovascular disease mortality 395 (13.4%) 441 (17.6%)
Cancer mortality 225 (7.6%) 254 (10.1%)
Table 2. Crude (Unadjusted) Hazard Ratios (95% Confidence Intervals) for Personality Traits and All-Cause, Cardiovascular and Cancer Mortality. All-cause mortality Cardiovascular mortality Cancer mortality
Total Male Female Total Male Female Total Male Female Neuroticism (SD) 0.90 (0.86,0.95)** 0.95 (0.89,1.01) 0.93 (0.86,0.99)* 0.89 (0.83,0.96)** 0.92 (0.83,1.01) 0.94 (0.85,1.04) 0.90 (0.82,0.99)* 0.95 (0.83,1.09) 0.93 (0.81,1.06) Extraversion (SD) 1.34 (1.28,1.40)** 1.38 (1.29,1.46)** 1.31 (1.22,1.40)** 1.37 (1.28,1.47)** 1.41 (1.29,1.55)** 1.34 (1.21,1.47)** 1.26 (1.16,1.38)** 1.28 (1.14,1.44)** 1.26 (1.10,1.43)**
Note. The hazard ratios in this table are for illustrative purposes only; they are not adjusted for age, sex or any other covariate. N = Neuroticism, E = Extraversion. *=p<.05, **=p<.01.
Table 3. Hazard Ratios (95% Confidence Intervals) for Personality Traits, Socio-Economic Status and All-Cause, Cardiovascular and Cancer Mortality. All-cause mortality (N = 5450) Cardiovascular mortality (N = 2505 males) Cardiovascular mortality (N = 2945 females) Cancer mortality (N = 5450) Age- and
sex-adjusted
Fully -adjusteda
Age-adjusted Fully-adjusteda Age-adjusted Fully-
adjusteda
Age- and sex-adjusted Fully-adjusteda SES (SD) 0.72 (0.66,0.79)** 0.82 (0.75,0.90)** 0.70 (0.56,0.88)** 0.77 (0.61, 0.96)* 0.73 (0.58,0.93)* 0.85 (0.66,1.08) 0.75 (0.64,0.88)** 0.85 (0.72,1.00) SES*N 0.94 (0.85,1.04) 0.96 (0.87, .05) 1.00 (0.79,1.27) 1.03 (0.82, 1.29) 0.75 (0.59,0.95)* 0.79 (0.63,0.99)* 1.01 (0.87,1.17) 1.01 (0.88,1.17) SES*N*age 1.003 (0.999,1.007) 1.002 (0.998,1.006) 1.00 (0.99,1.01) 1.00 (0.99, 1.01) 1.02 (1.01,1.03)** 1.00 (0.99,1.01) 1.003 (0.995,1.011) 1.003 (0.995,1.011) SES* age 1.009 (1.005,1.013)** 1.007 (1.003,1.011)** 1.01 (1.00,1.02)* 1.01 (1.00, 1.02)* 1.01 (1.00,1.02) 1.01 (1.00,1.02)* 1.005 (0.995,1.015) 1.00 (0.99,1.01) N (SD) 1.08 (0.99,1.18) 1.06 (0.98,1.15) 1.07 (0.88,1.31) 1.07 (0.88, 1.30) 1.11 (0.90,1.37) 1.11 (0.90,1.36) 1.02 (0.89,1.15) 0.99 (0.88,1.12) E (SD) 0.99 (0.95,1.04) 1.01 (0.97,1.05) 0.99 (0.90,1.08) 0.98 (0.89, 1.07) 0.99 (0.90,1.09) 0.98 (0.88,1.08) 0.99 (0.90,1.09) 1.02 (0.93,1.12) N*age 1.000 (0.996,1.004) 1.000 (0.996,1.004) 1.00 (0.99,1.01) 1.00 (0.99, 1.01) 1.00 (0.99,1.01) 1.00 (0.99,1.01) 1.00 (0.99,1.01) 1.003 (0.995,1.011)
Note. aAdjusted for age in years (centered at age 46), age squared, sex (all-cause and cancer mortality), smoking, alcohol drinking, saturated fat intake and physical activity, body mass index, systolic blood pressure, diastolic blood pressure, forced expiratory volume in 1 second. SES = socio-economic status (1 SD increase in latent variable with social class, education and income as indictors), N = Neuroticism, E = Extraversion. *=p<.05, **=p<.01.
24
24 Table 3. Attenuation of the Interaction Term (Neuroticism*SES) in Females for
Cardiovascular Mortality Following Individual Adjustment for Candidate Explanatory Variables.
N = 2945 Beta for Neuroticism*SES
interaction term
% attenuation† Reference model (age- and sex-adjusted) -0.29
Cigarettes smoked daily -0.27 8.3%
Alcohol units (weekly) -0.30 -3.8%
Saturated fat (g/week) -0.29 -1.4%
Physical activity (minutes/day) -0.28 3.1%
Lung function (FEV1, litres) -0.25 12.1%
Systolic blood pressure (mmHg) -0.28 3.8%
Diastolic blood pressure (mmHg) -0.29 1.4%
Body Mass Index (BMI, kg/m2) -0.29 -0.7%
All health behaviors together -0.26 10.0%
All physiological variables together -0.26 11.4%
Fully adjusted -0.24 16.3%
Washout analysis†† (N = 2834) -0.28 3.5%
*=p<.05, **=p<.01.†Calculated using the formula 100*[(Bage and sex adjusted-Bage, sex and covariate adjusted)/Bage and sex adjusted.] with age centered at 46. ††Analysis repeated after removing 111 females who died within five years of personality assessment.
25
25
Online Supplementary Table. Hazard Ratios (95% Confidence Intervals) for Personality
Traits, Socio-Economic Status and All-Cause and Cancer Mortality, Reported Separately for Males and Females.
All-cause mortality (N = 2505 males) All-cause mortality (N = 2945 females) Cancer mortality (N = 2505 males) Cancer mortality (N = 2945 females) Age-adjusted Fully -adjusteda Age-adjusted Fully -adjusteda Age-adjusted Fully -adjuste da Age-adjusted Fully -adjuste da SES (SD) 0.73 (0.65,0.83) ** 0.82 (0.730.93 )** 0.73 (0.63,0.8 4)** 0.84 (0.730.9 7)* 0.77 (0.62,0. 95)* 0.86 (0.691. 07) 0.75 (0.59,0. 96)* 0.87 (0.671. 11) SES*N 0.97 (0.84,1.12) 0.99 (0.871.13 ) 0.91 (0.79,1.0 4) 0.94 (0.821.0 7) 1.05 (0.83,1. 34) 1.06 (0.841. 35) 0.96 (0.79,1. 17) 0.97 (0.801. 17) SES*N* age 1.001 (0.995,1.00 7) 1.001 (0.9951.0 07) 1.004 (0.998,1. 010) 1.002 (0.9961. 008) 1.00 (0.99,1. 01) 1.00 (0.991. 01) 1.00 (0.99,1. 01) 1.00 (0.991. 01) SES* age 1.008 (1.002,1.01 4)** 1.006 (1.0001.0 12)* 1.01 (1.00,1.0 2)** 1.006 (1.0001. 012) 1.00 (0.99,1. 01) 1.00 (0.981. 01) 1.01 (1.00,1. 03) 1.01 (0.991. 02) N (SD) 1.11 (0.99,1.25) 1.09 (0.971.22 ) 1.07 (0.95,1.2 1) 1.06 (0.941.1 8) 1.08 (0.89,1. 32) 1.05 (0.861. 27) 0.92 (0.78,1. 09) 0.90 (0.771. 06) E (SD) 0.99 (0.93,1.05) 1.00 (0.951.06 ) 1.00 (0.94,1.0 7) 1.01 (0.951.0 8) 0.96 (0.85,1. 10) 0.99 (0.871. 13) 1.03 (0.90,1. 18) 1.07 (0.921. 23) N*age 0.998 (0.992,1.00 4) 0.999 (0.9931.0 05) 1.00 (0.99,1.0 1) 0.999 (0.9931. 005) 1.00 (0.99,1. 01) 1.00 (0.991. 01) 1.01 (1.00,1. 02) 1.01 (1.001. 02)
Note. aAdjusted for age in years (centered at age 46), age squared, smoking, alcohol drinking, saturated fat intake and physical activity, body mass index, systolic blood pressure, diastolic blood pressure, forced expiratory volume in 1 second. SES = socio-economic status (1 SD increase in latent variable with social class, education and income as indictors), N = Neuroticism, E = Extraversion. *=p<.05, **=p<.01.


![[PDF] Cours général pour débuter avec le logiciel Ciel Devis Factures | Cours informatique](data:image/gif;base64,R0lGODlhAQABAIAAAP///wAAACH5BAEAAAAALAAAAAABAAEAAAICRAEAOw==)