HAL Id: hal-02895278
https://hal.archives-ouvertes.fr/hal-02895278
Submitted on 10 May 2021
HAL is a multi-disciplinary open access
archive for the deposit and dissemination of
sci-entific research documents, whether they are
pub-lished or not. The documents may come from
teaching and research institutions in France or
abroad, or from public or private research centers.
L’archive ouverte pluridisciplinaire HAL, est
destinée au dépôt et à la diffusion de documents
scientifiques de niveau recherche, publiés ou non,
émanant des établissements d’enseignement et de
recherche français ou étrangers, des laboratoires
publics ou privés.
Relationships between MODIS and ATSR fires and
atmospheric variability in New Caledonia (SW Pacific)
Renaud Barbero, Vincent Moron, Morgan Mangeas, Marc Despinoy, Christelle
Hély
To cite this version:
Renaud Barbero, Vincent Moron, Morgan Mangeas, Marc Despinoy, Christelle Hély.
Relation-ships between MODIS and ATSR fires and atmospheric variability in New Caledonia (SW Pacific).
Journal of Geophysical Research: Atmospheres, American Geophysical Union, 2011, 116 (D21),
�10.1029/2011JD015915�. �hal-02895278�
Relationships between MODIS and ATSR fires and atmospheric
variability in New Caledonia (SW Pacific)
Renaud Barbero,
1Vincent Moron,
1,2,3Morgan Mangeas,
4Marc Despinoy,
4and Christelle Hély
1Received 4 March 2011; revised 21 July 2011; accepted 18 August 2011; published 11 November 2011.
[1]
We examined the relationships between fires detected by the Along Track Scanning
Radiometer, algorithm 2 (ATSR
‐2) and the Moderate Resolution Imaging Spectrometer
(MODIS) sensors and local
‐scale atmospheric conditions in New Caledonia (SW
Pacific
∼165.5°E, 21.5°S) during the 1996–2008 (ATSR) and 2000–2008 (MODIS) time
periods. A total of 3707 (MODIS) hotspots, representing 949 distinct fires, and 83
(ATSR) hotspots were observed during the study period. The annual mean frequency
of hotspots peaks around the transition between the dry
‐cool season and the wet‐warm
season, that is, in September
–December, when dry soils and fuels could be combined with
increasing temperatures. The antecedent local
‐scale maximum temperature and rainfall
anomalies recorded at the closest meteorological station were analyzed. While the signal in
maximum temperature is weak and not robust among the fire records, the local
‐scale
anomalies of rainfall are always clearly negative for at least 3 months before the fires
(i.e., between June and December). The Effective Drought Index (EDI), based on rainfall
only, and the Fire Weather Index (FWI), which combines rainfall, temperature, relative
humidity, and wind speed, show similar behaviors before fires. This suggests that a simple
rainfall index, as well as a more comprehensive one, is able to diagnose fire risks. At
interannual time scale, cross
‐correlation analysis reveals that the seasonal June–August
Niño 3.4 sea surface temperature index is strongly correlated (r = 0.78 for a second
‐order
polynomial fit) with the monthly frequency of all MODIS hotspots in September–
December, suggesting a strong potential predictability of fire variations in New Caledonia
with a lead time of 1–4 months.
Citation: Barbero, R., V. Moron, M. Mangeas, M. Despinoy, and C. Hély (2011), Relationships between MODIS and ATSR fires and atmospheric variability in New Caledonia (SW Pacific), J. Geophys. Res., 116, D21110, doi:10.1029/2011JD015915.
1.
Introduction
[2] Spatiotemporal variability of fire reflects a complex
interaction among physical factors, including climate, soil, topography, vegetation, and likely human activities [i.e., Vadrevu, 2008; van der Werf et al., 2008a]. Fires in New Caledonia (NC) have been naturally ignited by lightning before the arrival of first Indonesians circa 3000 years B.P. [Stevenson et al., 2001], but as in other tropical regions, they are now lit almost exclusively by people for a wide range of purposes such as agricultural clearance, hunting, human conflict, vandalism, and negligence [Cochrane, 2003; van der Werf et al., 2008a].
[3] While fire’s ignition is at least partly human driven,
several studies found that regional‐ and global‐scale climate forcings, especially rainfall anomalies related to El Niño– Southern Oscillation (ENSO) phenomena [i.e., Ropelewski and Halpert, 1987, 1996], have a strong impact on the spa-tial and interannual variability of fire occurrences detected by satellites [Fuller and Murphy, 2006; van der Werf et al., 2006, 2008a; Le Page et al., 2008]. Climate also has an indirect long‐term effect through physioecological factors inducing different ecosystem and fuel types (i.e., herbaceous fuel type in savanna versus woody fuels in forest). Rainfall was rec-ognized to be the major climatic driver for fuel production in tropical semiarid regions in the previous wet season in southern Africa [Hély et al., 2003] or even in the previous 3 years in southeastern Arizona [Crimmins and Comrie, 2004]. Soil and fuel moistures are in fact directly related to current and antecedent atmospheric conditions (back to several weeks [Van Wagner, 1987]), and fire risk increases when high temperatures are combined with the absence of rain, strong winds, and/or low absolute vapor pressure [i.e., Stocks et al., 1989]. Climate therefore provides an indirect constraint because land clearing is more efficient when fuels
1
CEREGE, Aix‐Marseille University, Aix‐en‐Provence, France.
2
Institut Universitaire de France, Paris, France.
3
International Research Institute for Climate and Society, Columbia University, Palisades, New York, USA.
4ESPACE‐DEV, Institut de Recherche pour le Développement,
Nouméa, New Caledonia.
Copyright 2011 by the American Geophysical Union. 0148‐0227/11/2011JD015915
are dry [van der Werf et al., 2006, 2008a]. The direct and indirect climatic factors mostly affect propagation, duration, and fire extent.
[4] The climatic forcing of fire is usually analyzed through
two different approaches; (1) an a priori estimation of fire risk and (2) an a posteriori analysis of the relationships among frequency and/or extent of fires and/or burnt areas and observed climate conditions. The first approach is mostly based on daily atmospheric conditions, including usually maximum temperature, water vapor, and/or soil moisture deficits, and wind speed. For example, Dolling et al. [2005] found a strong relationship between the Keetch‐Byram index, based on soil moisture deficit, and fire activity in 1986–1991 in the Hawaiian Islands. Garcia Diez et al. [1994] used dry static stability in 850–700 hPa layer and a satu-ration deficit at 850 hPa to define a fire risk over northern Spain. Amiro et al. [2004] used the daily Fire Weather Index (FWI) to characterize large fires in the Canadian boreal forest, while Crimmins [2006] related daily FWI values in the southwest United States to synoptic circulation patterns and found that 80% of the extreme fire‐weather days were mainly associated with three atmospheric regimes. The second approach is usually based on a correlation analysis between frequency and/or the spatial extent of fire hotspots or burnt areas and regional‐scale rainfall anomalies [Ceccato et al., 2010] or a large‐scale climatic phenomenon as ENSO [i.e., Fuller and Murphy, 2006; Le Page et al., 2008; van der Werf et al., 2008b; Langner and Siegert, 2009]. These authors emphasized especially the regional‐ and global‐scale impacts of ENSO on fire activity, through the modulation of seasonal rainfall anomalies and the length and intensity of dry seasons across the whole tropical zone [Ropelewski and Halpert, 1987, 1996; Kiladis and Diaz, 1989]. Kita et al. [2000] showed that the total ozone concentration associated with forest fires increased over Indonesia during the warm ENSO events of 1994 and 1997. Siegert et al. [2001] indicated that fire emissions in Indonesian logged forests are usually higher during drought years and that the number of active hotspots is closely correlated to the length and intensity of the dry season. A seasonal early warning system has been created by Ceccato et al. [2010] to take early action to mitigate the potential fire impact in Indonesia during hazardous years. They showed that fire frequency is nonlinearly related to monthly rainfall anomalies, which are themselves partly predictable from the Niño 4 sea surface temperature (SST) index with a lead time of two months.
[5] In this study, the relationships between fire frequency,
recorded by two different satellites (the Moderate Resolution Imaging Spectroradiometer (MODIS) and the Along Track Scanning Radiometer (ATSR)), and atmospheric conditions are analyzed over New Caledonia. This archipelago com-prises a main NW‐SE elongated island of 400 km × 50 km centered near 165°E and 22°S and secondary islands in the SW Pacific (Figure 1). The moderate air temperatures are typical of a subtropical oceanic climate (Figure 1c). In par-ticular, daily maximum temperatures higher than 35°C are extremely rare (less than 0.5% of available data from 1996). The mean annual rainfall increases from less than 1000 mm on the leeward west coast to more than 2800 mm on the windward east coast, in relation to the orographic forcing of the dominant ESE Alizean flow by the central range of
mountains (700–900 m above sea level (asl) on average with summits higher than 1600 m asl; Figures 1a and 1b) [i.e., Leroy, 2006; Lefèvre et al., 2010]. Austral winter and spring (from June to November) are relatively dry, especially in the north, because of the subsidence associated with tropical anticyclones. However, light to moderate rainfalls still occur, driven by orographic forcing of the Alizean flow along the windward coast, and with tropical‐extratropical interactions and extratropical disturbances, mostly in the south. Annual rainfall peaks from December to April (Figure 1d), when intertropical convergence and South Pacific convergence zones shift southward [Vincent, 1994; Leroy, 2006]. Tropical disturbances, including cyclones, could then hit NC, mostly from January to March. On the interannual time scale, seasonal rainfalls are related to ENSO, with negative (positive) rainfall anomalies during warm (cold) events [Morliere and Rebert, 1986; Delcroix and Lenormand, 1997; Nicet and Delcroix, 2000; Fischer et al., 2004; Leroy, 2006].
[6] The vegetation reflects partly a stable state among
mean rainfall, soil properties, and fire. The specific“mining maquis” [Enright et al., 2001] is widespread on the ultra-mafic soils on the southern third of the main island (Figure 2a). Dry forest and savanna cover almost 40% of the surface that is covered by volcano‐sedimentary soils, dry forest being mostly located along the leeward driest coast, while savannas are spread in the interior as a secondary postfire regeneration (Figure 2a). Dry forest and savannas are logically associated with relatively less annual rainfall than moist tropical rain forests and mining maquis (Figure 2b).
[7] Similar to other tropical islands, NC shelters a huge
biodiversity and stands as one of the current 34 worldwide biodiversity hotspots [Myers et al., 2000]. Fire here thus poses a serious issue about its preservation. For example, fires could lead to the change of rain forests into degraded shrub and savanna, leading to a severe threat for some forest spe-cies, especially on iron crust soils [McCoy et al., 1999].
[8] Our main goal is to provide a local‐scale analysis of the
atmospheric conditions, mostly through rainfall and maxi-mum temperature, related to fires detected by satellites. The use of two different satellite records alleviates possible biases induced by differences between the scan detection of fire and space and time samplings [Stolle et al., 2004]. The high‐ resolution meteorological network (Figures 1a and 1b) allows a probabilistic approach of the local‐scale atmospheric con-ditions observed before each fire, rather than simple frequency or correlation analyses based on the spatial sum of monthly or seasonal counts. This ensemble approach is expected to extract the most robust atmospheric signal by filtering out “noise” related either to inhomogeneities in the satellite data sets and detection of fires or to any specific local‐scale for-cings. We also compare the “comprehensive” and popular FWI [de Groot et al., 2005; Dymond et al., 2005] with a simpler index, based on rainfall only (the Effective Drought Index (EDI)). This comparison helps to estimate the potential loss of information in a subtropical climate if only rainfall is used, since temperature, wind, and relative humidity, all considered in the FWI, could have a significant impact on fire activity [Amiro et al., 2004; Crimmins, 2006] but are usually less available than rainfall. Last, our study provides an estimate of the ENSO‐related impact in a climatic context
BARBERO ET AL.: MODIS FIRES AND CLIMATE IN NEW CALEDONIA D21110 D21110
different from that of Indonesia [Kita et al., 2000; Ceccato et al., 2010].
2.
Data and Methods
2.1. Fire Hotspots
[9] Data on fire activity were derived from MOD14A1
Terra and MYD14A1 Aqua MODIS active fire data pro-ducts [Giglio et al., 2006; Giglio, 2007] from March 2000 to December 2008 and from the ATSR record [Schultz, 2002; Mota et al., 2006] from January 1996 to December 2008. Active fires are pixels where a fire was detected during the satellite overpass. ATSR data were extracted from the World Fire Atlas website. ATSR fire product is based on 3.7mm combined with two thermal bands (11 mm and 12 mm, respectively) at 1‐km spatial resolution. We used algorithm 2 (308 K, saturating threshold) to detect fire. The satellite
achieves complete global coverage every three days but, because of the saturation limit of the detector, only night-time fires are detected, while fire activity usually peaks during the daytime [Justice et al., 2002]. Consequently, the ATSR detected only 83 hotspots in New Caledonia from 1996 to 2008, i.e., only a few large fires burning during several consecutive days. Despite the poor rate of detection of fire by ATSR, we choose to keep its record to compare the associated atmospheric signal with the one found in the larger sample of MODIS fires. A good agreement between both data sets with such different sizes and also based on dif-ferent methodologies would confirm our ensemble approach. [10] The MODIS detected a total of 3707 hotspots (called
MODIS I hereafter) from 2000 to 2008 (probably far fewer than the total number of fires occurring in New Caledonia because of the temporal or spatial samplings, influence of clouds, etc.). A filtering algorithm has been used to remove Figure 1. Topography in meters (colors) and location (red dots) of the (a) 48 meteorological stations
recording daily temperatures and the (b) 86 rain gauges recording daily precipitations. The upper blue and lower red triangles in Figure 1b are the driest and wettest rain gauges, respectively (1996–2008 period). Spatial averages of the mean annual cycle of (c) temperature (mean temperature in black, maximum tem-perature in red, and minimum temtem-perature in blue) and (d) rainfall (in black) with the wettest (in blue) and driest (in red) rain gauges (Figure 1b). The mean of each station is first computed as a daily average over the 1996–2008 period, low‐pass filtered with a recursive Butterworth filter with a cutoff at 1/60 cycles per day.
BARBERO ET AL.: MODIS FIRES AND CLIMATE IN NEW CALEDONIA D21110 D21110
double counts of the same fire, which covers an area larger than a single pixel (1 km2or 100 ha) and also appears on two successive images (basically one image per day for Aqua and Terra satellites). This iterative algorithm aggregated hotspots
when they occurred less than 1 km apart and in the same 24 h time period. This algorithm allows extracting distinct fires as well as their duration and areal extent. These 949 such fires (called MODIS II hereafter) were found from 2000 to Figure 2. (a) Vegetation map of New Caledonia using Land Cover Classification derived from SPOT
(2, 3, and 4) satellite images at 20 m resolution. This land cover map has been produced by the New Caledonian Department of Technology and Information Services (DTSI) and is available from the Service Géomatique de la Télédétection du Gouvernement de la Nouvelle‐Calédonie, 1996. The information layers are obtained with Normalized Difference Vegetation Index thresholds [Rouse et al., 1973] applied on a mosaic of SPOT‐3 and SPOT‐4 satellite images from 1996 with a horizontal resolution of 20 m. The 10 different land covers are bush, lake, swampy sparse mangrove, swampy dense mangrove, sparse mining maquis, dense mining maquis, savanna, bare soil, bare soil with mangrove, and dense vegetation (i.e., forest). (b) Fraction of surface covered by different land covers. The upper number gives the approximate mean annual rainfall, and the lower number indicates the number of rain gauges.
BARBERO ET AL.: MODIS FIRES AND CLIMATE IN NEW CALEDONIA D21110 D21110
2008. Most of them (38% and 22%, respectively) covered a small area of 1 and 2 pixels, while the largest fire, known as the“Montagne des Sources” fire, burned during one week in December 2005 and covered 116 pixels.
2.2. Rainfall and Temperature Data Sets
[11] There are 118 rain gauges and 75 temperature stations
in NC, managed by MeteoFrance. Eighty‐six rain gauges (48 temperature stations), having less than 20% of missing entries (Figures 1a and 1b), were extracted from January 1996 to December 2008. The total percentage of missing entries is less than 5% in both data sets. The meteorological stations are concentrated on the west coast, while large parts of the mountainous interior are empty (Figures 1a and 1b). Never-theless, the spatial sampling is reasonable since most of the hotspots are less than 10 km from a rain gauge (see section 3). The local‐scale raw temperature and rainfall are first averaged over running 3, 7, 15, 30, and 60 day and then standardized relatively to the climatological mean (= low‐pass‐filtered daily mean with a cut‐off at 1/60 cycle‐per‐day) computed
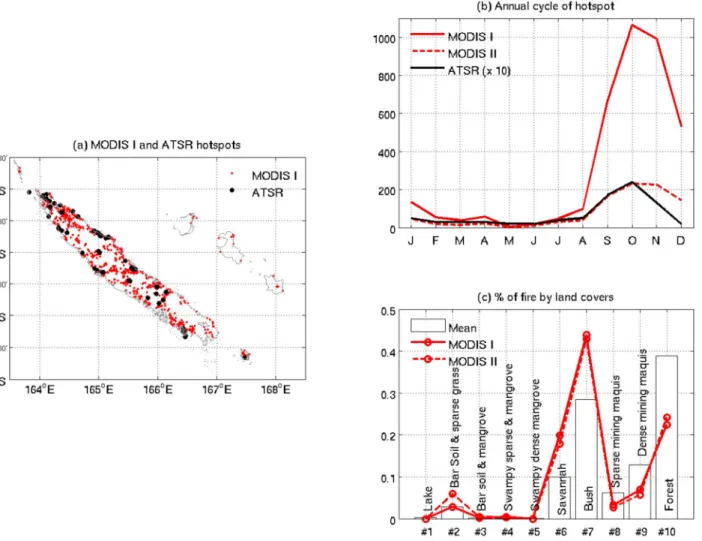
over 1996–2008 (ATSR) and 2000–2008 (MODIS). The rainfall anomalies are expressed as % relatively to the cli-matological mean. This method is better than averaging daily anomalies over running 3‐ to 60‐days period, at least for rainfall, since very scarce wet days could lead to extremely high daily anomalies which are smoothed when raw rainfall are first summed over consecutive days. The samples of 3, 7, 15, 30 and 60 day anomalies are then extracted for each hot-spot at the closest meteorological stations, the last day of each time period being the hotspot day. For MODIS I, the tem-perature and rainfall anomalies are repeated for the number of pixels of each distinct fire, while they are considered just one time per fire in MODIS II, independent of the full area covered by the fire. In other words, the weighting used for MODIS I enhances the local‐scale atmospheric anomalies of larger fires. The shortness of the available period raises a possible issue related to temporal sampling. All statistical analyses have been systematically repeated in cross‐validation mode by removing one year and checking the robustness of the score. Several sampling tests are indicated in section 3. Figure 3. (a) Hotspots detected by MODIS I (2000–2008) and ATSR (1996–2008) satellites. (b) Annual cycle of MODIS I (solid red line), MODIS II (dashed red line), and ATSR (black solid line) hotspots com-puted as mean monthly frequencies of the available period. (c) Proportion of MODIS I (red open circle with solid red line) and MODIS II (red open circle with dashed red line) by land cover superimposed on the mean coverage of land covers (bars). The numbers refer to land covers in Figure 2a.
BARBERO ET AL.: MODIS FIRES AND CLIMATE IN NEW CALEDONIA D21110 D21110
2.3. Effective Drought Index
[12] The Effective Drought Index (EDI) is a simple
measure of relative drought or excess of rainfall [Byun and Wilhite, 1999]. “Effective” precipitations (EPs) on a given day are first computed as the weighted sum of daily rainfall (R) until that day:
EPi¼ Xi n¼1 Xn m¼1 Pm ! =n " # ; ð1Þ
where i is the duration over which the sum is computed, and Pmis the rainfall m− 1 days before the current day [Byun
and Wilhite, 1999; Laux et al., 2009]. EP is thus a weighted sum with weights of each day decreasing nonlinearly from the last day of the period, with the sum of weights equaling n. n varies between 30 and 365 in our study. EP is then normalized using its climatological mean computed on the available period, allowing us to compute the “precipitation return to normal” (PRN) [Byun and Wilhite, 1999]. A PRN of 20 mm means that a rainfall of 20 mm during the current day cancels the relative drought since n days. Alternatively, a PRN of −20 mm means an excess of 20 mm of “effective” rainfall since n days. The PRN standardized by its climatological standard deviation is the EDI with positive (negative, respectively) sign indicating relative deficiency (excess) of rainfall [Laux et al., 2009]. The EDI is thus a standardized estimate of drought or excess of rainfall independent of the
total rainfall and also a relative measure of drought or excess of rainfall according to the local seasonal cycle of rainfall. The computation of the EDI needs complete records of daily rainfall. The missing daily rainfall data were replaced using a simple stochastic weather generator based on a first‐order Markov chain model to simulate the frequency of wet days (at least 1 mm) combined with a two‐parameter gamma distribution to simulate rainfall amounts during wet days [Wilks, 1999]. This method was applied independently to each station and each month to reproduce a realistic annual cycle.
2.4. Fire Weather Index
[13] The Fire Weather Index (FWI) is usually used for the
assessment of forest fire risk [Van Wagner, 1987; Dymond et al., 2005; Carvalho et al., 2008]. The index is based on past and current weather conditions, including air temperature, relative humidity, surface wind speed, and rainfall quantity in the past 24 h. The FWI is based on three fuel moisture codes corresponding to surface‐humus (Fine Fuel Moisture Code), intermediate‐humus (Duff Moisture Code (DMC)), and deep‐humus (Drought Code (DC)) layers of the forest floor and on three fire behavior indices (the Initial Spread Index for fire propagation, the Build‐Up Index for fuel consumption related to fire intensity, and the FWI). The standard form of the FWI is the equations given by Van Wagner [1987]. The FWI values rise as the fire danger increases. This index is unitless, and we expressed it in terms Figure 4. Cumulative density functions of the distances in kilometers between MODIS I (solid red line),
MODIS II (dashed red line), and ATSR (black line) hotspots and Météo‐France stations recording (a) rainfall and (b) maximum temperature.
BARBERO ET AL.: MODIS FIRES AND CLIMATE IN NEW CALEDONIA D21110 D21110
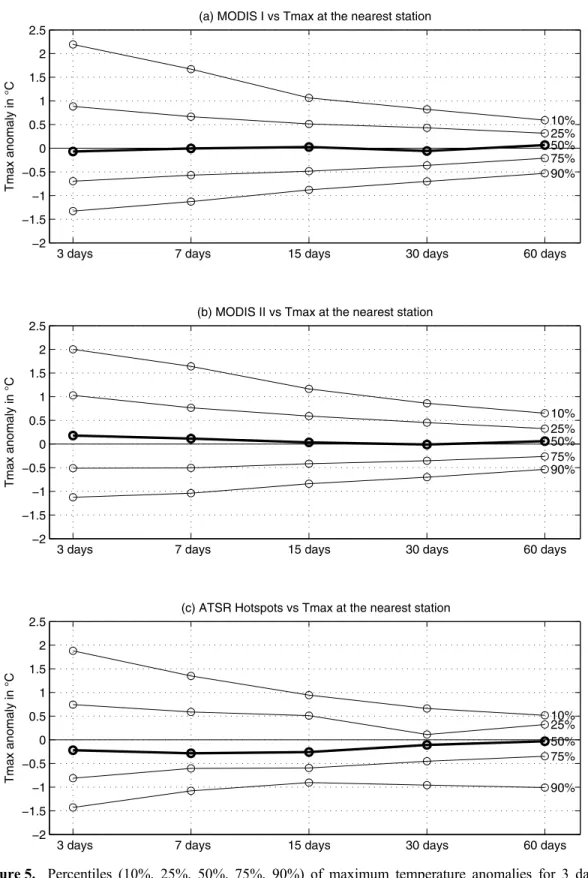
Figure 5. Percentiles (10%, 25%, 50%, 75%, 90%) of maximum temperature anomalies for 3 days, 7 days, 15 days, 30 days, and 60 days before (a) MODIS I, (b) MODIS II, and (c) ATSR hotspots at the closest meteorological station. The daily maximum temperatures are first averaged on running 3 day, 7 day, 15 day, 30 day, and 60 day windows, then normalized according to the 1996–2008 (2000– 2008) climatology. The climatology is the daily mean low‐pass filtered by a Butterworth recursive filter with a cutoff at 1/60 cycles per day.
BARBERO ET AL.: MODIS FIRES AND CLIMATE IN NEW CALEDONIA D21110 D21110
of standardized anomalies relative to the climatology. The use of relative humidity and wind speed reduces the putation of the FWI to 14 stations only in NC. The com-putation of the Drought Code would have been a good compromise to track drought and fire danger [Girardin and Wotton, 2009] as it requires only rainfall and air tempera-ture data, but these are not automatically recorded on all rain gauge stations. In conclusion, only 14 available stations
recorded all variables (temperature, rainfall, winds, and rel-ative humidity), 48 available stations recorded temperature and rainfall, and 86 available stations recorded rainfall only. 2.5. Daily Atmospheric Circulation
[14] Daily geopotential and winds at 850 hPa were obtained
from the National Centers for Environmental Prediction Figure 6. Same as Figure 5 but for rainfall anomaly (in % relative to the local climatological mean).
BARBERO ET AL.: MODIS FIRES AND CLIMATE IN NEW CALEDONIA D21110 D21110
(NCEP) reanalyses on the 15°–25°S, 150°–180°E window with a 2.5° grid resolution.
3.
Results
3.1. Location and Seasonal Cycle of Fire
[15] MODIS I hotspots are widespread across NC
(Figure 3a) even though some parts of the main island (such as the southeast, but also several mountainous sectors) are almost fire free. The mean monthly frequency of hotspots exhibits a clear unimodal trend with the peak near the end of the cool‐dry season and at the beginning of the warm‐rainy season (Figure 3b), when increasing temperature combines with a high deficit in soil moisture [Giglio et al., 2006; Le Page et al., 2008]. Herbaceous and fine woody debris fuels dry out from May, and the vegetation becomes vulnerable to fire at the end of the relatively dry season. The fire season in NC occurs thus each year mostly from September to December, which include 88% of MODIS I hotspots, 81% of MODIS II fires, and 67% of ATSR hotspots. The 1/10 ratio between MODIS II fires and ATSR hotspots is partly related to the difference in temporal sampling [Stolle et al., 2004]. Apart from this general unimodal trend, MODIS I and II also exhibit a small secondary peak in April, i.e., near the beginning of the cool‐dry season (Figure 3b), but this small peak appeared only in a single year, 2003. The depen-dency between fire locations and land cover indicates a higher sensitivity for savanna or bush and a lower sensitivity for sparse or dense“mining maquis” and forest (Figure 3c). The relatively low sensitivity of mining maquis can be explained by the lack of human activities near these infertile areas that decreases the human‐driven fire ignition even though the largest fire occurred on these ultramafic land cover types. Moreover, the dense mining maquis are also mostly located in southeastern NC (Figure 2a) which is almost never absolutely dry, even during the austral summer.
3.2. Local‐Scale Temperature and Rainfall Anomalies Before Fire
[16] Each MODIS and ATSR fire hotspot was associated
with the temperature and rainfall recorded at the closest meteorological stations (Figure 4). More than 98% of rain gauges were less than 10 km away from the MODIS fires (80% and 15 km, respectively, for the ATSR fires) (Figure 4a). The distances are slightly larger for temperature data (Figure 4b), but the spatial scale of temperature anomalies is expected to be larger than that of rainfall.
[17] The distribution of maximum temperature anomalies
for all fire products is similar and almost symmetric around zero, even for a short time lead (3 and 7 days) before hotspots
(Figure 5); therefore temperature anomalies do not seem to be a major driving factor of hotspots in NC. The same analysis using rainfall (Figure 6) shows significant negative anomalies until at least 60 days before the hotspots. The median fell from below−80% the week before a hotspot for each fire product data set and approximately below−50% for 60 days before it (Figure 6). The medians of 3, 7, 15, 30, and 60 day rainfall anomalies before fires, recomputed by excluding iteratively one year, showed negligible differences (less than 5%) between the medians of these 9 (MODIS) and 13 (ATSR) subsamples and the one of the whole sample (not shown). This analysis is last repeated on three samples from which three consecutive years are removed. Long‐term climatology, as well as rainfall anomalies, was independently computed in 2003–2008, 2000–2002, 2006–2008, and 2000–2006, and they are associated with the MODIS I and II hotspots of the corresponding periods. The three medians of rainfall anomalies are very close to each other, with absolute differ-ences limited to 5% at maximum (not shown). So the anomalous short‐term (one week) to medium‐term (two month) rainfall deficits before the fires seem robust and independent of any heterogeneities in the satellite data sets.
[18] We then analyzed the possible dependency between
amplitudes of rainfall anomalies and the sizes of fires. The MODIS II fires were ordered according to their area (from 1 to 116 pixels), and the mean rainfall anomalies were com-puted at the closest rain gauges for each fire. In that case, there are no multiple counts for fires larger than one pixel. Dealing with the relationship between fire size and rainfall anomalies, Table 1 showed that negative rainfall anomalies are usually stronger for large fires. It is related to the dif-ference between the fire’s ignition on the one hand and the fire’s duration and/or extent on the other hand. As ignition is human induced, it is probably less related to climatic con-ditions, while a long duration and/or a large burnt area are favored by a larger deficit of rainfall.
3.3. Temporal Modulation of Local‐Scale Drought Before Fires
[19] The above section suggests a robust relationship
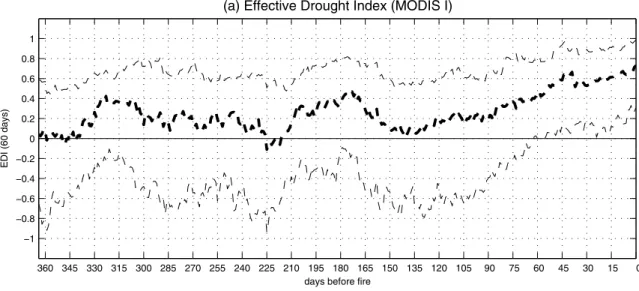
between fire occurrence and antecedent local‐scale negative rainfall anomalies. The temporal modulation of rainfall anomalies has been considered with the EDI. As for rainfall, each fire was associated with the EDI computed at the closest rain gauge. The 75% percentile of the EDI is positive at least 40 days before the MODIS hotspots, indicating robust negative anomalies of the“effective” rainfall, at least 100 days before the fire, since EDI considers here the integrated rainfall in a 60 day window (Figure 7). The variations for ATSR are noisier (Figure 7c), partly related to
Table 1. Statistics of MODIS Fire According to the Total Burnt Areaa
Frequency of MODIS II Fires Frequency of Total Burnt Area Rainfall Anomalies for 3 Days Before
Hotspot
Rainfall Anomalies for 7 Days Before
Hotspot
Rainfall Anomalies for 15 Days Before
Hotspot
Rainfall Anomalies for 30 Days Before
Hotspot
Rainfall Anomalies for 60 Days Before
Hotspot 1 pixel 38% 10% −100% −89% −72% −41% −25% 2–5 46% 34% −100% −92% −75% −58% −40% 6–10 11% 20% −100% −98% −89% −58% −54% 11–20 3% 10% −100% −95% −77% −69% −56% >20 2% 26% −100% −98% −87% −85% −72% a
Area size given in pixels; 1 pixel = 100 ha. The median of rainfall anomalies for 3 days, 7 days, 15 days, 30 days and 60 days before the fire starts are given in percentage of the long‐term climatology at the nearest rain gauges.
BARBERO ET AL.: MODIS FIRES AND CLIMATE IN NEW CALEDONIA D21110 D21110
Figure 7. Median (bold dashed line) and 25% and 75% percentiles (dashed line) of the EDI computed on a 60 day window at the closest rain gauge from one year to the day of hotspots for (a) MODIS I, (b) MODIS II, and (c) ATSR.
BARBERO ET AL.: MODIS FIRES AND CLIMATE IN NEW CALEDONIA D21110 D21110
the small size of the sample. Negative rainfall anomalies are thus widespread from June to December, before the hotspot fire occurrences. In other words, a medium‐term drought near the end of the cool‐dry season, as well as a delay in the onset of the wet season, significantly increases the fire’s risk. Median EDI tends to zero around ∼135–150 days before the hotspot fires (Figure 7), suggesting a weak return to normal conditions from February to May, that is, near the end of the previous wet season if the mean seasonal cycle of
rainfall is taken into account (Figure 1d). The median tends to be above 0 all year before the hotspot fires with a large spread, suggesting that fires tend to be more frequent during a dry year (Figure 7). The EDI was also computed for different fire sizes considering the MODIS II data set. As before, the drought was more severe for large fires (not shown).
[20] It is also interesting to analyze and confirm this
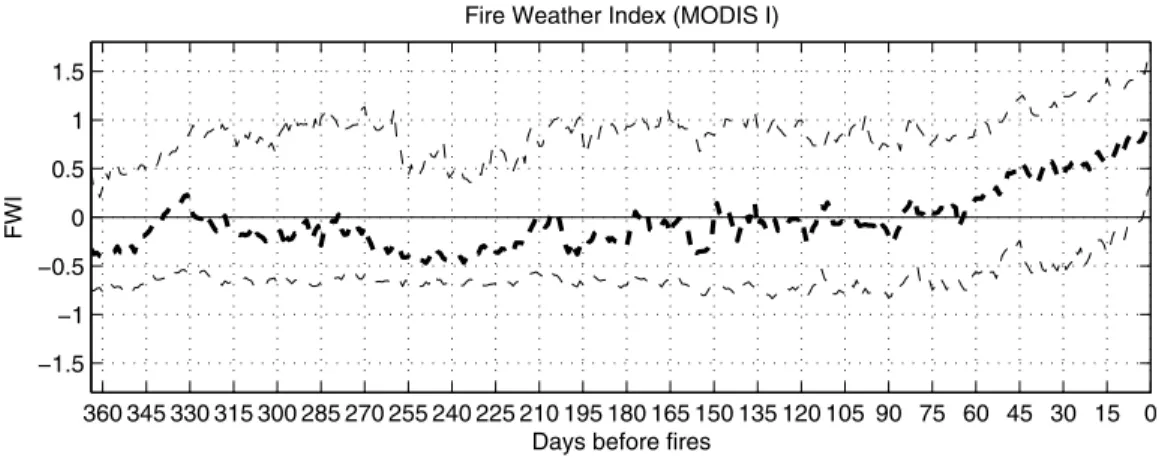
tem-poral modulation through another index. We obtained the same results when the EDI was replaced by the FWI (Figure 8) Figure 8. Median (bold dashed line) and 25% and 75% percentiles (dashed line) of the FWI at the closest
rain gauge from one year to the day of a hotspot for MODIS I.
Figure 9. (a) Scatterplot of daily EDI in the abscissa and daily standardized DMC in SOND (black dots) and during MODIS I fires (red dots). The white dashed line gives the best exponential fitting between daily EDI and daily DMC. (b) The same as Figure 9a, except that the DMC is replaced by the FWI.
BARBERO ET AL.: MODIS FIRES AND CLIMATE IN NEW CALEDONIA D21110 D21110
(note that only 15% of FWI stations are less than 10 km from the MODIS I hotspots). This suggests that considering rainfall only does not degrade the detection of climate impact on fire activity. We also compared the daily EDI with the daily DMC and FWI during the fire’s season (September, October, November, December (SOND)) (Figure 9). In this case, the EDI is used only at stations where the FWI is available. Only positive anomalies values of the DMC (FWI), including 78% (84%) of the fire days, are related mostly to positive EDI variations while negative DMC (FWI) anoma-lies are not necessarily related to negative EDI (Figure 9). Indeed, the DMC and FWI seem to saturate for decreasing EDI. This could be related to the positive skewness of the DMC (skewness = 1.1) and FWI (skewness = 0.6) while EDI is negatively skewed (skewness =−0.98). The DC (which is an indicator of seasonal drought on forest fuels in deep duff layers and depends on only rainfall and temperature) shows the same nonlinear relationship as in the two previous cases (not shown).
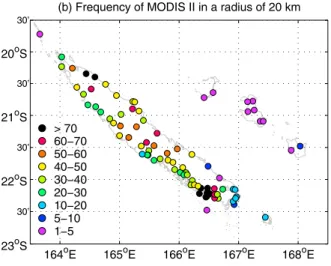
3.4. Spatial Pattern of Rainfall Deficit Before the Fires [21] The number of MODIS I and II hotspots was
counted in a radius of 20 km of each of the 86 rain gauges. Figure 10b shows the frequency of MODIS II fires, with two maxima around Nouméa in southwestern NC and also in northeastern NC at Pouébo and Ouégoa in relation to specific agricultural practices. Fires are especially rare along the southeastern coast, which is relatively wet all year around, even in August–November (Figure 1b) and also uninhabited, and also on the Loyauté Islands northeast of the main island, which sustain only a few tribes as well. The total number of MODIS I hotspots (Figure 10a) reveals a similar pattern with several discrepancies. For example, there is now a single maximum in northeastern NC. Note also that variations could be rather large on small distances, but these variations are probably not driven by climate.
[22] The 100 day rainfall anomalies before each hotspot
are shown in Figures 10c and 10d. As seen before, the negative rainfall anomalies are weighted by the fire’s area in Figure 10. Total number of (a) MODIS I and (b) MODIS II hotspots recorded in a radius of 20 km around
each rain gauge. Mean rainfall anomalies (in % of the mean) in 0–100 days before the (c) MODIS I and (d) MODIS II fires. The bold circles (in Figures 10c and 10d) indicate significant anomalies at the two‐ sided 95% level according to a Student’s t test.
BARBERO ET AL.: MODIS FIRES AND CLIMATE IN NEW CALEDONIA D21110 D21110
MODIS I, while a single rainfall anomaly is used for each MODIS II fire independent of its area. The significant neg-ative rainfall anomalies are larger for MODIS I (Figure 10c) relatively to MODIS II (Figure 10d) and are also more intense along the leeward western coast, independent of the local‐ scale frequency of fire.
3.5. Interannual Variability of Fire Frequency
[23] The interannual variability of NC rainfall has been
extensively studied and ENSO has been recognized as one of the main forcings of NC rainfall variations [i.e., Morliere and Rebert, 1986; Nicet and Delcroix, 2000; Fischer et al., 2004; Leroy, 2006]. In particular, the South Pacific Con-vergence Zone (SPCZ) shifts southwestward during La Niña and northeastward during El Niño events. During an El Niño year, NC typically experiences anomalous dry and cold conditions from April until May of the following year [Morliere and Rebert, 1986], while the opposite is usually observed during La Niña events, but the magnitude of the rainfall anomalies is not strictly proportional to the strength of ENSO [Nicet and Delcroix, 2000; Fischer et al., 2004]. It is thus interesting to analyze the relationships between ENSO
and fire frequency averaged across NC in SOND. Figure 11 displays the scatterplot between June and August Niño 3.4 anomalies and the monthly anomalies of MODIS hotspots summed across NC. Monthly values are used to increase the sample size. Cold ENSO events are almost always related to fewer MODIS hotspots than normal, while the association between warm ENSO events and more MODIS hotspots is less straightforward. Similarly, the correlation between sea-sonal SOND frequencies of ATSR hotspots and those of June, July, August (JJA) Niño 3.4 equals 0.76 (1996–2008 period) for a second‐order polynomial fit (not shown).
[24] To better understand the interactions between ENSO
and fires in SOND, we examined the regional‐scale atmo-spheric anomalies at 850 hPa during the warm and cold ENSO events. We consider a long period, i.e., from 1950 to 2008, to get a robust relationship. Warm and cold ENSO events are defined using the 80% and 20% percentiles, respectively (i.e., 12 years in each sample) of the SOND average of the Niño 3.4 SST index. The climatological winds and geopotential heights at 850 hPa show a S‐N gradient between anticyclonic conditions with relatively weaker easterlies south of 23°S and the SPCZ with stronger easterlies Figure 11. Scatterplot of seasonal (June–August, 2000–2008) Niño 3.4 sea surface temperature in the
abscissa and monthly (September–December, 2000–2008) frequency of (a) MODIS I and (b) MODIS II hotspots in the ordinate. The values are expressed as anomalies (in °C for Niño 3.4 and in % for hotspot frequency) relatively to the 2000–2008 mean. The red line gives the best second‐order polynomial with the seasonal JJA Niño 3.4 as predictor of monthly SOND hotspot frequencies; the correlation between fitted and observed monthly hotspot frequencies is indicated in the upper left corner.
BARBERO ET AL.: MODIS FIRES AND CLIMATE IN NEW CALEDONIA D21110 D21110
north of 23°S (Figure 12a). Figures 12b and 12c display the composite anomalies during the 12 warmest and 12 coldest ENSO events. Warm ENSO events are characterized by pos-itive geopotential height anomalies and anomalous south-easterly winds over the southwest Pacific (Figure 12b). Cold ENSO events are associated with large negative geopotential height anomalies and anomalous northwesterly winds north of NC (Figure 12c), with the resultant impact of enhancing moisture advection over NC.
[25] It is interesting to compare these seasonal composites
with daily composites of atmospheric anomalies at 850 hPa when at least one MODIS hotspot is recorded across NC. The composite of these 949 fires’ days (Figure 12d) reveals a pattern similar to the one associated with warm ENSO events (Figure 12b), with positive geopotential anomalies, increasing southwest of NC, associated with intensified southeasterlies. The anomalous southeasterlies would enhance the climatologically mean easterly winds over the southwest Pacific, thus further enhancing (weakening) precipitation along the windward (leeward) coasts of NC through changes in orographic lifting. In summary, the seasonal atmospheric anomalies associated with warm ENSO events are similar to daily ones recorded during fires’ days. Atmospheric anoma-lies associated with days recording >2, 5, or even 10 MODIS hotspots (not shown) are very similar to the ones displayed in Figure 12d, suggesting that days recording numerous hot-spots are related to an accumulation of rainfall deficit rather than a specific meteorological pattern.
4.
Discussion and Conclusion
[26] For the first time in NC, we used rich daily rainfall and
temperature data sets (Figure 1) and two different data sets of hotspot records (MODIS and ATSR) to study climatic
con-trols on fire activity. The length of the fire records is quite short (13 years for ATSR and 9 years for MODIS), but it nevertheless allows the first attempt of fire frequency reconstruction of these biodiversity hotspots, where intensive agriculture such as palm tree plantations is not at the origin of fire ignitions. Our analysis is mostly based on the association between each fire occurrence and local‐scale atmospheric conditions recorded at the closest meteorological station or rain gauge. Considering all fire occurrences and two different satellite estimates could alleviate some of the issues associated for example with the shortness and discrepancies between satellite records, but the high resolution of meteorological data sets counterbalances such drawbacks. Our approach allows extracting a robust climate‐driven signal from among a large data set, at least when all 3707 MODIS hotspots are considered.
[27] Although fire ignition in NC is mostly a human‐driven
phenomenon, climate has a strong impact on seasonal and interannual variations of fires, mostly through rainfall in our case. The seasonal cycle of fires shows first a clear seasonal peak at the end of the cool‐dry season and the beginning of the warm‐wet season, that is September–December (Figures 1 and 3). Second, the negative rainfall anomalies during the dry‐cool season and around its transition with the warm‐wet season appear to be the main forcings of the local‐ scale fire occurrences (Figures 5 and 7). Despite very large differences between ATSR and MODIS frequencies, the rainfall anomalies and the associated relative drought are very robust among both data sets considered in this study (Figures 7 and 8). The negative rainfall anomalies before the fire are also stronger for the leeward western coast (Figure 10), which is drier, because of topography, than the windward eastern coast, while the extreme southeastern part of the main island is almost fire free because of both its almost Figure 12. (a) Long‐term mean (1950–2008) of winds (arrow) and geopotential height at 850 hPa (in mgp)
in SOND. Composite of seasonal anomalies in SOND during the 12 (b) warmest and (c) coldest ENSO events. (d) Composite of daily anomalies during the days when at least one MODIS hotspot is recorded across NC.
BARBERO ET AL.: MODIS FIRES AND CLIMATE IN NEW CALEDONIA D21110 D21110
constant wetness, even from May to October (Figure 1d), and its uninhabited status, which is due to prevailing infertile ultramafic soil conditions for agriculture. Therefore, anoma-lously low rainfall amounts as well as long dry periods, especially at the end of the dry‐cool season, increase fire occurrences and the driest areas (i.e., the leeward west coast, Figure 10) appear to be more sensitive to such negative rainfall anomalies. Therefore, the same mechanisms seem able to explain temporal, at intra‐annual and interannual time scales, and spatial variations of fire occurrence. In the same way, the climatic signal seems especially clear when the fire size is considered. Preprocessing of MODIS hotspots allows us to differentiate the frequency of fire start and extent. The duration and/or extent of fires are more closely related to rainfall anomalies than to frequency of fire starts, which is impacted by human factors.
[28] The leeward west coast is drier than the windward east
coast, and it is possible that some threshold effect exists, inhibiting a fire’s extension or/and duration even if a relative drought occurs along the east coast, especially in south NC, where wintertime rainfall is significant. In other words, the almost‐constant wetness is able to limit the extension and duration of fire. This simple modulation is probably not unique since northern NC, which is very dry during the austral winter, is not related to the largest negative rainfall anomalies. We must also remember that most of the NC inhabitants live in Nouméa and its suburbs and also along the leeward coast, while some parts of the windward coast and the interior are empty of people. This superimposes a human‐driven pattern that partly biases the climatic ones.
[29] The lack of any robust relationship between fire
occurrence and maximum temperature is intriguing. It is well known that the highest fire risk is associated with drought, but also with high diurnal temperatures, increasing the water vapor deficit, and strong winds, enhancing evapotranspiration. It is thus possible that the geographical as well as the topo-graphical context of NC, that is, a mountainous and narrow island surrounded by warm seas, limits the impact of temper-ature on fire occurrence. It does not exclude these atmospheric parameters (i.e., temperature, wind speed, evapotranspiration) as unable to modulate the impact of rainfall anomalies, for example by differentiating the fire’s risk for a fixed level of drought, even if they cannot act alone as a main driving factor. [30] It is important to note that a simple index such as the
EDI, based on rainfall only, leads to very similar results of a more comprehensive meteorological index such as the FWI. The FWI serves mostly as a daily indicator of fire risk, but we show here that the EDI conveys similar information about fire risks (Figure 9), at least when an island like NC is considered. It is not necessarily trivial because several com-binations could induce a high fire risk such as a high wind speed associated with a low relative humidity, which in turn could be induced by a high maximum temperature. However, the fact that only rainfall information is sufficient through the EDI to assess fire risk is an important result since daily rainfalls estimated by satellites are already available and have been since 1998 (through the Tropical Rainfall Measuring Mission (TRMM)), thus covering most of the fire records, at least those recorded by satellites. Such a local‐scale analysis would then be feasible for the whole tropical zone.
[31] The next step would be to forecast a seasonal fire
risk. We know that ENSO is a major large‐scale forcing of
interannual variability of NC rainfall. Despite the shortness of satellite records, the cross correlations between the JJA Niño 3.4 SST index and monthly anomalies of fire frequency in SOND is rather promising (Figure 11). Warm ENSO events are associated with anticyclonic anomalies, larger over the western Pacific, and faster southeasterlies than normal at 850 hPa, while cold ENSO events are associated with cyclonic anomalies and anomalous northerlies toward NC (Figure 12). Warm ENSO events are thus associated with drier conditions than usual in NC that help to strengthen the atmospheric conditions favorable for fire propagation. It is highly likely that the anomalous southeasterlies over the southwest Pacific during ENSO events could lead to an enhanced drought along the leeward coast of NC through changes in orographic forcing. This overall positive rela-tionship between the Niño 3.4 index and hotspots summed across NC is consistent with the results that Ceccato et al. [2010] found in Kalimantan. While the correlation falls below 0.2 between Southern Oscillation Index (SOI) and fire risk in Amazonia [Hoffmann et al., 2003], our results suggest a stronger ENSO modulation in NC. Cold ENSO events are always associated with negative anomalies of MODIS hot-spot fires while warm ENSO events are usually, but not always, associated with positive anomalies of hotspots. This asymmetry could simply be due to stochastic sampling, but an additional simple mechanism could be raised: if cold ENSO events lead to more rainfall than normal during the cool‐dry season and/or an earlier onset of the wet season, they almost strictly inhibit the propagation of fires and ignition is more difficult. On the other hand, an anomalous drought, for example, related to a warm ENSO event, increases the probability of ignition or propagation of a fire. Nonclimatic factors are thus critical to establishing the true level of fire activity. Future studies would consider different predicting schemes based on the ENSO state but also on rainfall anomalies.
[32] Acknowledgments. We thank the ANR BDIV‐07‐008 project INC and the French Ministry of Research for funding this research and the Ph.D. scholarship of R. Barbero. We thank Y. Noack from CEREGE and Y. Bidet from MeteoFrance for providing meteorological data, while ATSR and MODIS data were downloaded free of charge from the Web at http://due.esrin.esa.int/wfa and https://lpdaac.usgs.gov/lpdaac/products/ modis_products_table, respectively. Last, we thank our colleagues at IRI (A.W. Robertson and P. Ceccato) for fruitful discussions, and the three reviewers who helped improve this paper.
References
Amiro, B. D., K. A. Logan, B. M. Wotton, M. D. Flannigan, J. B. Todd, B. J. Stocks, and D. L. Martell (2004), Fire weather index system compo-nents for large fires in the Canadian boreal forest, Int. J. Wildland Fire, 13, 391–400, doi:10.1071/WF03066.
Byun, H. R., and D. A. Wilhite (1999), Objective quantification of drought severity and duration, J. Clim., 12, 2747–2756, doi:10.1175/1520-0442 (1999)012<2747:OQODSA>2.0.CO;2.
Carvalho, A., M. D. Flannigan, K. Logan, A. I. Miranda, and C. Borrego (2008), Fire activity in Portugal and its relationship to weather and the Canadian Fire Weather Index System, Int. J. Wildland Fire, 17, 328–338, doi:10.1071/WF07014.
Ceccato, P., I. Nengah Surati Jaya, J. H. Qian, M. K. Tippett, A. W. Robertson, and S. Someshwar (2010), Early warning and response to fires in Kalimantan, Indonesia, IRI Tech. Rep. 10‐14, 23 pp., Int. Res. Inst. for Clim. and Soc., Palisades, N. Y.
Cochrane, M. A. (2003), Fire science for rainforests, Nature, 421, 913–919, doi:10.1038/nature01437.
BARBERO ET AL.: MODIS FIRES AND CLIMATE IN NEW CALEDONIA D21110 D21110
Crimmins, M. A. (2006), Synoptic climatology of extreme fire‐weather conditions across the southwest United States, Int. J. Climatol., 26, 1001–1016, doi:10.1002/joc.1300.
Crimmins, M. A., and A. C. Comrie (2004), Interactions between ante-cedent climate and wildfire variability across south‐eastern Arizona, Int. J. Wildland Fire, 13, 455–466, doi:10.1071/WF03064.
de Groot, W. J., Wardati, and Y. Wang (2005), Calibrating the fine fuel moisture code for grass ignition potential in Sumatra, Indonesia, Int. J. Wildland Fire, 14, 161–168, doi:10.1071/WF04054.
Delcroix, T., and O. Lenormand (1997), ENSO signals in the vicinity of New Caledonia, South Western Pacific, Oceanol. Acta, 20, 481–491. Dolling, K., P.‐S. Chu, and F. Fujioka (2005), A climatological study of
the Keetch/Byram drought index and fire activity in the Hawaiian Islands, Agric. For. Meteorol., 133, 17–27, doi:10.1016/j.agrformet.2005.07.016. Dymond, C.C., R. D. Field, O. Roswintiarti, and Guswanto (2005), Using satellite fire detection to calibrate components of the Fire Weather Index system in Malaysia and Indonesia, Environ. Manage., 35, 426–440, doi:10.1007/s00267-003-0241-9.
Enright, N. J., L. Rigg, and T. Jaffré (2001), Environmental controls on species composition along a (maquis) shrubland to forest gradient on ultra-mafics at Mont Do, New Caledonia, S. Afr. J. Sci., 97, 573–580. Fischer, M., B. Dewitte, and L. Maîtrepierre (2004), A non‐linear statistical
downscaling model: El‐Niño/Southern Oscillation impact on precipitation over New Caledonia, Geophys. Res. Lett., 31, L16204, doi:10.1029/ 2004GL020112.
Fuller, D. O., and K. Murphy (2006), The ENSO‐fire dynamic in insular Southeast Asia, Clim. Change, 74, 435–455, doi:10.1007/s10584-006-0432-5.
Garcia Diez, E. L., L. Rivas Soriano, F. De Pablo Davila, and A. Garcia Diez (1994), An objective forecasting model for the daily outbreak of forest fires based on meteorological considerations, J. Appl. Meteorol., 33, 519–526, doi:10.1175/1520-0450(1994)033<0519:AOFMFT>2.0. CO;2.
Giglio, L. (2007), Characterization of the tropical diurnal fire cycle using VIRS and MODIS observation, Remote Sens. Environ., 108, 407–421, doi:10.1016/j.rse.2006.11.018.
Giglio, L., I. Csiszar, and C. O. Justice (2006), Global distribution and sea-sonality of active fires as observed with the Terra and Aqua Moderate Resolution Imaging Spectroradiometer (MODIS) sensors, J. Geophys. Res., 111, G02016, doi:10.1029/2005JG000142.
Girardin, M. P., and B. M. Wotton (2009), Summer moisture and wildfire risks across Canada, J. Appl. Meteorol. Climatol., 48, 517–533, doi:10.1175/2008JAMC1996.1.
Hély, C., P. R. Dowty, S. Alleaume, K. K. Caylor, S. Korontzi, R. J. Swap, H. H. Shugart, and C. O. Justice (2003), Regional fuel load for two climatically contrasting years in southern Africa, J. Geophys. Res., 108(D13), 8475, doi:10.1029/2002JD002341.
Hoffmann, W. A., W. Schroeder, and R. B. Jackson (2003), Regional feed-backs among fire, climate, and tropical deforestation, J. Geophys. Res., 108(D23), 4721, doi:10.1029/2003JD003494.
Justice, C. O., L. Giglio, S. Korontzi, J. Owens, J. T. Morisette, D. Roy, J. Descloitres, S. Alleaume, F. Petitcolin, and Y. Kaufman (2002), The MODIS fire products, Remote Sens. Environ., 83, 244–262, doi:10.1016/S0034-4257(02)00076-7.
Kiladis, G. N., and H. Diaz (1989), Global climatic anomalies associated with extremes of the southern oscillation, J. Clim., 2, 1069–1090, doi:10.1175/1520-0442(1989)002<1069:GCAAWE>2.0.CO;2. Kita, K., M. Fujiwara, and S. Kawakami (2000), Total ozone increase
asso-ciated with forest fires over the Indonesian region and its relation to the El Niño‐Southern Oscillation, Atmos. Environ., 34, 2681–2690, doi:10.1016/S1352-2310(99)00522-1.
Langner, A., and F. Siegert (2009), Spatiotemporal fire occurrence in Borneo over a period of 10 years, Global Change Biol., 15, 48–62, doi:10.1111/j.1365-2486.2008.01828.x.
Laux, P., S. Wagner, A. Wagner, J. Jacobeit, A. Bardossy, and H. Knustmann (2009), Modeling daily precipitation features in the Volta Basin of West Africa, Int. J. Climatol., 29, 937–954, doi:10.1002/joc.1852.
Lefèvre, J., P. Marchesiello, N. Jourdain, C. Menkes, and A. Leroy (2010), Weather regimes and orographic circulation around New Caledonia, Mar. Pollut. Bull., 61, 413–431, doi:10.1016/j.marpolbul.2010.06.012. Le Page, Y., J. M. C. Perreira, R. Trigo, C. Da Camara, D. Oom, and
B. Mota (2008), Global fire activity patterns (1996–2006) and climatic influence: An analysis using the World Fire Atlas, Atmos. Chem. Phys., 8, 1911–1924, doi:10.5194/acp-8-1911-2008.
Leroy, A. (2006), Utilisation des prévisions saisonnières en Nouvelle‐ Calédonie, Note 6 Dir. Météorol., 88 pp., Serv. de la Météorol., Nouméa, New Caledonia.
McCoy, S., T. Jaffré, F. Rigault, and J. E. Ash (1999), Fire and succession in the ultramafic maquis of New Caledonia, J. Biogeogr., 26, 579–594, doi:10.1046/j.1365-2699.1999.00309.x.
Morliere, A., and J. P. Rebert (1986), Rainfall shortage and El Niño–Southern Oscillation in New Caledonia, southern Pacific, Mon. Weather Rev., 114, 1131–1137, doi:10.1175/1520-0493(1986)114<1131:RSAENO>2.0.CO;2. Mota, B. W., J. M. C. Pereira, D. Oom, M. J. P. Vasconcelos, and M. Schultz (2006), Screening the ESA ATSR‐2 World Fire Atlas (1997–2002), Atmos. Chem. Phys., 6, 1409–1424, doi:10.5194/acp-6-1409-2006. Myers, N., R. A. Mittermeier, C. G. Mittermeier, G. A. B. da Fonseca, and
J. Kent (2000), Biodiversity hotspots for conservation priorities, Nature, 403, 853–858, doi:10.1038/35002501.
Nicet, J. B., and T. Delcroix (2000), ENSO‐related precipitation changes in New Caledonia, southern tropical Pacific: 1969–98, Mon. Weather Rev., 128, 3001–3006, doi:10.1175/1520-0493(2000)128<3001:ERPCIN>2.0. CO;2.
Ropelewski, C. F., and M. S. Halpert (1987), Global and regional scale pre-cipitation patterns associated with the El Niño/Southern Oscillation, Mon. Weather Rev., 115, 1606–1626, doi:10.1175/1520-0493(1987) 115<1606:GARSPP>2.0.CO;2.
Ropelewski, C. F., and M. S. Halpert (1996), Quantifying Southern Oscillation‐precipitation relationships, J. Clim., 9, 1043–1059, doi:10.1175/1520-0442(1996)009<1043:QSOPR>2.0.CO;2.
Rouse, J. W., R. H. Haas, J. A. Schell, and D. W. Deering (1973), Moni-toring vegetation systems in the Great Plains with ERTS, in Proceedings of the Third ERTS Symposium, NASA SP‐351 I, pp. 309–317, NASA, Greenbelt, Md.
Schultz, M. G. (2002), On the use of ATSR fire count data to estimate the seasonal and interannual variability of vegetation fire emissions, Atmos. Chem. Phys., 2, 387–395, doi:10.5194/acp-2-387-2002.
Siegert, F., G. Ruecker, A. Hinrichs, and A. A. Hoffmann (2001), Increased damage from fires in logged forests during droughts caused by El Niño, Nature, 414, 437–440, doi:10.1038/35106547.
Stevenson, J., J. R. Dodson, and I. P. Prosser (2001), A late quaternary record of environmental change and human impact from New Caledonia, Palaeogeogr. Palaeoclimatol. Palaeoecol., 168, 97–123, doi:10.1016/ S0031-0182(00)00251-0.
Stocks, B. J., B. D. Lawson, M. E. Alexander, W. E. Van Wagner, R. S. McAlpine, T. J. Lynham, and D. E. Dube (1989), The Canadian forest fire danger rating system: An overview, For. Chron., 65, 450–457. Stolle, F., R. A. Dennis, I. Kurniwan, and E. F. Lambin (2004), Evaluation
of remote sensing‐based active fire datasets in Indonesia, Int. J. Remote Sens., 25, 471–479, doi:10.1080/01431160310001618022.
Vadrevu, K. P. (2008), Analysis of fire events and controlling factors in Eastern India using spatial scan and multivariate statistics, Geogr. Ann., 90, 315–328, doi:10.1111/j.1468-0459.2008.00348.x.
van der Werf, G. R., J. T. Randerson, L. Giglio, G. J. Collatz, P. S. Kasibhatla, and A. F. Arellano Jr. (2006), Interannual variability in global biomass burn-ing emissions from 1997 to 2004, Atmos. Chem. Phys., 6, 3423–3441, doi:10.5194/acp-6-3423-2006.
van der Werf, G. R., J. T. Randerson, L. Giglio, N. Gobron, and A. J. Dolman (2008a), Climate controls on the variability of fires in the tropics and sub-tropics, Global Biogeochem. Cycles, 22, GB3028, doi:10.1029/ 2007GB003122.
van der Werf, G. R., et al. (2008b), Climate regulation of fire emissions and deforestation in equatorial Asia, Proc. Natl. Acad. Sci. U. S. A., 105, 20,350–20,355, doi:10.1073/pnas.0803375105.
Van Wagner, C. E. (1987), Development and structure of the Canadian Forest Fire Weather Index System, For. Tech. Rep. 35, 37 pp., Can. Forest. Serv., Ottawa, Ont., Canada.
Vincent, D. G. (1994), The South Pacific Convergence Zone (SPCZ): A review, Mon. Weather Rev., 122, 1949–1970, doi:10.1175/1520-0493 (1994)122<1949:TSPCZA>2.0.CO;2.
Wilks, D. S. (1999), Interannual variability and extreme‐value characteristics of several stochastic daily precipitation models, Agric. For. Meteorol., 93, 153–169, doi:10.1016/S0168-1923(98)00125-7.
R. Barbero, C. Hély, and V. Moron, CEREGE, Aix‐Marseille University, UMR 6635, Europôle Méditerranéen de l’Arbois, F‐13545 Aix‐en‐ Provence, France. (barbero@cerege.fr)
M. Despinoy and M. Mangeas, ESPACE‐DEV, Institut de Recherche pour le Développement, 101 Promenade Roger Laroque– Anse Vata, BP A5, 98848 Nouméa, New Caledonia.
BARBERO ET AL.: MODIS FIRES AND CLIMATE IN NEW CALEDONIA D21110 D21110