HAL Id: hal-03025701
https://hal.archives-ouvertes.fr/hal-03025701
Submitted on 26 Nov 2020HAL is a multi-disciplinary open access
archive for the deposit and dissemination of sci-entific research documents, whether they are pub-lished or not. The documents may come from teaching and research institutions in France or abroad, or from public or private research centers.
L’archive ouverte pluridisciplinaire HAL, est destinée au dépôt et à la diffusion de documents scientifiques de niveau recherche, publiés ou non, émanant des établissements d’enseignement et de recherche français ou étrangers, des laboratoires publics ou privés.
from the 1936-1997 NE Lut earthquake sequence
M Marchandon, Mathilde Vergnolle, O Cavalié
To cite this version:
M Marchandon, Mathilde Vergnolle, O Cavalié. Fault interactions in a complex fault system: in-sight from the 1936-1997 NE Lut earthquake sequence. Geophysical Journal International, Oxford University Press (OUP), 2021, 224 (2), pp.1157-1173. �10.1093/gji/ggaa451�. �hal-03025701�
© The Author(s) 2020. Published by Oxford University Press on behalf of The Royal Astronomical Society.
ORIGINAL UNEDITED MANUSCRIPT
Fault interactions in a complex fault system: insight from the
1936-1997 NE Lut earthquake sequence
M. Marchandon
1∗, M. Vergnolle
1, and O. Cavali´e
11Universit´e Cˆote d’Azur, CNRS, Observatoire de la Cˆote d’Azur, IRD, G´eoazur, 250 rue Albert Einstein, Sophia
Antipolis 06560 Valbonne, France.
∗Now at Univ. Grenoble Alpes, Univ. Savoie Mont Blanc, CNRS, IRD,IFSTTAR, ISTerre, 38000 Grenoble, France
Accepted xx. Received xx; in original form 2019 xx
SUMMARY
Calculations of Coulomb stress changes have shown that moderate to large earthquakes may increase stress at the location of future earthquakes. Coulomb stress transfers have thus been widely accepted to explain earthquake sequences, especially for sequences occurring within parallel or collinear fault systems. Relating, under this framework, successive earthquakes oc-curring within more complex fault systems (i.e. conjugate fault system) is more challenging. In this study, we assess which ingredients of the Coulomb stress change theory are decisive for explaining the succession of three large (Mw7+) earthquakes that occurred on a conjugate fault system in the NE Lut, East Iran, during a 30-year period. These earthquakes belong to a larger seismic sequence made up of 11 earthquakes (Mw5.9+) from 1936 to 1997. To reach our goal, we calculate, at each earthquake date, the stress changes generated by the static deformation of the preceding earthquakes, the following postseismic deformation due to the viscoelastic relaxation of the lithosphere, and the interseismic deformation since 1936. We first show that accurately modelling the source and receiver fault geometry is crucial to precisely estimating Coulomb stress changes. Then we show that 7 out of 10 earthquakes of the NE Lut sequence, considering the uncertainties, are favoured by the previous earthquakes. Furthermore, the last two M7+ earthquakes of the sequence (1979 and 1997) have mainly been favoured by the
ORIGINAL UNEDITED MANUSCRIPT
moderate Mw ∼ 6 earthquakes. Finally, we investigate the link between the Coulomb stress changes due to previous earthquakes and the rupture extension of the next earthquake and show that a correlation does exist for some earthquakes but is not systematic.
Key words: Earthquake interaction, forecasting, and prediction; Seismic cycle; Mechanics, theory, and modelling; Asia
1 INTRODUCTION
Numerous observations indicate that moderate to large earthquakes occur in temporal clusters within fault systems (e.g., Ambraseys 1970; Hubert-Ferrari et al. 2003; Sieh et al. 2008; Benedetti et al. 2013; Michele et al. 2016). Understanding the processes that control such spatio-temporal successions of earthquakes is critical to improve the ability to provide realistic earthquake scenar-ios and reliable hazard estimates. For two decades, many studies have also shown a good correla-tion between zones of positive Coulomb stress changes (static alone or both static and viscoelas-tic) and the epicentre location of subsequent moderate to large earthquakes (e.g., King et al. 1994; Stein et al. 1997; Pollitz et al. 2003; Nalbant et al. 2006, and see also Freed 2005 and Steacy et al. 2005b for more exhaustive studies about stress transfers since the early 1990’s) and thus propose the Coulomb stress transfer process as a good candidate to explain earthquake sequences. How-ever, in the case of mainshock-mainshock earthquake sequences, most studies involve earthquakes that broke collinear segments of a same fault (e.g., Stein et al. 1997; Cocco et al. 2000; Nostro et al. 2001; Nalbant et al. 2002, 2006; Pollitz et al. 2006; Ali et al. 2008; Shan et al. 2013; Mildon et al. 2017; Xiong et al. 2017) or parallel fault segments (e.g., Hodgkinson et al. 1996; Caskey & Wesnousky 1997; Arnadottir et al. 2003; Nalbant et al. 2005a; He & Peltzer 2010; Ryder et al. 2012; Wedmore et al. 2017). Earthquake sequences within complex fault systems (e.g. conjugate faults system) are less well understood (e.g., Nalbant et al. 2005b; Bie & Ryder 2014; Verdecchia & Carena 2016; Kariche et al. 2018) and the role of Coulomb stress changes in the development of the sequence is less clear. For example, Nalbant et al. (2005b) computed the Coulomb stress changes produced by the M>6.7 earthquakes since 1780 on the East Anatolian fault to know if they triggered the 2003 Mw 6.4 Bingol earthquake that broke a conjugate fault of the East
ORIGINAL UNEDITED MANUSCRIPT
tolian fault. They showed that only the interseismic loading has brought closer to failure the fault on which the Bingol earthquake occurred. Likewise, Kariche et al. (2018) computed the stress transfers between two Mw ∼ 6 earthquakes that broke conjugate faults in the Alboran Sea and Rif Mountains, Morocco, in 1994 and 2004. They showed that the 1994 earthquake produced positive stress changes along the entire 2004 rupture only if an along-strike variable effective coefficient of friction is considered for the receiver fault. These two examples show that in complex fault systems, the causal connections between successive earthquakes are not straightforward. To bet-ter understand earthquake triggering in complex fault systems, it is thus essential to increase the number of Coulomb stress studies in such systems.
In mainshock-aftershocks triggering studies, the complexity of the source and receiver faults can have a large impact on the induced stress field and forward calculation of the Coulomb stress change. Concerning the source, the detailed rupture geometry may be the prime parameter to take into account to model a stress field that can explain the majority of off-fault aftershocks (e.g. Steacy et al. 2004). On the receiver side, McCloskey et al. (2003) suggest that the geological ob-served structures should be used in forward modelling of aftershock populations whereas regional stress field would not be as necessary. In a more extensive study, Steacy et al. (2005a) confirm the importance of the pre-existing structures but highlight that including the regional stress field, if it is well known, improves the predictive capacity of the model. More and more mainshock-mainshock studies also take into account more realistic (i.e. less simplified) representations of fault geometry or test its influence (e.g. Nalbant et al. 2006; Shan et al. 2013; Mildon et al. 2016, 2017). For se-quences within collinear or parallel fault systems, a simplified representation of the fault geometry could be sufficient to explain the sequence at the first order. However, for a complex fault sys-tem configuration, an accurate representation of the fault geometry could be one of the essential ingredients to accurately assess the stress transfers.
The goal of this article is to complete the few studies that have focused on earthquake trigger-ing in complex fault system and to evaluate the ability of coseismic (i.e. static) and postseismic (i.e. viscoelastic) Coulomb stress transfers to explain the succession of earthquakes in such a context. We focus on the North-East Lut, Iran, earthquake sequence that includes 11 Mw+5.9 earthquakes
ORIGINAL UNEDITED MANUSCRIPT
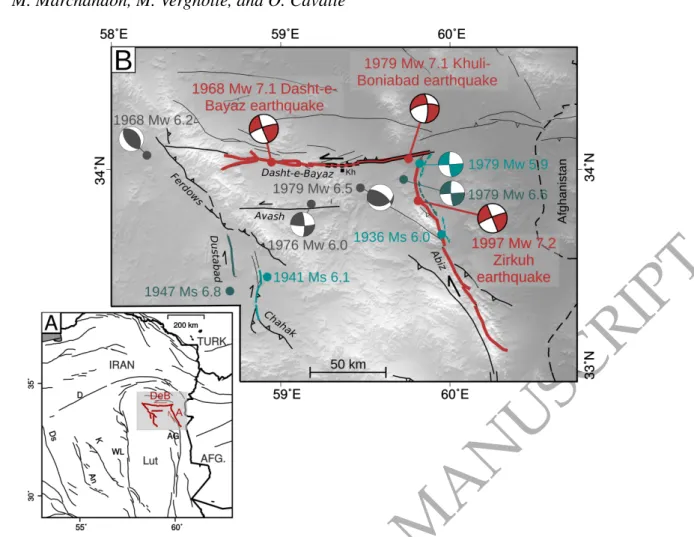
that occurred mainly on the conjugate east-west left-lateral Dasht-e-Bayaz and north-south right-lateral Abiz faults between 1936 and 1997 (Berberian & Yeats (1999); Walker et al. (2011), Fig. 1). The three largest earthquakes of the sequence are Mw7+ earthquakes, namely the 1968 Mw 7.1 Dasht-e-Bayaz earthquake, the 1979 Mw 7.1 Khuli-Boniabad earthquake and the 1997 Mw 7.2 Zirkuh earthquake, and occurred within 30 years only (Berberian & Yeats 1999). They suc-cessively broke the western part of the Dasht-e-Bayaz fault, the eastern part of the Dasht-e-Bayaz fault and the Abiz fault respectively (Fig. 1).
We choose this sequence for three reasons. First, although the recurrence time on the Dasht-e-Bayaz and Abiz faults is unknown, paleoseismological estimates for similar faults in Eastern Iran are about thousands of years (e.g. Nazari et al. 2013). If we consider that the occurrence of seismic events is a Poissonian process, the probability of having three earthquakes within 30 years would be ∼ 0.1% considering a recurrence time of 1000 years. Hence, the occurrence of the three Mw7+ earthquakes within 30 years is not likely to be coincidental. Second, for such a remote area and the time frame considered (pre-modern seismology and spatial geodesy time for most of the earthquakes of the sequence), an extensive set of observations is available: the precise mapping of the NE Lut faults (e.g. Walpersdorf et al. 2014), the precise mapping of the three Mw7+ surface rupture traces and fault surface offsets (e.g. Marchandon et al. 2018a) and the inferred geometry at depth of the Abiz fault (Marchandon et al. 2018b). Third, understanding the NE Lut sequence is challenging. Indeed, a first-order modelling (i.e. using simplified source and receiver fault geometries) of the stress transfers between the Dasht-e-Bayaz and Abiz faults shows that the Dasht-e-Bayaz and Khuli-Boniabad earthquakes produce negative stress changes on the Abiz fault (Fig. S1). An overlooked study would thus conclude that Coulomb stress interaction processes fail to explain the sequence. However, based on the current knowledge about the fault system and the individual large earthquakes, we thoroughly address this issue by performing more specific and detailed modelling.
In the following sections, we first present the NE Lut sequence as well as the method and the model parametrisation. Then, after presenting the reference model based on our best knowledge of the three main earthquakes, we carry out some parametric tests and then include the remaining
ORIGINAL UNEDITED MANUSCRIPT
8 earthquakes to the sequence modelling. We first discuss the results in terms of robustness and relative contribution of the different parameters to the Coulomb stress changes. Then, we discuss the possible correlation between the rupture extension of an earthquake and the Coulomb stress changes due to the previous ones. Finally, we extend the modelling to the major faults in the area and up to recent time in order to discuss which faults could present a higher risk to break.
2 THE 1936-1997 NE LUT EARTHQUAKE SEQUENCE
In NE Lut (eastern Iran), after three centuries of quiescence (Ambraseys & Melville 1977; Berbe-rian et al. 1999), a sequence of moderate to large earthquakes occurred on the East-West (EW) Dasht-e-Bayaz fault, North-South (NS) Abiz fault, and others secondary surrounding faults (Fig. 1). This conjugate strike-slip fault system belongs to the larger NS right-lateral and EW left-lateral fault system of eastern Iran that accommodates the right-left-lateral shear between Iran to the west and the stable Afghanistan to the east (Berberian et al. 1999; Vernant et al. 2004; Walker et al. 2011; Walpersdorf et al. 2014). This sequence, responsible for the death of about 15000 people (National Geophysical Data Center / World Data Service NGDC/WDS), is composed of all the Mw>5.9 earthquakes that have occurred since the beginning of the 20th century in NE Lut. More precisely, the sequence includes 11 events that took place during the period 1936-1997, three of which were earthquakes of Mw>7 (Fig. 1b). The 1968 Mw 7.1 Dasht-e-Bayaz and the 1979 Mw 7.1 Khuli-Boniabad left-lateral earthquakes broke the west and east sections of the 150 km-long Dasht-e-Bayaz fault, respectively (e.g. Ambraseys & Tchalenko 1969; Nowroozi & Mohajer-Ashjai 1980). The 1997 Mw 7.2 Zirkuh right-lateral earthquake broke the entire 125 km-long Abiz fault (e.g. Berberian et al. 1999). Among the eight remaining earthquakes (Mw 5.9-6.6), five were right-lateral earthquakes. They broke the northern part of the Abiz fault three times (in 1937, November 1979 and December 1979), the Dustabad fault in 1947, and part of the Chahak fault in 1941 (Ambraseys & Melville 1977; Berberian & Yeats 1999). Two are reverse earthquakes that broke the Ferdows fault in 1968 and an unknown fault in 1979 (Ambraseys & Melville 1977; Crampin 1969). The last event is a left-lateral earthquake that broke the Avash fault in 1976 (Am-braseys & Melville 1977; Walker et al. 2011). Surface rupture traces have been observed for all
ORIGINAL UNEDITED MANUSCRIPT
Figure 1. Regional tectonic overview and the NE Lut earthquake sequence. (A) Map of eastern Iran show-ing the main tectonic faults (thin black lines) and the study area in (B) (light grey box). The faults involved in the NE Lut sequence are highlighted in red. Ds, An, K, D, WL, DeB, A and AG mean Deshir, Anar, Kuhbanan, Doruneh, West Lut, Dasht-e-Bayaz, Abiz, and Avaz-Gazik faults respectively. Fault mapping is from Walpersdorf et al. (2014). TURK and AFG are for Turkmenistan and Afghanistan. (B) Topographic map of northeastern Iran showing the epicentres of the 11 events of the NE Lut sequence (dots). The epicen-tres of historical earthquakes (pre-1968) are from Ambraseys & Melville (1982) and those of instrumental earthquakes are from Engdahl et al. (2006). Mw > 7 earthquakes and their surface rupture are plotted in red whereas moderate earthquakes (5.9 < Mw < 7) and their surface rupture are plotted in blue. Fault names are written in italic and the black square locates the city of Khuli (Kh). The surface ruptures of the Dasht-e-Bayaz and the Khuli-Boniabad earthquakes overlap near Khuli (dashed black line). The double dotted arrows indicate the surface rupture extent of the three moderate earthquakes that broke the Abiz fault. No surface rupture has been reported for the earthquakes plotted in grey. The 1979 Mw 6.5 event has broken an unmapped fault.
ORIGINAL UNEDITED MANUSCRIPT
earthquakes except three (Ambraseys & Jackson 1998; Ambraseys & Melville 1982, 1977; Am-braseys & Tchalenko 1969; Berberian & Yeats 1999; Marchandon et al. 2018a) and are shown in Fig. 1b. Detailed coseismic surface offsets have also been documented for the 3 Mw>7 earth-quakes (Ambraseys & Tchalenko 1969; Nowroozi & Mohajer-Ashjai 1980; Berberian et al. 1999; Marchandon et al. 2018a,b).
3 METHOD AND PARAMETRISATION
3.1 Coseismic, postseismic, and interseismic stress changes
The Coulomb stress change, ∆τc produced by an earthquake (source) and computed on a fault
plane with a given geometry (receiver) is defined as (Scholz 2002):
∆τc= ∆τ − µ(∆σn− ∆P ) (1)
where ∆τ is the shear stress change, ∆σn is the normal stress change, µ is the coefficient of
friction, and ∆P is the pore pressure change. The pore fluid pressure change being assumed to be proportional to the normal stress change, it is incorporated into an effective coefficient of friction µ0(Reasenberg & Simpson 1997). Thus, equation 1 becomes:
∆τc= ∆τ − µ0∆σn (2)
The shear stress change is positive in the slip direction of the receiver fault and the normal stress change is positive when the receiver fault is clamped. A positive Coulomb stress change brings the receiver fault closer to failure whereas a negative Coulomb stress change brings the receiver fault further away from failure.
We compute the coseismic stress changes using the software Coulomb C3.3 (Lin & Stein 2004; Toda et al. 2005) that models sources as dislocations in an elastic half-space (Okada 1992). We also take into account the postseismic stress changes due to the viscoelastic relaxation of the lithosphere. As no quantitative constraint on the viscoelastic structure of the lithosphere in NE Iran exists, we assume that the postseismic stress changes after the total relaxation of the lithosphere are equal to the stress changes produced by a dislocation going from the seismogenic to an infinite depth in an elastic half-space (e.g. Ch´ery et al. 2001). Indeed, it has been demonstrated
ORIGINAL UNEDITED MANUSCRIPT
that slip on the deeper part of the fault and viscoelastic relaxation induce similar horizontal surface displacements (Savage 1990). The postseismic stress change as a function of time is then computed assuming that it evolves exponentially with time (e.g. Ch´ery et al. 2001):
∆τcpost(t) = (1 − e
−t×G
η) × ∆τ
crelax (3)
with t the elapsed time since the earthquake, G the shear modulus and η the viscosity of the viscoelastic layers of the lithosphere. While the viscoelastic structure of the lithosphere in NE Iran is not well constrained, several evidences would favour a strong viscosity. Firstly, short-term and long-term observations of the postseismic displacements after the Zirkuh earthquake, from 2 months to 2 years (see Sudhaus & Jonsson (2011) and the discussion in Marchandon et al. (2018b)) and from 7 to 13 years (Mousavi 2013), show that the postseismic displacements are very small on both time scales. Secondly, the modelling of the 1997-2008 GPS velocity field indicates that Eastern Iran can be divided into several blocks in which the estimated internal deformation is very small (Walpersdorf et al. 2014). These two observations suggest a strong viscosity of the lithosphere. We thus use a viscosity of 1 × 10²⁰ Pa.s to compute the temporal evolution of the postseismic stress changes.
To compute the Coulomb stress changes induced by the interseismic loading, we test two ap-proaches. In the first approach (e.g. Freed et al. 2007), we use the 1997-2008 interseismic GPS velocity field of NE Iran (Walpersdorf et al. 2014) to derive the interseismic deformation field (Fig. S2), that is then used to calculate the Coulomb stress changes on the long-term surface fault trace (Fig. S3). To calculate the deformation field, we use the method of Pollitz & Vergnolle (2006) (Appendix A?) that models strain rates as continuous functions within the GPS network. It thus assumes that there is no creeping fault in the studied area that would produce a discontinuous ve-locity field. In eastern Iran, none of the faults is known to be creeping. At each location of a regular grid (here every 0.25◦), the estimates of the velocity gradients are obtained by minimisation of a misfit function that is the sum of the velocity field misfits weighted by a Gaussian smoothing function (see eq. 5 and 6 in Appendix A of Pollitz & Vergnolle (2006). The minimisation is solved
? Available at https://www.geoazur.fr/Publis/2006_Pollitz_GJI_AP.pdf
ORIGINAL UNEDITED MANUSCRIPT
using a least square inversion scheme. The Gaussian smoothing function uses a scale distance d to weight the contribution of the observed velocities to the estimated velocity gradients. The far-ther is the station from the evaluated point, the lesser the station contributes to the estimation of the velocity gradient (e.g. contribution of 60% at distance d, 13% at 2d and 1% at 3d). The data errors are propagated through the analysis and allow to reject estimations with error higher than 5 × 10⁻⁸/yr. We use two values of d, 40 and 50km, to obtain both the best detailed velocity gradient field when the density of the velocity field allows it, and the largest number of retained velocity gradient estimates (Pollitz & Vergnolle 2006). The deformation field (i.e. strain rate field) is finally derived from these velocity gradient estimates. It is then interpolated at the location of the long-term surface fault traces using a bicubic interpolation and the stress tensor is computed (Lin & Stein 2004; Toda et al. 2005). Finally, from the stress tensor and knowing the geometry and the kinematics of the faults (i.e. strike, dip, and rake), the Coulomb stress is computed using Coulomb C3.3 (Lin & Stein 2004; Toda et al. 2005). All faults display mainly positive Coulomb stress changes of 6.2 × 10⁻⁴ MPa/yr on average. The Coulomb stress changes on the Abiz and Dustabad faults are greater than on the others faults of the system (1 × 10⁻³MPa/yr on average).
In the second approach, we estimate the interseismic loading by modelling a continuous creep-ing zone on the down-dip continuity of each fault of the NE Lut system (e.g. Stein et al. 1997; Nalbant et al. 2002; Wedmore et al. 2017). The Coulomb stress changes produced by the creeping segments are then computed on the portions of the fault located in the upper crust. We model the creep between 15 and 40 km depth, the lower limit corresponding to the Moho depth in Eastern Iran (Entezar-Saadat et al. 2017). For the Dasht-e-Bayaz and Abiz faults, the slip rates we impose to the deep creeping zone are constrained by surface observations. On the Dash-e-Bayaz fault, the estimated Holocene slip rate is 2.5 mm/yr (Fattahi et al. 2015; Fattahi 2015) while GPS and InSAR data would suggest a lower rate (Walpersdorf et al. 2014; Mousavi 2013). On the Abiz fault, there is no specific slip rate estimate. However, the Abiz fault is the northernmost segment of the 600-km-long East Lut fault for which a GPS slip rate is estimated at 5.6±0.6 mm/yr (Walpersdorf et al. 2014) and an Holocene slip rate is estimated at 8±4 mm/yr (central East Lut fault, Meyer & Dortz 2007). We thus choose a value of 7 mm/yr as a compromise between the Holocene and geodetic
ORIGINAL UNEDITED MANUSCRIPT
slip rates. On the other faults of the system, the slip rates are unknown but we assume they are slow as InSAR data does not capture any signal across the faults (Mousavi 2013). We thus use the same slip rate as for the Dasht-e-Bayaz fault (2.5 mm/yr). The interseismic Coulomb stress changes, obtained with this method, are shown in Fig. S4. The Coulomb stress changes on the Abiz fault is about 3 × 10⁻³ MPa/yr whereas they are about 1 × 10⁻³MPa/yr on the other faults of the system. The contribution of the interseismic loading with this approach is thus 3 times greater for the Abiz fault than with the first approach, similar for the Dustabad fault, and 1.8 times greater for the other faults.
The two approaches have their pros and cons. With the first one, we assume that the interseis-mic loading on the upper crust is uniform with depth based on the calculation made at the surface, and inaccuracies can emerge due to the sparse distribution of GPS data. However, this method uses the interseismic deformation field derived from geodetic measurements and thus relies on observations. The second method allows computing depth-dependent interseismic Coulomb stress changes but requires to know the slip rates of the considered faults. As it happens, the slip rates of the NE Lut faults are mostly unknown. The resulting model is thus more physically reasonable but relies mainly on assumptions. We consider that we use very likely overestimated slip rates for all the faults. Consequently, the interseismic Coulomb stress changes we obtain with this approach can be viewed as the maximum possible contribution of the interseismic loading. In the following, we choose to present the results using the first approach but present the alternative results, with the second approach, in the supplementary material. Nevertheless, whatever the method used, the main conclusions of the paper remain.
The most relevant depth to compute the Coulomb stress is where earthquakes nucleate, i.e between 5 and 15 km depth for most earthquakes in this part of Iran (Engdhal et al, 2006). Results, in map view, are thus shown at 10 km depth but we use the variation of Coulomb stress change with depth, in the range 5 -15 km, to better assess the uncertainties on the calculation. We use a shear modulus of 3 × 10¹⁰Pa.
ORIGINAL UNEDITED MANUSCRIPT
3.2 Parametrisation of the source and receiver faults
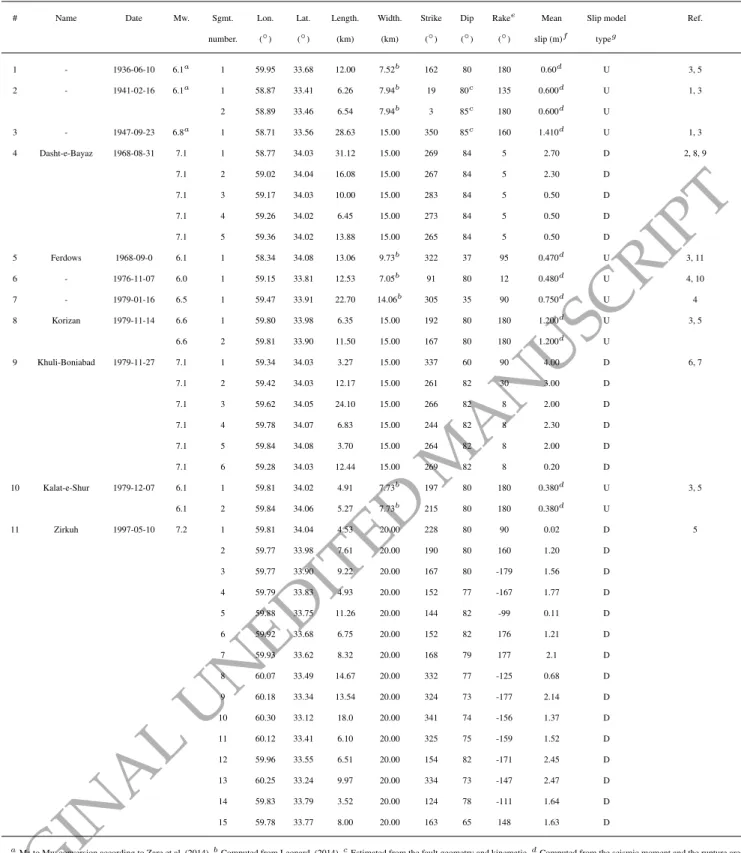
From the literature, we gathered sufficient information to model the 11 earthquakes of the NE Lut sequence. Each earthquake of the sequence is thus considered as a source. Each of them is modelled by one or more segments depending on its magnitude and complexity (Fig. 2). Each segment is characterized by 6 parameters: length, strike, width, dip, rake, and slip. The values assigned to each parameter are listed in Table 1.
Regarding the source geometry, the strike and length of the rupture are taken from the litera-ture. The three Mw>7 earthquakes are modelled by several segments that precisely follow their surface rupture traces. The modelled segments are in agreement with field mapping for the Dasht-e-Bayaz earthquake (Ambraseys & Tchalenko 1969; Tchalenko & Ambraseys 1970; Tchalenko & Berberian 1975, Fig. 2 and Table 1) and with field measurements and optical correlation data for the Khuli-Boniabad and Zirkuh earthquakes (Nowroozi & Mohajer-Ashjai 1980; Berberian et al. 1999; Marchandon et al. 2018a,b, Fig. 2 and Table 1). No surface rupture has been observed for the 1968 Ferdows (#5), the 1979 (#6) and the 01/1979 (#7) earthquakes; thus, their lengths come from Leonards empirical relationships (2014). The 01/1979 (#7) earthquake broke an unmapped fault; we thus determine the strike of this earthquake using both its focal mechanism and the surrounding fault strikes (Fig. 1 and Fig. 2).
For the historical earthquakes, the fault dip is inferred from the fault kinematics (e.g. 90◦for a strike-slip fault) whereas we use the dip of the focal mechanism for instrumental earthquake. For the Zirkuh earthquake and other smaller earthquakes that broke the Abiz fault, we use the dip determined by the source modelling of the Zirkuh earthquake (Marchandon et al. 2018b). We fix the width at 15 km for the Mw>6.6 earthquakes which is the width of the seismogenic crust in Eastern Iran (Engdahl et al. 2006). For smaller earthquakes, we estimate the width using Leonards empirical relationships (2014).
For the earthquake slip distributions, we use a homogeneous slip inferred from the seismic moment except for the three Mw>7 earthquakes of the sequence. For the 1968 Dasht-e-Bayaz earthquake (#4), the slip distribution is constrained by field fault offset measurements (Ambraseys & Tchalenko 1969; Tchalenko & Ambraseys 1970; Tchalenko & Berberian 1975). For the 1979
ORIGINAL UNEDITED MANUSCRIPT
Khuli-Boniabad earthquake (#9), the slip distribution is constrained by optical correlation and field fault offset measurements (Marchandon et al. 2018a; Nowroozi & Mohajer-Ashjai 1980, respec-tively). Finally, for the Zirkuh earthquake, we use the slip model of Marchandon et al. (2018b). For historical earthquakes, the rake is inferred from field observations or from the fault kinematic. For instrumental earthquakes, we use the focal mechanism rake. Finally, for the Zirkuh earthquake, the rake is inferred from the slip model of Marchandon et al. (2018b).
The receiver faults correspond to the long-term trace of the NE Lut faults (Walpersdorf et al. 2014). For each receiver fault except the Abiz fault, the rake and the dip are inferred from the fault kinematic. For the Abiz fault, the rake is inferred from the fault kinematic and the dip from the source modelling of the Zirkuh earthquake (Marchandon et al. 2018b). The value assigned to the effective coefficient of friction depends on the fault maturity. Indeed, the effective coefficient of friction is assumed to vary from 0 for mature faults to 0.8 for young and immature faults (King et al. 1994). A value around 0.4 is generally used (e.g. King et al. 1994; Nalbant et al. 2005b; Mildon et al. 2016; Wedmore et al. 2017). However, we suppose here that the Abiz and Dasht-e-Bayaz faults do not have the same maturity. According to Marchandon et al. (2018a), the Abiz fault would be more mature than the Dasht-e-Bayaz fault. We thus use an effective coefficient of friction of 0.2 and 0.5 for the Abiz and Dasht-e-Bayaz fault respectively. The other receiver faults are secondary structures that we assume not very mature. We thus also take an effective coefficient of friction of 0.5 for these faults. The parameters (dip, rake, effective coefficient of friction) and location of the receiver faults are shown in Table S1 and Fig. 2 respectively.
4 RESULTS
4.1 Realistic modelling of the source and receiver faults
As said in introduction, when the modelling of the Dasht-e-Bayaz and Abiz faults is simplified, that is, when each fault is modelled by one single segment and when the slip of the source is ho-mogeneous, the Dasht-e-Bayaz and Khuli-Boniabad earthquakes produce negative Coulomb stress changes on the Abiz fault (Fig. S1). In this section, we evaluate to what extent the complexities of the ruptures and receiver faults impact the computed Coulomb stress changes by modelling them
ORIGINAL UNEDITED MANUSCRIPT
Table 1. Source parameters used in the modelling
# Name Date Mw. Sgmt. Lon. Lat. Length. Width. Strike Dip Rakee Mean Slip model Ref.
number. (◦) (◦) (km) (km) (◦) (◦) (◦) slip (m)f typeg
1 - 1936-06-10 6.1a 1 59.95 33.68 12.00 7.52b 162 80 180 0.60d U 3, 5 2 - 1941-02-16 6.1a 1 58.87 33.41 6.26 7.94b 19 80c 135 0.600d U 1, 3 2 58.89 33.46 6.54 7.94b 3 85c 180 0.600d U 3 - 1947-09-23 6.8a 1 58.71 33.56 28.63 15.00 350 85c 160 1.410d U 1, 3 4 Dasht-e-Bayaz 1968-08-31 7.1 1 58.77 34.03 31.12 15.00 269 84 5 2.70 D 2, 8, 9 7.1 2 59.02 34.04 16.08 15.00 267 84 5 2.30 D 7.1 3 59.17 34.03 10.00 15.00 283 84 5 0.50 D 7.1 4 59.26 34.02 6.45 15.00 273 84 5 0.50 D 7.1 5 59.36 34.02 13.88 15.00 265 84 5 0.50 D 5 Ferdows 1968-09-0 6.1 1 58.34 34.08 13.06 9.73b 322 37 95 0.470d U 3, 11 6 - 1976-11-07 6.0 1 59.15 33.81 12.53 7.05b 91 80 12 0.480d U 4, 10 7 - 1979-01-16 6.5 1 59.47 33.91 22.70 14.06b 305 35 90 0.750d U 4 8 Korizan 1979-11-14 6.6 1 59.80 33.98 6.35 15.00 192 80 180 1.200d U 3, 5 6.6 2 59.81 33.90 11.50 15.00 167 80 180 1.200d U 9 Khuli-Boniabad 1979-11-27 7.1 1 59.34 34.03 3.27 15.00 337 60 90 4.00 D 6, 7 7.1 2 59.42 34.03 12.17 15.00 261 82 30 3.00 D 7.1 3 59.62 34.05 24.10 15.00 266 82 8 2.00 D 7.1 4 59.78 34.07 6.83 15.00 244 82 8 2.30 D 7.1 5 59.84 34.08 3.70 15.00 264 82 8 2.00 D 7.1 6 59.28 34.03 12.44 15.00 269 82 8 0.20 D 10 Kalat-e-Shur 1979-12-07 6.1 1 59.81 34.02 4.91 7.73b 197 80 180 0.380d U 3, 5 6.1 2 59.84 34.06 5.27 7.73b 215 80 180 0.380d U 11 Zirkuh 1997-05-10 7.2 1 59.81 34.04 4.53 20.00 228 80 90 0.02 D 5 2 59.77 33.98 7.61 20.00 190 80 160 1.20 D 3 59.77 33.90 9.22 20.00 167 80 -179 1.56 D 4 59.79 33.83 4.93 20.00 152 77 -167 1.77 D 5 59.88 33.75 11.26 20.00 144 82 -99 0.11 D 6 59.92 33.68 6.75 20.00 152 82 176 1.21 D 7 59.93 33.62 8.32 20.00 168 79 177 2.1 D 8 60.07 33.49 14.67 20.00 332 77 -125 0.68 D 9 60.18 33.34 13.54 20.00 324 73 -177 2.14 D 10 60.30 33.12 18.0 20.00 341 74 -156 1.37 D 11 60.12 33.41 6.10 20.00 325 75 -159 1.52 D 12 59.96 33.55 6.51 20.00 154 82 -171 2.45 D 13 60.25 33.24 9.97 20.00 334 73 -147 2.47 D 14 59.83 33.79 3.52 20.00 124 78 -111 1.64 D 15 59.78 33.77 8.00 20.00 163 65 148 1.63 D
aMs to Mw conversion according to Zare et al. (2014),bComputed from Leonard (2014),cEstimated from the fault geometry and kinematic,dComputed from the seismic moment and the rupture area.
eIn the convention of Aki & Richards (1980),fMean slip over the considered segment,gU = Uniform slip; D = Distributed slip (see Fig. 2).
1Ambraseys & Jackson (1998),2Ambraseys & Tchalenko (1969),3Berberian & Yeats (1999),4Jackson & Mckenzie (1984),5Marchandon et al. (2018b),6Marchandon et al. (2018a).
7Nowroozi & Mohajer-Ashjai (1980),8Tchalenko & Ambraseys (1970),9Tchalenko & Berberian (1975),10Walker et al. (2004),11Walker et al. (2003)
ORIGINAL UNEDITED MANUSCRIPT
Figure 2. NE Lut faults and 3D representation of the sources used in the modelling. Each number refers to an earthquake of the NE Lut sequence listed in Table 1. The source of the 1997 Mw 7.2 Zirkuh earthquake (#11) is shifted for visibility. The magnitude of the earthquakes #1-#3 is converted from Ms to Mw according to the relationships of Zare et al. (2014). The gray thin lines are the receiver faults corresponding to the long-term surface trace of the NE Lut faults. The source fault parameters as well as the references used to constrain them are listed in Table 1. The receiver fault parameters are listed in Table S1.
as realistically as possible. The parameters defining our reference model are described in section 3.2.
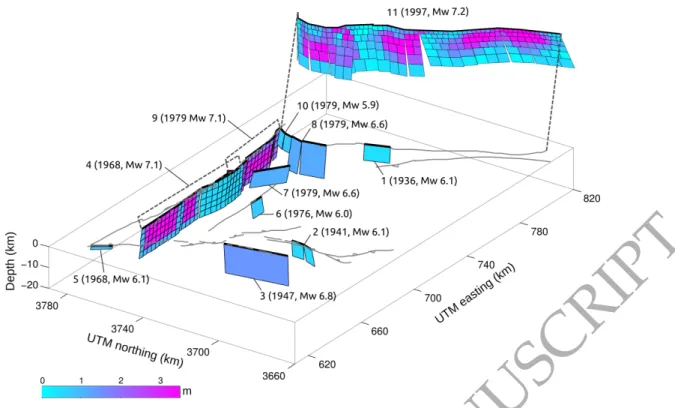
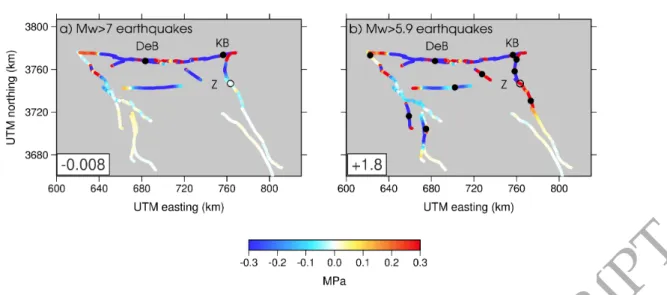
Fig. 3 shows the Coulomb stress changes on the NE Lut faults induced by the coseismic and postseismic deformation of the Dasht-e-Bayaz and Khuli-Boniabad earthquakes immediately be-fore the occurrence of the Zirkuh earthquake. The coseismic and 1968-1997 postseismic Coulomb stress changes induced by the Dasht-e-Bayaz earthquake are negative on almost the entire Abiz fault (Fig. 3a,d) and the Zirkuh earthquakes epicentre lies in a zone of cumulative coseismic and postseismic stress changes of ∼-0.04 MPa (Fig. 3g). The coseismic deformation of the Khuli-Boniabad earthquake induces strong negative and positive Coulomb stress changes on the north-ern part of the Abiz fault and slightly positive Coulomb stress changes on the central and south parts of the Abiz fault except near 3730 km (Fig. 3b). The Khuli-Boniabad 1979-1997
ORIGINAL UNEDITED MANUSCRIPT
mic deformation produces positive Coulomb stress changes all along the Abiz fault (Fig. 3e). The Zirkuh earthquakes epicentre lies in a zone of positive cumulative coseismic and postseismic stress changes (∼ 0.03 MPa, Fig. 3h) associated to the Khuli-Boniabad earthquake. Finally, the sum of Coulomb stress changes induced by the Dasht-e-Bayaz and Khuli-Boniabad earthquakes on the Abiz fault is mainly negative (∼ -0.04 MPa) except in the northernmost section of the fault where Coulomb stress changes reach ∼3 MPa (Fig. 3i). Therefore, the Dasht-e-Bayaz and Khuli-Boniabad earthquakes alone have not favoured the occurrence of the Zirkuh earthquake. The results at the epicentral area does not change much with respect to the simplest model. However, the Coulomb stress changes along the Abiz fault are much more variable, with values ranging from -0.4 to 3 MPa depending on the strike and location of the modelled segments.
4.2 Parametric tests and robustness
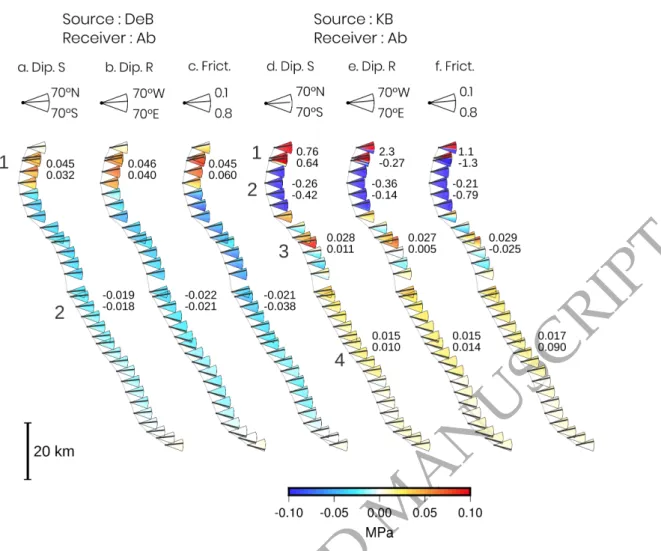
We run a series of comprehensive tests to estimate the sensitivity of the results shown in Fig. 3 to the model parameters (Fig. 4). Indeed, if the location, the strike, and the mean slip of each segment are well constrained by the rupture trace mappings and fault offset measurements, the dip of each segment is not. The impact of a dip change for the receiver and source faults on the Coulomb stress change is thus evaluated (Fig. 4). As the Dasht-e-Bayaz and Abiz faults are mostly strike-slip faults, we test dip values ranging from 70◦N to 70◦S for the Dasht-e-Bayaz fault and from 70◦W to 70◦E for the Abiz fault. We also evaluate the impact of the effective coefficient of friction, which is, in our case, only constrained qualitatively (see section 3.2 and Fig. 4). We test values from 0.1 to 0.8. Finally, we assess the impact of a heterogeneous slip versus a homogeneous slip on each segment (Fig. S5).
In the range of tested values, the Dasht-e-Bayaz fault dip, the Abiz fault dip, and the effective coefficient of friction of the Abiz fault do not have a significant impact on the cumulative co-and postseismic Coulomb stress changes induced by the Dasht-e-Bayaz earthquake on the Abiz fault (Fig. 4a-c). Indeed, the largest variation is about ± 0.008 MPa when testing the effective coefficient of friction (Fig. 4c). Moreover, the general pattern of Coulomb stress changes along
ORIGINAL UNEDITED MANUSCRIPT
Figure 3. Coulomb stress changes induced by the Dasht-e-Bayaz and Khuli-Boniabad earthquakes on the NE Lut faults immediately before the occurrence of the Zirkuh earthquake (1997). Figures a, b, and c show the coseismic Coulomb stress changes produced by the Dasht-e-Bayaz earthquake, the Khuli-Boniabad earthquake, and by the sum of both earthquakes respectively. Figures d, e, and f show the postseismic Coulomb stress changes due to viscoelastic relaxation (in 1997) produced by the Dasht-e-Bayaz earthquake, the Khuli-Boniabad earthquake, and by the sum of both earthquakes respectively. Finally, figures g, h, and i show the sum of the coseismic and postseismic Coulomb stress changes (in 1997) produced by the Dasht-e-Bayaz earthquake, the Khuli-Boniabad earthquake, and by the sum of both earthquakes respectively. The Coulomb stress changes are computed at 10 km depth with a viscosity of 1 × 10²⁰Pa.s. Black circles locate the epicentre of the Dasht-e-Bayaz (DeB), Khuli-Boniabad (KB), and Zirkuh (Z) earthquakes (Engdahl et al. 2006). The color scale is saturated at ± 0.1 MPa to emphasize regions of low stress changes. However, at the left bottom of each plot, the Coulomb stress change at the epicentre of the Zirkuh earthquake is indicated. Note that the postseismic Coulomb stress change is about an order of magnitude lower than the coseismic Coulomb stress change.
ORIGINAL UNEDITED MANUSCRIPT
the fault remains the same regardless of the tested parameters, positive in the northernmost part (∼0.04 MPa) and negative elsewhere (∼-0.02 MPa, Fig. 4a-c).
When the source is the Khuli-Boniabad earthquake, the modelling parameters have a greater impact on the Coulomb stress changes (Fig. 4d-f). The cumulative co- and postseismic Coulomb stress changes allow dividing the Abiz fault into four sections. The Coulomb stress changes for the first section of the fault, the closest to the junction with the Dash-e-Bayaz fault, are globally positive (up to 2.3 MPa), except for extreme east dipping values for the Abiz fault or extremely high values for the effective friction coefficient (up to -0.27 MPa and -1.3 MPa, respectively, Fig. 4e-f). In the second section of the fault, the Coulomb stress changes are negative for all parameter combinations, with variations up to ±0.3 MPa depending on the effective friction coefficient. In the third section of the Abiz fault, Coulomb stress changes show subtle variations of ± 0.002 MPa to ±0.11 MPa depending on the parameter tested. This part of the fault is brought closer to failure when the source fault is north-dipping, when the Abiz fault is west-dipping and when the effective coefficient of friction is low (Fig. 4d-f). Finally, in the fourth section of the Abiz fault, the source and receiver dips do not have much impact on the calculation (less than ± 0.002MPa) while the effective coefficient of friction can generate up to ± 0.036MPa variations. However, the Coulomb stress changes are always positive.
To evaluate the impact of the slip model on the results, we compute the Coulomb stress changes produced by the Dasht-e-Bayaz and the Khuli-Boniabad earthquakes on the Abiz fault using ho-mogeneous slip models rather than distributed ones (Fig. S5). Using a hoho-mogeneous slip model for the Dasht-e-Bayaz earthquake does not change the Coulomb stress changes on the Abiz fault (differences lower than 0.005 MPa, Fig. S5a). When the Khuli-Boniabad is the source, the differ-ences are significant in the northern part of the fault (> 0.2 MPa) and negligible elsewhere (Fig. S5b). Modelling the source earthquake with a distributed slip model (that is more realistic if well constrained) is thus necessary when a small distance separates the source and receiver faults.
Finally, our parametric test shows that variations of the Coulomb stress change can be high (0.1 to 1.3 MPa) in the northern part of the Abiz fault and the Coulomb stress change sign can even change on its northernmost part when using extreme, and unlikely, values for the Abiz fault dip
ORIGINAL UNEDITED MANUSCRIPT
and effective friction coefficient (Fig. 4e-f). Elsewhere, the obtained variations are much lower, even negligible (about 10−3 MPa), and do not change the sign of the Coulomb stress changes despite the wide range of tested values. More interestingly, our reference model (thick black line on each pie chart in Fig. 4d-f) turns out to be the most capable of producing positive Coulomb stress changes on the Abiz fault (see for example section 3 of the Abiz fault in Fig. 4d-f). It is also the one that prevents a large decrease of Coulomb stress change at the Zirkuh epicentral area. It is thus worthwhile modelling the sources and receivers as precisely as possible, especially when source and receiver are close to each other. We will thus continue to model the sequence based on this reference model, in particular for the geometry of the Abiz fault which is well constrained (Marchandon et al. 2018b).
4.3 Stress transfer during the NE Lut sequence
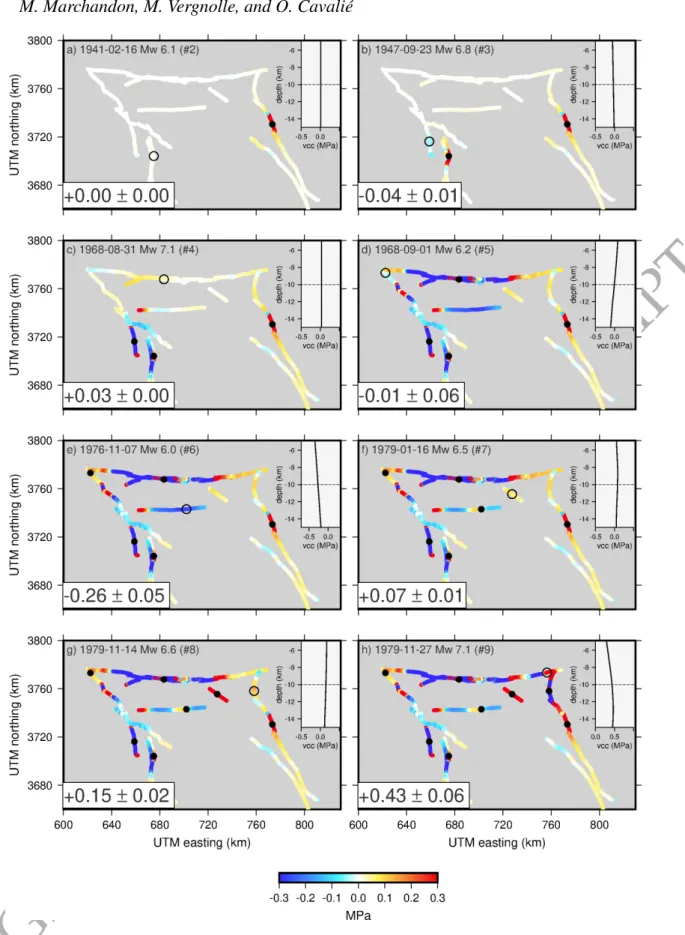
To model the whole seismic sequence, we now include the 8 remaining earthquakes of Mw>5.9, and evaluate how many earthquakes of the sequence are brought closer to rupture thanks to the previous ones, with a special focus on the three Mw>7 earthquakes of the sequence. We calcu-late the Coulomb stress changes on the NE Lut faults immediately before the occurrence of each earthquake of the sequence (Fig. 5). For each date, the coseismic and postseismic Coulomb stress changes produced by the previous earthquakes as well as the interseismic Coulomb stress changes since 1936 are computed and summed.
As shown with the parametric tests, some parameters can affect the Coulomb stress change. Thus, to evaluate the stability of our results for the entire earthquake sequence, we compute the Coulomb stress change uncertainty related to the nucleation depth and to the effective coefficient of friction. All the earthquakes of the sequence probably do not nucleate at the same depth and this information is unknown. However most earthquakes in this part of Iran nucleate between 5 and 15 km depth (Engdahl et al. 2006). We thus compute depth-dependent Coulomb stress changes in this depth range (Fig. 5). We also calculate friction-dependent Coulomb stress changes as in previous section. The Coulomb stress changes obtained at the epicenter of each earthquake as a function of depth (from 5 to 15 km) and effective friction coefficient (from 0.1 to 0.8) are presented on Fig. S8.
ORIGINAL UNEDITED MANUSCRIPT
Figure 4. Impact of the source dip, receiver dip and, effective coefficient of friction on the cumulative coseismic and postseismic (due to viscoelastic relaxation) Coulomb stress changes produced by the Dasht-e-Bayaz (a-c) and Khuli-Boniabad (d-f) earthquakes on the Abiz fault in 1997, prior to the Zirkuh earthquake. At each point of the Abiz fault, the different portions of the pie chart correspond to the Coulomb stress change computed with different values of the tested parameter. The parameter and the range of tested values are indicated above each figure. The reference model is indicated by a thick black line on each pie chart. One parameter is tested at a time, others are set to the reference model. The Coulomb stress changes due to the Dasht-e-Bayaz and Khuli-Boniabad earthquakes allow dividing the Abiz fault in 2 and 4 sections respectively. Each section is indicated by a number on the left side of Fig. 4a and Fig. 4d. The two values indicated next to each section correspond to the mean Coulomb stress change on the considered section for the two extreme values of the tested parameter. The Coulomb stress changes are computed at 10 km depth with a viscosity of 1 × 10²⁰ Pa.s. DeB, KB, Ab, Dip S., Dip R., and Frict. mean Dasht-e-Bayaz, Khuli-Boniabad, Abiz, source dip, receiver dip, and effective coefficient of friction, respectively.
ORIGINAL UNEDITED MANUSCRIPT
The uncertainty on the Coulomb stress change values presented in Fig. 5 and Fig. 6 is the standard deviation of the Coulomb stress changes with respect to depth and effective friction coefficient. We used the whole range of depths but used a range of effective friction coefficients centered around the values we chose based on maturity argument (between 0.1 and 0.3 for the Abiz fault, between 0.4 and 0.6 for the other faults, see section 3.2). Uncertainties are very low for five earthquakes (events #2 to #4, #7 and #8, lower than 0.02 MPa), slightly higher for three earthquakes (events #5, #6 and #9, about 0.06 MPa) and about 0.5 MPa for the two last earthquakes (events #10 and #11). The uncertainties for the last two earthquakes are larger because the epicenter of these earthquakes are located close to segments that have already broken.
Taking into account the uncertainties, the results are clear for 9 out of 10 earthquakes : six of them nucleated (#4, and from #7 to #11) in a zone of positive Coulomb stress change (between 0.05 and 2.4 MPa), one in a zone of nearly null Coulomb stress change (0.006, #2), and two in a zone of negative Coulomb stress change (#3 and #6). Indeed, the earthquake #2 (1941 Ms 6.1) occurred too far (∼100 km) from the earthquake #1 (1936 Ms 6.0) to be impacted and the earthquakes #3 (1947 Ms 6.8) and #6 (1976 Mw 6.0) occurred in zones of negative stress changes induced by the #2 and Dasht-e-Bayaz earthquakes (#4) respectively. For the Ferdows earthquake (#5, 1968, Mw 6.1) which is a dip slip earthquake, the results are less clear: the Coulomb stress change is slightly negative at 10 km depth (-0.01 MPa) and the uncertainty encompasses positive and negative values of Coulomb stress change (± 0.06 MPa). Actually, the uncertainty mainly comes from the variation of the Coulomb stress change with depth: above 9 km depth, the stress change is positive, below 10 km is negative (see inset of Fig. 5d and Fig. S8). Considering the magnitude of the earthquake, it would not be impossible that it nucleated above 10km depth. Finally, using the second approach to model the interseismic Coulomb stress changes (Fig. S6), results are similar, except that earthquakes #5 and #2 are now located in a zone of positive Coulomb stress change due to a favourable interseismic stress change increment (Fig. S6). Overall, stress changes explain most of the succession of earthquakes during the NE Lut sequence (Fig. 5 and Fig. S6).
Immediately before the 1968 Mw 7.1 Bayaz earthquake (#4), almost all the Dasht-e-Bayaz fault is positively loaded with a mean Coulomb stress change of 0.03 MPa. At the time of
ORIGINAL UNEDITED MANUSCRIPT
the Khuli-Boniabad earthquake (#9), its epicentre is located in a zone of positive stress changes (+0.43±0.06 MPa) but one third of the rupture length shows negative Coulomb stress changes. Finally, immediately before the occurrence of the Zirkuh earthquake (#11), almost the entire Abiz fault, the central and southern parts, show positive Coulomb stress changes and the epicentre lies in a largely positive Coulomb stress change zone (+1.84±0.5 MPa) (Fig. 5).
4.4 Contribution of the different Coulomb stress transfer processes
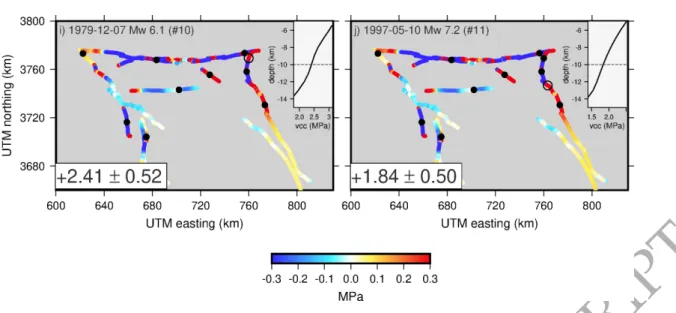
In our modelling, we include co-, post- and interseismic Coulomb stress transfers (see section 3.1). This allows us to evaluate the contribution of these different processes to the total Coulomb stress change (Fig. 6). For each earthquake, Coulomb stress change is calculated at its epicentre immediately prior to its occurrence. Here we detailed the results that take into account the inter-seismic Coulomb stress changes calculated with the first approach, but the results using the second approach are presented in Fig. S7.
For most earthquakes, the coseismic Coulomb stress change is the main contribution to the total Coulomb stress change. Indeed, the difference between the coseismic stress change and the total stress change is low and between 2% and 27% of the total stress change except for earthquakes #3, #4 and #8 (50%). Postseismic stress change is positive or null for all earthquakes and corresponds to 4% of the total stress change in average. The postseismic contribution could be underestimated as we do not take into account the stress changes due to postseismic afterslip. Unfortunately, we do not have any constraint to assess the amount of potential afterslip and thus cannot compute the stress changes due to this process. However, as a clue, note that for the Zirkuh earthquake, Marchandon et al. (2018b) discussed the possibility of afterslip occurring after the earthquake and concluded that if afterslip does occur, most of it is already incorporated in their slip model, and thus in our model.
The interseismic Coulomb stress changes never exceed 0.07 MPa (0.15 MPa with the second approach).The interseismic contribution is thus only significant for the earthquakes that occurred in a zone of small total Coulomb stress change (#2 to #5, and #8). For those earthquakes, the stress increase from the previous earthquakes has only a low impact on their occurrence which
ORIGINAL UNEDITED MANUSCRIPT
Figure 5. Legend on the next page
ORIGINAL UNEDITED MANUSCRIPT
Figure 5. (Continued.) Sum of the coseismic, postseismic (due to viscoelastic relaxation), and interseismic Coulomb stress changes during the NE Lut sequence. Each panel shows the Coulomb stress changes on the NE Lut faults immediately before the occurrence of each earthquake of the sequence. Black closed circles locate the epicentre of the previous earthquakes and the open circle locates the epicentre of the next earthquake. At the top of each plot is indicated the date for which the Coulomb stress change is calculated as well as the corresponding earthquake number (Table 1). At the left bottom of each plot, the value is the Coulomb stress change at the epicentre of the next earthquake. At the right top of each plot is represented the Coulomb stress change with depth at the epicentre of the next earthquake. The gray dotted line shows the depth at which are computed the Coulomb stress changes in the main plot. The Coulomb stress changes are computed at 10 km depth with a viscosity of 1 × 10²⁰Pa.s. The color scale is saturated at ± 0.3 MPa to emphasize regions of low stress changes.
can suggest that the faults on which these earthquakes occurred were already very close to their rupture threshold. Furthermore, for most earthquakes, the Coulomb stress changes produced by the previous events are low compared to the earthquake stress drop that usually ranges between 3 and 10 MPa (Kanamori & Anderson 1975; Allmann & Shearer 2009). This also suggests that the faults that broke during the NE Lut sequence were already close to failure. This could indicate that the seismic cycles of the NE Lut faults are synchronized (Scholz 2010).
The contribution of the postseismic stress change on the total stress change depends on the viscoelastic structure of the medium. A lower viscosity could increase the amplitude of the post-seismic stress changes on the short time scales and thus could impact our results. We thus test a viscosity of 1 × 10¹⁹ Pa.s, a lower viscosity would not be reasonable considering the arguments
ORIGINAL UNEDITED MANUSCRIPT
existing in favor of a strong viscosity (see section 3.1). The maximum difference of total Coulomb stress change is about 0.04 to 0.08 MPa for the four last earthquakes of the sequence. This dif-ference is mainly due to the postseismic relaxation following the Dasht-e-Bayaz earthquake that occurs faster with a lower viscosity. Overall, it enhances the interaction (except for Zirkuh earth-quake) but does not change significantly the total Coulomb stress changes prior to each earthquake (Fig. 6). Indeed, the postseismic stress transfers still contribute for only 16% of the total Coulomb stress change in average.
5 DISCUSSION
5.1 Importance of the fault geometry
Among the two parameters that describe the fault geometry (strike and dip), our results show that the strike has the greatest effect on Coulomb stress changes. Indeed, when the Khuli-Boniabad earthquake and the Abiz fault are modelled by one segment, Coulomb stress changes are nega-tive along the entire Abiz fault (Fig. S1). On the contrary, when the Khuli-Boniabad earthquakes source and the Abiz fault are modelled with a strike variable geometry, Coulomb stress changes are positive on 70% of the Abiz fault (Fig. 3). As shown by our parametric tests, the fault dip has a lower impact on the obtained Coulomb stress changes (see Fig. 4 a,b,d,e). Similar conclusions about the importance of accurately modelling the fault geometry have been made by Mildon et al. (2016).
While Coulomb stress change is very sensitive to the fault geometry, taking a heterogeneous slip model induces significant differences on the results only very close to the source fault (about 20km, northern part of the Abiz fault in Fig. S4). Our findings are similar to the ones of Steacy et al. (2004) that argued that meaningful calculations of Coulomb stress changes can be made as soon as the earthquakes rupture geometry is well constrained and even if the fault slip model used is simplified.
ORIGINAL UNEDITED MANUSCRIPT
Figure 6. Interseismic, coseismic, postseismic (due to viscoelastic relaxation), and total Coulomb stress changes computed at the epicentre of each earthquake just prior to its occurrence. Total Coulomb stress changes computed using a lower viscosity ( 1 × 10¹⁹Pa.s) are also shown. Numbers on the abscissa axis correspond to the earthquake numbers (Table 1). The date and sometimes the name of earthquakes are also indicated. DeB, F, K, KB, KeS, and Z mean Dasht-e-Bayaz, Ferdows, Korizan, Khuli-Boniabad, Kalat-e-Shur and Zirkuh respectively. Note that the y-axis is split in two parts with two different scales.
ORIGINAL UNEDITED MANUSCRIPT
5.2 The Khuli-Boniabad and Zirkuh earthquake occurrences: influence of the moderate earthquakes
We show in section 4.1 that the Dasht-e-Bayaz and Khuli-Boniabad earthquakes have brought the Abiz fault further away from failure. Therefore, these earthquakes alone have not favoured the Zirkuh earthquake (Fig. 7a). On the contrary, if the Coulomb stress changes due to the moderate earthquakes (Mw+5.9) are taken into account, the central and southern parts of the Abiz fault have positive Coulomb stress changes of ∼0.2 MPa in average (Fig. 7b). The Zirkuh earthquake has thus been mainly favoured by the moderate earthquakes of the NE Lut sequence. The 1979 Mw 6.6 Korizan earthquake is the earthquake that contributes the most to the Coulomb stress increase at the Zirkuh earthquakes epicentre (+1.8 MPa). A similar contribution of the moderate earthquakes exists for the Khuli-Boniabad earthquake. Indeed, the Dasht-e-Bayaz earthquake increases the Coulomb stress at the Khuli-Boniabad earthquakes epicentre by only ∼0.05 MPa, whereas the Korizan earthquake increases the Coulomb stress by ∼0.4 MPa. Moderate earthquakes can thus play a major role in triggering large earthquakes as it has already been pointed out by Wang et al. (2017) for the Manyi-Kangding earthquake sequence and by Steacy et al. (2014) for the Canterbury earthquake sequence. This is also consistent with the study of Marsan (2005) who shows, using a probabilistic approach, that the contribution of the small earthquakes to the cumulative static stress at the site of future earthquakes is at least as important as the contribution of large earthquakes.
For the NE Lut sequence, the curved part of the Abiz fault (northernmost part of the fault) seems to have played a role of intermediary allowing the successive ruptures of the Dasht-e-Bayaz and Abiz faults. Indeed, by producing positive Coulomb stress changes on the curved part of the Abiz fault, the Dasht-e-Bayaz earthquake favoured the Korizan earthquake, which in turn partici-pate to the triggering of the Khuli-Boniabad and Zirkuh earthquakes (Fig. 5d,h,j).
5.3 Coseismic versus postseismic stress transfers
Several studies have demonstrated the importance of postseismic viscoelastic relaxation in stress transfer calculations. For example, the Hector-Mine earthquake cannot be considered as triggered by the Landers earthquake without considering stress changes induced by the postseismic
ORIGINAL UNEDITED MANUSCRIPT
Figure 7. Sum of the coseismic and postseismic (due to viscoelastic relaxation) stress changes computed immediately before the occurrence of the Zirkuh earthquake (1997) and produced (a) by the Mw>7 earth-quakes only and (b) by the Mw>5.9 earthearth-quakes. At the left bottom of each plot, the value is the total Coulomb stress changes at the epicentre of the Zirkuh earthquake. The stress changes are computed at a depth of 10 km and the viscosity is 1 × 10²⁰Pa.s.
coelastic relaxation (Freed & Lin 2001). Pollitz et al. (2003) show that the sequence of 5 Mw>7 earthquakes in Mongolia can only be explained by postseismic viscoelastic stress transfers be-cause the distances between earthquakes are far too great (∼ 400 km) to allow fault interactions by static stress transfers. Freed et al. (2007) show that only 56% of the 1812-2007 Southern Califor-nia Mw>6 hypocentres are brought closer to failure by previous coseismic stress changes whereas 70% are brought closer to failure when postseismic stress changes are also considered. In our case, due to the relatively strong viscosity of the lithosphere, the elapsed times between the main earth-quakes of the NE Lut sequence are too short for the viscoelastic process to significantly reinforce the coseismic stress changes. Thus, the contribution of the postseismic viscoelastic relaxation is negligible in the case of the NE Lut earthquake sequence.
5.4 Stress changes versus rupture extension and slip amplitude of the next earthquake
Some authors found a spatial correlation between the Coulomb stress changes induced by previous earthquakes and the rupture extension and slip amplitude of the next rupture. For example, Caskey & Wesnousky (1997) found that the 1954 Ms 6.8 Dixie Valley earthquakes rupture ends where Coulomb stress changes induced by the previous 1954 Ms 7.2 Fairview Peak earthquake become
ORIGINAL UNEDITED MANUSCRIPT
negative. Stein et al. (1992) and Pino et al. (2019) found a similar correlation for the Landers and Big-Bear earthquakes, and between the Norcia earthquake and the preceding earthquakes of the Central Italy 2016-2017 Mw 5.0-6.5 seismic sequence respectively. Furthermore, Caskey & Wesnousky (1997) found also a correlation between sections of the fault showing the largest positive Coulomb stress changes with those showing the largest surface offsets.
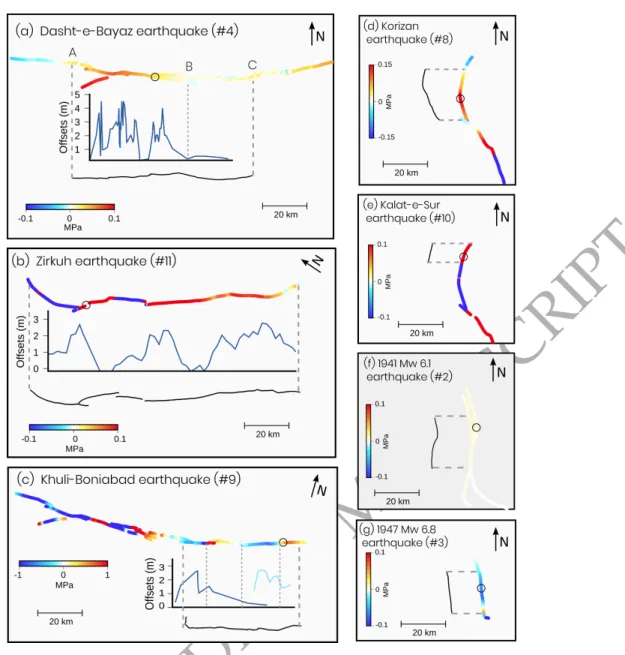
To evaluate if such a correlation exists for the NE Lut sequence earthquakes, we compare the total Coulomb stress changes immediately before the NE Lut earthquakes with their rupture traces and, if available, with their surface fault offsets (Fig. 8). Note that there is a fault slip model for only one earthquake of the sequence, it is the reason why we do not compare with the slip at depth. As we make the comparison with the surface offsets, we also compute the Coulomb stress changes at the surface. We do this comparison for all earthquakes except three for which the surface rupture is not known (#5 - #7). There is no correlation between the rupture extension or the surface offsets with the Coulomb stress changes for three earthquakes: the 1941 Mw 6.1 (#2), 1947 Mw 6.8 (#3) and 1979 Mw 7.1 Khuli-Boniabad (#9) earthquakes. For the two first earthquakes, the Coulomb stress changes are null or negative all along their surface rupture (Fig. 8f,g). For the Khuli-Boniabad earthquake, one third of the rupture zone lies in a zone of negative stress changes and the zones of maximum slip are correlated with the zones of negative Coulomb stress changes (Fig. 8c).
A correlation seems to exist between the rupture extension and the total Coulomb stress changes induced by previous earthquakes for four earthquakes (Fig. 8a,b,d,e). For the Kalat-e-Shur (#10) and Korizan (#8) earthquakes, the rupture tips are located either where the Coulomb stress changes become negative or at the end of the Abiz fault (Fig. 8d,e). For the Dasht-e-Bayaz earthquake (#4), the western termination of the rupture correlates with a section of the fault where Coulomb stress changes become negative. At the eastern termination, the rupture ends in a zone where Coulomb stress changes are positive but lower than in the centre part of the rupture (Fig. 8a). In that case, zones of maximum slip correlate also with zones of maximum Coulomb stress changes (between point A and B, Fig. 8a) whereas the zone of minimum surface slip correlates with the zone of lower Coulomb stress changes (between B and C, Fig. 8a). For the Zirkuh
ORIGINAL UNEDITED MANUSCRIPT
quake (#11), the northward propagation of the rupture seems to have been impeded by the strong negative stress changes induced by the Korizan (#8) and Kalat-e-Shur (#10) earthquakes (Fig. 8b). Indeed, on this part of the fault, the Zirkuh earthquake produced small displacements and the rup-ture stopped before the northern termination of the fault. On the other parts of the fault, there is no correlation between the slip amplitude and the Coulomb stress changes. Furthermore, Marchan-don et al. (2018a,b) suggest that the rupture propagation during the Zirkuh earthquake was mainly controlled by the geometric complexities of the Abiz fault, the zones of low slip corresponding to the zones of geometric complexities of the fault.
On the seven earthquakes analysed, four show a correlation between rupture extension and total Coulomb stress changes induced by previous earthquakes. We recognize that computing the stress changes since 1936 only limits us from robustly evaluating this correlation. Unfortunately, as the prior earthquake history of the faults in NE Lut is poorly known, we cannot compute the stress changes on the Dasht-e-Bayaz and Abiz faults from events that occurred before 1936.
5.5 Implication for seismic hazard
Some faults of the NE Lut fault system do not seem to have broken recently (Berberian & Yeats 1999). For example, the Avaz-Gazik and the south part of the Nauzad faults have not broken for at least 800 years (Berberian & Yeats (1999), Fig. 9). To evaluate the impact of the NE Lut sequence on these unbroken faults and to know which ones are the most prone to break in the future, we evaluate the Coulomb stress changes in 2020 produced by the NE Lut earthquake sequence (Fig. 9).
Fig. 9a shows the cumulative coseismic and postseismic stress changes induced in 2020 by the NE Lut earthquakes. The NE Lut sequence unloaded almost the entire northern Avaz-Gazik fault and the southern Nauzad fault whereas it loaded the southern Avaz-Gazik fault (∼ 0.08 MPa) and the northern Nauzad fault (∼0.09 MPa). These stress changes have mainly been induced by the Zirkuh earthquake due to its proximity to these faults. Adding the interseismic stress changes during the 1936-2020 period increases the positive stress changes on the southern Avaz-Gazik fault (∼0.15 MPa) and on the southern Nauzad fault (∼0.04 MPa, Fig. 9b).
ORIGINAL UNEDITED MANUSCRIPT
Figure 8. Comparison of the total Coulomb stress changes with the rupture extension and, when available, the surface fault offsets for seven earthquakes of the NE Lut sequence. On each panel of the figure are plotted the total Coulomb stress changes at the surface, just before the occurrence of the considered earth-quake (blue-white-red coloured line), if available the surface fault offsets for the considered earthearth-quake (blue line) and, the surface rupture trace of the considered earthquake (black line). For the Dasht-e-Bayaz earthquake, the surface rupture trace mapping and the surface offsets are from Ambraseys & Tchalenko (1969), Tchalenko & Ambraseys (1970) and Tchalenko & Berberian (1975). For the Korizan and the Kalat-e-Shur earthquake, the surface rupture trace mapping is from Nowroozi & Mohajer-Ashjai (1980). For the Khuli-Boniabad earthquake, the surface rupture trace mapping is from Marchandon et al. (2018a) and the surface fault offsets are from Nowroozi & Mohajer-Ashjai (1980) (dark blue line) and from Marchandon et al. (2018a) (light blue line). Finally, for the Zirkuh earthquake, the surface rupture trace mapping is from Berberian et al. (1999) and Marchandon et al. (2018a) and the surface offsets are from Marchandon et al. (2018a).
ORIGINAL UNEDITED MANUSCRIPT
The northern segment of the Nauzad fault last broke during a M∼7 earthquake in 1493 (Berbe-rian & Yeats 1999). Based on the historical records, the Avaz-Gazik fault has not broken since the 13th century at least. To evaluate the impact of the Nauzad earthquake on the Avaz-Gazik fault, we add to the stress changes of Fig. 9b, the stress changes due to the rupture of the northern Nauzad fault (Fig. 9c). The result shows that the Nauzad earthquake brought even closer to failure the southern Avaz-Gazik fault (∼0.2 MPa) but also the southern segment of the Nauzad fault with positive stress changes of ∼0.3 MPa. Having not broken for 800 years, these faults present a high potential to break in the future.
Finally, almost the entire Dasht-e-Bayaz fault broke during the Dasht-e-Bayaz and Khuli-Boniabad earthquakes except the westernmost 20 km of this fault that apparently did not break recently. This small segment exhibits a large Coulomb stress change of (∼0.35 MPa (Fig. 9). Theoretically, the rupture of this segment could generate a M∼6.6 earthquake (Leonard 2014) with potentially extensive damages in the surrounding villages (e.g. Ferdows, Dasht-e-Bayaz, Go-nabad).
6 CONCLUSION
In this paper, we model the Coulomb stress changes during an earthquake sequence that occurred in a more complex fault system than usually studied: the 1936-1997 NE Lut earthquake sequence that occurred on the conjugate NE Lut fault system. We show that 6 out of 10 earthquakes are clearly favoured by stress transfers produced by the previous earthquakes and another one could have been favoured depending on its nucleation depth. Because the faults are close to each other and earthquakes occurred in a short period of time, the process that mainly contributes to the cumulative stress changes is the coseismic deformation, the stress changes due to the viscoelastic relaxation and interseismic deformation being significantly lower. Among the parameters involved in the Coulomb stress change modelling, we show that the geometry, in particular the strike, of the source and receiver faults is the most important to accurately estimate the Coulomb stress changes. Moreover, we show that moderate earthquakes have played a crucial role in the occurrence of the NE Lut sequence as two of the three large earthquakes (Mw>7) have been mainly favoured by
ORIGINAL UNEDITED MANUSCRIPT
Figure 9. Coulomb stress changes on the NE Lut faults in 2020. (a) Coseismic and postseismic (due to viscoelastic relaxation) Coulomb stress changes produced by the earthquakes of the NE Lut sequence. (b) Coseismic and postseismic (due to viscoelastic relaxation) Coulomb stress changes induced by the earthquakes of the NE Lut sequence and by the interseismic loading since 1936. (c) As (b) but with the coseismic and postseismic Coulomb stress changes induced by the 1493 M ∼7 historical earthquake that broke the northern segment of Nauzad fault. The 1493 earthquake is parametrized following Leonard (2014) and using an homogeneous slip. The stress changes are computed at 10 km depth and the viscosity is 1×10²⁰ Pa.s. N. and A.G. stand for Nauzad and Avaz-Gazik faults respectively.
ORIGINAL UNEDITED MANUSCRIPT
moderate ones (Mw5.9-6.6). For some earthquakes, a link between the Coulomb stress changes due to previous earthquakes and the rupture extension of the next earthquake seems to exist but a more complete knowledge of the stress history would be needed to confirm this correlation. Finally, for most of the NE Lut sequence earthquakes, the Coulomb stress changes produced by the previous earthquake are low (<0.4 MPa), and correspond to only a small fraction of the stress drop usually estimated for earthquakes (3-10 MPa). This suggests that the faults that broke during the NE Lut sequence were already close to failure; which could suggest that the seismic cycles of the NE Lut faults are synchronized.
ACKNOWLEDGMENTS
The study was supported by the Agence Nationale de la Recherche (ANR, French National Re-search Agency) through the ”E-POST” project under the contract No. ANR-14-CE03-0002-01. Several figures were created with the Generic Mapping Tools (GMT) software (Wessel et al. 2013). We are grateful to L. Wedmore, an anonymous reviewer and Editor M. Segou for their constructive and thorough comments that greatly helped us to improve our manuscript.
REFERENCES
Aki, K. & Richards, P., 1980. Quantitive seismology: Theory and methods. la. ed, San Francisco (EEUU): Freeman and Company, 1, 557.
Ali, S. T., Freed, A. M., Calais, E., Manaker, D. M., & Mccann, W. R., 2008. Coulomb stress evolu-tion in Northeastern Caribbean over the past 250 years due to coseismic, postseismic and interseismic deformation, Geophysical Journal International, 174, 904–918.
Allmann, B. P. & Shearer, P. M., 2009. Global variations of stress drop for moderate to large earthquakes, Journal of Geophysical Research, 114(B01310), 1–22.
Ambraseys, N. N., 1970. Some characteristic features of the Anatolian fault zone, Tectonophysics, 9, 143–165.
Ambraseys, N. N. & Jackson, J. A., 1998. Faulting associated with historical and recent earthquakes in the Eastern Mediterranean region, Geophysical Journal International, 133, 390–406.
Ambraseys, N. N. & Melville, C., 1977. The Seismicity of Kuhistan, Iran, The Geographical Journal, 143(2), 179–199.
ORIGINAL UNEDITED MANUSCRIPT
Ambraseys, N. N. & Melville, C., 1982. A History of Persian Earthquakes, Cambridge University Press, New-York.
Ambraseys, N. N. & Tchalenko, J. S., 1969. The dasht-e Bayaz (Iran) earthquake of August 31, 1968: a field report, Bulletin of Seismological Society of America, 59(5), 1751–1792.
Arnadottir, T., Jonsson, S., Pedersen, R., & Gudmundsson, G. B., 2003. Coulomb stress changes in the South Iceland Seismic Zone due to two large earthquakes in June 2000, Geophysical Research Letters, 30(5).
Benedetti, L., Manighetti, I., Gaudemer, Y., Finkel, R., Malavieille, J., Pou, K., Arnold, M., Aumaˆıtre, G., Bourl`es, D., & Keddadouche, K., 2013. Earthquake synchrony and clustering on Fucino faults (Central Italy) as revealed from in situ 36 Cl exposure dating, Journal of Geophysical Research: Solid Earth, 118, 4948–4974.
Berberian, M. & Yeats, R. S., 1999. Patterns of Historical Earthquake Rupture in the Iranian Plateau, Bulletin of Seismological Society of America, 89, 120–139.
Berberian, M., Jackson, J. A., Qorashi, M., Khatib, M. M., Priestley, K., & Talebian, M., 1999. The 1997 May 10 Zirkuh (Qa’enat ) earthquake (Mw 7.2): faulting along the Sistan suture zone of eastern Iran, Geophysical Journal International.
Bie, L. & Ryder, I., 2014. Recent seismic and aseismic activity in the Ashikule stepover zone, NWTibet, Geophysical Journal International, 198, 1632–1643.
Caskey, S. J. & Wesnousky, S. G., 1997. Static Stress Changes and Earthquake Triggering during the 1954 Fairview Peak and Dixie Valley Earthquakes, Central Nevada, Bulletin of Seismological Society of America, 87(3), 521–527.
Ch´ery, J., Merke, S., & Bouissou, S., 2001. A Physical Basis for Time Clustering of Large Earthquakes, Bulletin of Seismological Society of America, 91(6), 1685–1693.
Cocco, M., Nostro, C., & Ekstr¨om, G., 2000. Static stress changes and fault interaction during the 1997 Umbria-Marche earthquake sequence, Journal of Seismology, 4(4), 501–516.
Crampin, S., 1969. Aftershocks of the Dasht-e Bayaz, iran, earthquake of august, 1968, Bulletin of Seis-mological Society of America, 59(5), 1823–1841.
Diao, F., Walter, T. R., Motagh, M., Prats-iraola, P., Wang, R., & Samsonov, S. V., 2015. The 2015 Gorkha earthquake investigated from radar satellites : slip and stress modeling along the MHT, Frontiers in Earth Science, 3, 1–9.
Engdahl, E. R., Jackson, J. A., Myers, S. C., Bergman, E. A., & Priestley, K., 2006. Relocation and assessment of seismicity in the Iran region, Geophysical Journal International, pp. 761–778.
Entezar-Saadat, V., Motavalli-Anbaran, S. H., & Zeyen, H., 2017. Lithospheric structure of the Eastern Iranian plateau from integrated geophysical modeling: A transect from Makran to the Turan platform, Journal of Asian Earth Sciences, 138, pp. 357–366.