ASSESSING LOW-FARE ENTRY IN AIRLINE MARKETS: IMPACTS OF
REVENUE MANAGEMENT AND NETWORK FLOWS
by Thomas 0. Gorin
S.M., Transportation, Massachusetts Institute of Technology, 2000 Ing6nieur des Arts et Manufactures, Ecole Centrale Paris, 1999
Submitted to the department of Aeronautics and Astronautics and Center for Transportation and Logistics in partial fulfillment of the requirements for the degree of
DOCTOR OF PHILOSOPHY IN TRANSPORTATION
AT~iNSfrYu AT THE
MASSACHUSETTS INSTITUTE OF TECHNOLOGY
FEB
1
0SEPTEMBER
2004© 2004 Massachusetts Institute of Technology All rights reserved
LIBRARIES
Signature of Author:
Departfmeniit of Aeronautics and Astronautics Center for Transportation and Logistics September 2, 2004
Certified by:
Dr. Peter P. Belobaba Principal Research Scientist Department Aeronautics and Astronautics Thesis
Supervisor
Certified by: I
Dr. John-Paul B. Clarke Assoc te Professor of Aeronautic, Astronautics
Certified by:
Dr. Amedeo R. Odoni Professor of Aeronautics and Astronautics and Civil and Environmental Engineering
Certified by:
I. Nancy L. Rose Professor of Economics
Accepted by:
Dr. Nigel H. M. Wilson Professor of Civil and Environmental Engineering Chair, Transportation Education Congmittee
Accepted by:
D .laime -Ngaire Professor of Aernanitics and Astronautics
Chair, Committee on Graduate Students
It
-2-ASSESSING LOW-FARE ENTRY IN AIRLINE MARKETS: IMPACTS OF
REVENUE MANAGEMENT AND NETWORK FLOWS
by
Thomas 0. Gorin
Submitted to the Department of Aeronautics and Astronautics and Center for Transportation and Logistics on September 2, 2004 in Partial Fulfillment of the Requirement for the Degree of
Doctor of Philosophy in Transportation
ABSTRACT
The recent growth of low-fare, low-cost carriers has changed the competitive airline environment. In the US alone, low-fare carrier market shares have increased from just over 5% in 1990 to almost 25% in 2003. Traditional network carriers have consequently had to adjust to the changing competitive environment, which has led to cost reductions, fare structure simplifications and service adjustments. In addition, competitive responses of incumbent network carriers to low-fare entry have prompted concern regarding the potential for predatory practices in the airline industry.
Assessment of unfair competitive practices in airline markets has typically been based on the analysis of changes in aggregate measures, such as average fares, traffic and revenues. In this research, the effect of low-fare entry on incumbent network carriers is examined, with special focus on the impacts of entry on traditional measures of airline performance. An analysis of various markets with low-fare competition highlights the typical effects of low-fare entry on these traditional aggregate measures. In a thorough analysis of two specific cases, we show that these measures, although affected similarly by entry, were very poor predictors of the new entrant's success in these markets, and inadequate indicators of incumbent response. AirTran successfully entered the Atlanta-Orlando market, while Spirit failed to maintain its operations in the Detroit-Boston market. We highlight the differences between these two markets and explain why the performance of these two carriers was so different.
In a second part, a simulator of competitive airline networks - the Passenger Origin Destination Simulator
- is used to model various scenarios of entry in a single market environment so as to determine the essential factors affecting traditional measures of airline performance following low-fare entry. Our simulation results show that these measures are greatly affected by the entrant's capacity relative to the
-3-incumbent, by the incumbent carrier's competitive pricing response, and by the competitive revenue management situation. For example, average fares on the incumbent carrier can either increase or decrease following entry by a new competitor, depending on whether one or both airlines perform revenue management. In an extension of the simulations to a larger network environment, it is also shown that network flows of passengers affect the performance of all competitors, as measured by aggregate measures of performance. Furthermore, use of advanced network revenue management allows the incumbent carriers to rely on connecting passengers to mitigate the effect of entry on network revenues, but leads to amplified effects at the local market level.
Consequently, this research establishes that traditional aggregate measures of airline performance on their own do not constitute a reliable indication of the response of incumbent carriers, and provide even less information on their strategic intent, which is critical in identifying predation. This research also demonstrates the relationships between aggregate measures of performance and previously overlooked factors including relative entrant capacity, competitive pricing and revenue management, and flows of network passengers.
Thesis Committee:
Dr. Peter P. Belobaba, Principal Research Scientist
Department of Aeronautics and Astronautics, Committee Chairman
Dr. John-Paul B. Clarke, Associate Professor of Aeronautics and Astronautics
Dr. Amedeo R. Odoni, Professor of Aeronautics and Astronautics and Civil and Environmental Engineering
Dr. Nancy L. Rose, Professor of Economics
-4-ACKNOWLEDGMENTS
First and foremost, my thanks and gratitude go to my thesis supervisor Peter Belobaba, whose help, patience and support were instrumental in the successful completion of this thesis. Furthermore, Peter's unwavering confidence in the quality of my research helped me stay focused and move forward even in times of doubt.
My committee members also provided considerable advice and I am extremely fortunate to have been so well guided in my research. Professor John-Paul Clarke's wealth of ideas constantly challenged my research results and enabled me to maintain a broad and open-minded view of the problem. Professor Amedeo Odoni helped me evaluate and understand the global implications of the research and the importance of a clear synthesis of the findings. Professor Nancy Rose contributed to the economic side of this research and helped me understand the difficult economic concepts and their application to the airline industry. In addition, she provided tremendous support in the writing of this dissertation, and allowed me to effectively report the findings of the research to the economic world.
I would also like to thank the PODS Consortium members (Continental Airlines, Delta Air Lines, KLM, Lufthansa, Northwest Airlines, SAS, Swissair) for their interest in my research and their comments and suggestions regarding the realistic representation of low-fare airline competition within the Passenger Origin Destination Simulator. In particular, I am indebted to Craig Hopperstad for the development of the PODS simulator, without which none of this research would have been possible. In addition, Craig's dedication to the project, and constant availability to discuss any and all questions were infinitely helpful.
A doctoral research project which takes close to four years to complete requires a significant amount of financial support. I am lucky to acknowledge funding from a number of sources. I would like to thank the Sloan Foundation for its financial support of my research through the Global Airline Industry program. Additional research funding was provided by the PODS research project and its airline participants.
Finally, I would like to extend personal thanks to: Professor Nigel Wilson for enduring my complaining about the rigors of doctoral research, and generously letting me win a few games of squash; Anne Dunning for her continued encouragements and belief in my success; my friends and colleagues at ICAT and in the PODS research team, and in particular Emmanuel Carrier, Andrew Cusano, Alex Lee; my family for convincing me to pursue the Ph.D. and believing in my success; and, last but not least, Florence Carrier for her support and forgiveness throughout the four years of my research.
I dedicate this thesis to my parents, whom I am proud to join as a doctor.
-6-TABLE OF CONTENTS
Table of Contents...7 List of Figures...9 List of Tables...15 CHAPTER 1 Introduction ... 191.1. Overview of Changes in the A irline Industry since D eregulation ... 19
1.2. Research Objectives...21
1.3. Structure of the Thesis ... 22
CHAPTER 2 Context and M otivation of the Research... 25
2.1. Low -Fare N ew Entrants: A Definition ... 26
2.2. The Airline Industry after Deregulation: The Birth of Low-Fare Carriers ... 28
2.3. The Low -Fare Carrier Business M odel... 36
2.4. Predatory Behavior: Concerns Expressed by Governmental Agencies and New Entrant Carriers...46
2.5. Conclusion ... 48
CHAPTER 3 Literature Review ... 51
3.1. Econom ic Basis for Predation... 51
3.2. H istory of Research on Testing for Predatory Pricing ... 52
3.3. Entry and Predation in the A irline Industry... 55
3.4. Revenue M anagem ent...58
3.5. Im plications for this Research ... 61
-7-CHAPTER 4
Case Studies ... 63
4.1. A Survey of the Effects of Low-Fare Entry on Total Market and Individual Carrier Traffic, Revenues and Fares...64
4.2. Two Case Studies: Atlanta-Orlando and Detroit-Boston... 75
4.3. Discussion and Conclusions ... 90
CHAPTER 5 Simulation of Entry in a Competitive Environment: The Single Market Case ... 95
5.1. The Passenger Origin Destination Simulator (PODS)... 96
5.2. Single M arket Case...104
CHAPTER 6 Effect of Revenue Management on Traditional Measures of Airline Performance in the Single Market Case ... 157
6.1. Effects of Revenue M anagement on Incumbent Performance...157
6.2. Summary and Comparison of Scenarios 0 through 3: Impacts of Revenues Management and Cross-Scenario Comparisons ... 194
6.3. Sensitivity Analysis ... 209
6.4. Conclusions: Lessons Learned from the Single M arket Case...216
CHAPTER 7 Extension of Results to a Large Network Environment: Entry in Ten M arkets...219
7.1. Approach...219
7.2. Results...226
7.3. Conclusions...245
CHAPTER 8 Conclusions ... 249
8.1. Research Findings and Contributions ... 249
8.2. Application to Studies of Competition in Airline M arkets ... 253
8.3. Future Research Directions...259
References ... 263
-8-LIST OF FIGURES
CHAPTER 2
Figure 2.1: Annual entering, exiting and total carriers in the U.S. airline industry post-deregulation (Source: Civil Aeronautics Board & Bureau of Transportation Statistics - Certified
R oute A ir C arrier)...30
Figure 2.2: Cumulative number of entrants and exits since 1979 (Source: Bureau of Transportation Statistics, Office of Airline Inform ation)... 31
Figure 2.3: Airline operating profits in 2000 and 2001 (Source: Form 41 database)...45
CHAPTER 4 Figure 4.1: Figure 4.2: Figure 4.3: Figure 4.4: Figure 4.5: Figure 4.6: Figure 4.7: CHAPTER 5 Figure 5.1: Figure 5.2: Figure 5.3: Figure 5.4: Figure 5.5: Figure 5.6: Figure 5.7: Figure 5.8: Figure 5.9: Figure 5.10: Figure 5.11: Figure 5.12: Total local traffic (nonstop) before and after ValuJet entry... 76
Change in local traffic and average market fares pre- and post-entry ... 77
ValuJet traffic and average fares (Source: OD Plus database) ... 81
Total traffic and average fares ... 83
Northwest traffic and average fares by quarter in 1995 and 1996... 84
Spirit traffic and average fare by quarter, in 1996...86
Fare distribution before and after entry in both markets (ATL-MCO and DTW-BOS) -Source: D B 1A database ... 90
PODS architecture (Source: Hopperstad and The Boeing Company)...98
The passenger choice m odel in PODS... 99
Sample business and leisure demand curves in PODS ... 101
Single market (hub HI to spoke S) with two competing carriers ... 108
Incumbent carrier revenues in the case of no new entrant competition...110
Airline 1 and 2 revenues by fare class, Scenario 0 ... 111
Total market revenues for Scenario 1 as a function of new entrant capacity ... 114
Airline 1 revenues as a function of new entrant capacity ... 116
Average fare by airline as a function of entrant capacity - Scenario 1...118
Airline 1 revenues under Scenario 1 and Scenario 2LM . ...--122
Average fare by airline as a function of entrant capacity - Scenario 2LM...---...125
Airline 1 revenues by fare class pre- and post-entry -Scenario 3LM-.---...134
-9-Figure 5.13: Figure 5.14: Figure 5.15: Figure 5.16: Figure 5.17: Figure 5.18: Figure 5.19: Figure 5.20: Figure 5.21: Figure 5.22: Figure 5.23: Figure 5.24: Figure 5.25:
Average fares by airline - Scenario 3LM---...137
Airline 1 revenues by fare class - Scenario 3 FM ---... 140
Scenario 3FM average fare by airline as a function of new entrant capacity ... 141
Total market revenues as a function of the scenario of entry ... 144
Average market fare as a function of new entrant capacity and scenario...145
Total market loads as a function of entrant capacity and scenario ... 146
Airline 1 revenues as a function of entrant capacity and scenario settings...147
Airline 1 average fare as a function of entrant capacity and scenario ... 148
Airline 1 average load factor as a function of entrant capacity and scenario ... 149
M arket and revenue share for Airline 1 ... 150
Airlines 1 and 3 revenues as a function of entrant capacity and scenario...151
Airlines 1 and 3 average fares as a function of entrant capacity and scenario...153
Airlines 1 and 3 revenue share as a function of new entrant capacity and scenario ... 155
CHAPTER 6 Figure 6.1: Incumbent carrier revenues in the case of no new entrant competition...160
Figure 6.2: Airline 1 revenues by fare class under each revenue management environment ... 161
Figure 6.3: Airline 1 traffic by fare class and scenario ... 162
Figure 6.4: Total market revenues as a function of the revenue management settings and new entrant capacity - Scenario 1 (Scenarios with FCRM on the incumbents only and FC RM on all carriers overlap)...164
Figure 6.5: Average market fare as a function of the revenue management settings and new entrant capacity - Scenario 1 ... 165
Figure 6.6: Airline 1 revenues and traffic as a function of incumbent and new entrant revenue m anagem ent -Scenario 130 ... 166
Figure 6.7: Average fare on Airline 1 as a function of scenario settings and new entrant capacity -S cen ario 1 ... 16 8 Figure 6.8: Relative revenue changes on Airline 3 as a function of capacity and ccenario settings -S cen ario 1 ... 16 9 Figure 6.9: Total market revenues as a function of revenue management settings - Scenario 2LM .--- 173
Figure 6.10: Airline 1 revenues as a function of scenario settings and new entrant capacity -Scenario 2LM .--- ---.-.---.--.--.-.-.. -.... -...--... ... 174
Figure 6.11: Airline 1 Loads by Fare Class and Scenario -Scenario 2LM---...175
Figure 6.12: Total market revenues as a function of the revenue management setting and new entrant capacity -Scenario 3LM ....---..---...----... 178
Figure 6.13: Airline 1 revenues as a function of new entrant capacity and revenue management settings -Scenario 3LM ...--- . ... . . --...-... 180
Figure 6.14: Airline 1 loads by fare class -Scenario 3LM---.---... 181
-10-Figure 6.15: Figure 6.16: Figure 6.17: Figure 6.18: Figure 6.19: Figure 6.20: Figure 6.21: Figure 6.22: Figure 6.23: Figure 6.24: Figure 6.25: Figure 6.26: Figure 6.27: Figure 6.28: Figure 6.29: Figure 6.30: Figure 6.31: Figure 6.32: Figure 6.33: Figure 6.34:
New entrant (Airline 3) loads by fare class - Scenario 3LM ---... 182
New entrant revenues as a function of revenue management and capacity settings
-Scenario 3LM (FCFS All and (FCRM; FCRM; FCFS) overlap) ... 183
Traffic on airlines 1 and 3 as a function of new entrant capacity and revenue
management settings -Scenario 3LM (FCFS All and (FCRM; FCRM; FCFS) overlap on
the new entrant carrier)...184 Average fare on airlines 1 and 3 as a function of new entrant capacity and revenue management settings -Scenario 3LM (FCFS All and (FCRM; FCRM; FCFS) almost
overlap on the new entrant carrier)...185 Total market revenues as a function of revenue management settings and new entrant capacity - Scenario 3
FM ---... 187
Total market traffic as a function of new entrant capacity and revenue management
settings -Scenario 3FM ---.--- ---... 189 Average market fare as a function of new entrant capacity and revenue management
settings -Scenario 3
FM ---... 190
Airline 1 revenues as a function of new entrant capacity and competitive revenue management settings - Scenario 3
FM---...
191
Airline 1 traffic and average fare as a function of revenue management and new entrant cap acity ... 192 New entrant revenues as a function of new entrant capacity and competitive revenue m anagem ent settings...192 New entrant traffic and average fare as a function of new entrant capacity and
competitive revenue m anagem ent settings ... 193 Incumbent and new entrant average fares as a function of new entrant capacity and
competitive revenue management situation - Scenario 3
FM ---... 194
Total market revenues by scenario as a function of the competitive revenue
management situation and new entrant capacity (a: FCFS on all carriers; b: FCRM on incumbents, FCFS on entrant; c: FCRM on all carriers) ... 196 Average market fare by scenario as a function of the competitive revenue management situation and new entrant capacity...198 Airline 1 revenues by scenario as a function of the competitive revenue management situation and new entrant capacity...200 Airline 1 average fares by scenario as a function of the competitive revenue
management situation and new entrant capacity...202 Airline 3 revenues by scenario as a function of the competitive revenue management situation and new entrant capacity...204 Airline 3 average fares by scenario as a function of the competitive revenue
management situation and new entrant capacity...205 Relative average fares by scenario as a function of the competitive revenue
management situation and new entrant capacity (a: FCFS on all carriers; b: FCRM on incumbents, FCFS on entrant; c: FCRM on all carriers) ... 207 Sensitivity test on connecting time on Airline 2...210
-Figure 6.35: Sample of sensitivity of results to changes in Airline 2 travel time, FCRM on all
carriers ... 2 1 1 Figure 6.36: Change in business/leisure mix of traffic...212 Figure 6.37: Effect of leisure mix on Airline 1 average fares ... 213 Figure 6.38: Effect of leisure mix on Airline 3 average fares (FCFS all and (FCRM; FCRM; FCFS)
overlap in both cases) ... 2 13 Figure 6.39: Simulated change in leisure demand curve...215 Figure 6.40: Effect of change in leisure demand curve on average fares in Scenario 3LM (a: FCFS on
all carriers; b: FCRM on incumbents, FCFS on entrant; c: FCRM on all carriers)...216
CHAPTER 7
Figure 7.1: Sim ulated incum bent netw orks...221 Figure 7.2: N ew entrant carrier netw ork ... 222 Figure 7.3: Willingness to pay curves in PODS for a sample market ... 223 Figure 7.4: Airline 1 and Airline 2 revenues as a function of the competitive revenue management
situation (w /o entrant com petition)...228 Figure 7.5: Incumbent carrier revenues as a function of new entrant capacity and competitive
revenue m anagem ent situation...229 Figure 7.6: Incumbent revenue losses as a function of the competitive revenue management
situation and new entrant capacity, relative to the same revenue management methods on the incumbents, without low-fare competition ... 230 Figure 7.7: Airline 1 revenues and relative gains from Network RM as a function of new entrant
capacity (per local m arket) ... 231 Figure 7.8: New entrant revenues as a function of its capacity and the competitive revenue
m anagem ent situation ... 232 Figure 7.9: Incumbent average local market fare (averaged over 10 markets with entry)...235 Figure 7.10: Airline 1 traffic by fare class (pre-entry and post-entry as a function of competitive
revenue m anagem ent settings)...236 Figure 7.11: Airline 1 revenues and average fares in 10 markets with entry ... 237 Figure 7.12: Average loads and mix on airline l's legs affected by low-fare entry ... 238 Figure 7.13: Incumbent and new entrant market share in the ten markets with low-fare entry,
pre-and post-entry, as a function of the competitive revenue management situation ... 239 Figure 7.14: New entrant relative revenue variation as a function of its capacity and the competitive
revenue management situation (compared to FCRM on all carriers, with 30, 50 or 70 seats per flight on the new entrant carrier)...241 Figure 7.15: New entrant average fare as a function of its capacity and the competitive revenue
m anagem ent situation ... 242 Figure 7.16: Airline 1 and 3 revenues in the ten markets with low-fare entry - FCRM on all carriers.. 243 Figure 7.17: Average market fare on airlines 1 and 3 as a function of new entrant capacity ... 244
-Figure 7.18:
CHAPTER 8 Figure 8.1:
Effect of Airline 2's revenue management system on new entrant revenues, given
A irline 1 uses N etw ork RM ... 247
Average market fares on the incumbent and new entrant carrier, under Scenario 2 LM
w ith FC R M on all carriers ... 255 Figure 8.2: Incumbent carrier average fare as a function of the incumbent pricing response
-Scenario 2 w ith FCRM on all carriers ... 256 Figure 8.3: Incumbent carrier traffic and revenues as a function of its pricing response - Scenario 2
w ith FC R M on all carriers ... 257 Figure 8.4: Difference between local market revenue losses and total network revenue losses on the
incumbent carrier under low-fare entry in a network environmnet (as simulated in
C h ap ter 7) ... 257 Figure 8.5: Incumbent and new entrant revenues under Scenario 2LM with FCRM on all carriers...258
-LIST OF TABLES
CHAPTER 2
Table 2.1: Civil Aeronautics Board & Bureau of Transportation Statistics - Certified Route Air C arrier ... 2 9 Table 2.2: New entrant carriers 1979-1985 (Source: Bureau of Transportation Statistics,
Employees Certificated Carriers Database, Office of Airline Information)...32 Table 2.3: New entrant carriers 1986-1993 (Source: Bureau of Transportation Statistics,
Employees Certificated Carriers Database, Office of Airline Information)...33 Table 2.4: New entrant carriers 1994-2000 (Source: Bureau of Transportation Statistics,
Employees Certificated Carriers Database, Office of Airline Information)...34 Table 2.5: US airlines RPMs and passenger enplanements in Q4, 2001 (Source: Form 41 database).36 Table 2.6: Average daily aircraft utilization (Source: USDOT, T100 database - Form 41)...41 Table 2.7: Boeing 737 and Airbus A320 average daily utilization (Source: Form 41) ... 42
CHAPTER 3
Table 3.1: Areeda and Turner's ranking of various rules (1: Best - 5: Worst) ... 54
CHAPTER 4
Table 4.1: Markets for case studies (Source: OD Plus database, Perry (1994), and Oster and Strong (2 0 0 1)) ... 64 Table 4.2: Airlines names and associated IATA codes...65 Table 4.3: Pre- and post-entry annual local traffic and average one-way fares (Source: OD Plus
database & Perry (1995))... 67 Table 4.4: Total local and incumbent market traffic pre- and post-entry (Source: OD Plus database
& P erry 1995))...69 Table 4.5: Share of stimulated traffic between incumbent and new entrant carriers (Source: OD
Plus database & Perry 1995)... 70 Table 4.6: One-way average fares for total market, incumbent and new entrant (Source: OD Plus,
Perry, O fficial A irline G uide)... 71 Table 4.7: Pre- and post-entry aircraft departures (each way) (Source: OAG and ASQP databases,
an d P erry )...73 Table 4.8: Total local market and incumbent revenues pre- and post-entry (Source: OD Plus
d atab ase) ... 74 Table 4.9: Summary of pre-entry and post-entry effects on average fares, traffic, market share and
departures for D elta and TW A ... 79
-Table 4.10: Summary of pre-entry and post-entry effects on average fares, market share and traffic ... 79
Table 4.11: Local passenger loads per nonstop flight (does not include connecting traffic)...81
Table 4.12: Summary of pre-entry and post-exit effects... 85
Table 4.13: Local passenger loads per nonstop flight (days/quarter on NK: 76 and 70)...86
Table 4.14: Relative change in quarterly traffic, average fare, departures and revenues on the in cu m b en t ... 9 1 CHAPTER 5 Table 5.1: Average total cost of individual fare products by passenger type (accounting for restrictions disutility costs)...102
Table 5.2: Important variables in the competitive simulation...105
Table 5.3: Scenario 0 capacity, frequency, schedule and pricing overview ... 107
Table 5.4: Number of competitors in short haul markets with nonstop service (< 500 miles) -Source: US DOT DB1A database, fourth quarter 2000 and second quarter 2002...108
Table 5.5: Fare classes, associated fares and restrictions for the standard fare structure in S cen ario 0 ... 10 9 Table 5.6: Scenario 0 sum m ary...109
Table 5.7: Total loads and revenues by fare class, average load factor and average fare for the entire m arket - Scenario 0 ... 110
Table 5.8: Fare class mix, average load factor by airline, Scenario 0...111
Table 5.9: Market and revenue share in Scenario 0...112
Table 5.10: Scenario 1 summary... ... 113
Table 5.11: Total market average load factor and average fare as a function of new entrant capacity 115 Table 5.12: Airline 1 total loads, loads by fare class and average load factor as a function of entrant cap acity ... 1 17 Table 5.13: Revenues, loads, average load factor and average fare on Airline 3 as a function of cap acity ... 1 17 Table 5.14: Market and revenue share by airline -Scenario 1...118
Table 5.15: Scenario 1 - relative effect of entry on traditional measures of airline performance for A irline 1 com pared to Scenario 0 ... 119
Table 5.16: Scenario 1 sum m ary table...119
Table 5.17: Scenario 2 summary (including Limited Match and Full Match sub-scenarios)...121
Table 5.18: Scenario 2LM market loads and revenues by fare class, average market fare and load facto r ... 12 2 Table 5.19: Scenario 2LM revenues by airline ... 123
Table 5.20: Scenario 2LM - Airline 1 loads by fare class and relative load variation compared to S cenario 0 ... 124
Table 5.21: Market and revenue shares by airline -Scenario 2LM ---... 125
-Table 5.22: Scenario 2LM - effect of entry on traditional measures of airline performance (revenues,
traffic and average fares) for Airline 1 compared to Scenario 0...126
Table 5.23: Scenario 2LM sum m ary table ....--- ... 126
Table 5.24: Scenario 2FM market loads and revenues by fare class, average market fare and load facto r ... 12 7 Table 5.25: Scenario 2FM revenues by airline ... 128
Table 5.26: Loads by airline and fare class -Scenario 2 FM---...128
Table 5.27: Market and revenue share by airline -Scenario 2 FM .---... 129
Table 5.28: Scenario 2 FM - effect of entry on traditional measures of performance for Airline 1 com pared to Scenario 0...129
Table 5.29: Scenario 2 FM summary table ---....---...-- - - - 129
Table 5.30: Tw o-tier fare structure details...130
Table 5.31: Scenario 3 summary (including Limited Match and Full Match sub-scenarios)...131
Table 5.32: Scenario 3LM total market loads and revenues by fare class, average market fare and lo ad factor ... 132
Table 5.33: Revenues by airline as a function of new entrant capacity -Scenario 3LM ---... 133
Table 5.39: Table 5.40: Table 5.43: Table 5.44: CHAPTER 6 Table 6.1: Table 6.2: Table 6.3: Table 6.4: Airline 1 and 2 loads by fare class -Scenario 3LM ---... 135
Scenario 3 passenger preference and choice, by passenger type...136
New entrant loads by fare class as a function of new entrant capacity - Scenario 3LM .-- 136
Market and revenue share by airline - Scenario 3LM---... 137
Scenario 3LM - effect of entry on traditional measures of performance for Airline 1 com pared to Scenario 0...138
Scenario 3LM summary table---.---...138
Scenario 3FM market loads and revenues by fare class, average market fare and load facto r ... 13 9 Market and revenue share by airline -Scenario 3 FM ---... 141
Scenario 3 FM - effect of entry on traditional measures of performance for Airline 1 com pared to Scenario 0...142
Scenario 3FM summary table---...142
New entrant fares by fare class and scenario ... 143
Revenue management settings by scenario...158
Total traffic and revenues by fare class as a function of the revenue management env ironm ent ... 160
M arket and revenue share -Scenario 0...162
Total market traffic and average load factors -Scenario 1 ... 165
- 17 -Table Table Table Table Table 5.34: 5.35: 5.36: 5.37: 5.38: Table Table 5.41: 5.42:
Table 6.5: Table 6.6: Table 6.7: Table 6.8: Table 6.9: Table 6.10: Table 6.11: CHAPTER 7 Table 7.1: Table 7.2: Table 7.3: Table 7.4: Table 7.5: -
18-Airline 1 relative revenue and traffic variation...167
Airline 1 average load factor as a function of scenario settings and new entrant capacity - S cen ario 1 ... 16 8 New entrant traffic, load factors and average fares ... 169
Nonstop incumbent and new entrant revenues - Scenario 1 ... 171
Total market traffic and average market load factor -Scenario 2LM---... 174
Airline 1 revenues, average fare, traffic and average load factor - Scenario 2LM ...-- - 176
Total market revenues by case, and relative revenue increase as a function of revenue management -Scenario 3FM-.--- ---...
188
Sample incumbent market fares according to the standard fare structure ... 223
Percentage of Airline l's affected market, legs, traffic and RPMs upon low-fare entry.... 224
Sample fares and fare classes under the two-tier fare structure...225
Sum m ary of cases tested...226
Revenues, average load factors, revenues per available seat mile (RASM) and market share by airline pre- and post-entry ... 233
CHAPTER 1
INTRODUCTION
In 1978, the US airline industry was deregulated to increase competition among air carriers, and to open the industry to new entrant competition. In the mid-1980s, the European airline industry began its own deregulation. Today, the focus is on low-fare, low-cost carriers, whose growth throughout the 1990s has been dramatic. In the US, low-fare carrier market shares have increased from just over 5% in 1990 to almost 25% in 2003. In Europe, Asia and Australia, low-fare carriers are blossoming.
In this context, traditional network carriers must fight to remain competitive and are therefore making changes to adapt to this new competitive environment. These changes include fare structure changes, cost reductions, fleet rationalization and increased partnerships between traditional airlines. Competitive responses to low-fare entry can also be quite dramatic and have spurred concerns and comments regarding the existence of predatory behavior by researchers and airlines alike.
In this research, the effect of low-fare entry on incumbent network carriers is examined, with special focus on the impacts of entry on traditional measures of airline performance. The results illustrate how important it is to consider the effects of revenue management, network flows and competitive response to entry when explaining changes in average fares, revenues and other measures of airline performance. The results also call attention to the inappropriateness of aggregate measures of airline performance in assessing the nature of the response to entry by incumbent network carriers.
1.1. Overview of Changes in the Airline Industry since Deregulation
In October 1978, the Airline Deregulation Act allowed airlines to compete freely in the US domestic air transportation market. Individual carriers were given the right to choose where they would fly, how often and at what price. As a result, deregulation led to numerous changes in the airline industry's structure:-Chapter 1
Among the more noticeable changes, hub and spoke networks, and new pricing and marketing policies were born. Many research studies show that one of the primary consequences of deregulation has been a substantial decrease in average fares (References). Other studies have raised concerns of increases in fares in markets where network carriers have a dominant position (US DOT, 2001; Kaplan, 1995).
Another consequence of deregulation has been a wave of new entry and failure of previously regulated carriers. Kaplan (1995) reports that, of the 19 jet operators formerly regulated by the Civil Aeronautics Board (CAB), only 7 survived until 1995. The most famous survivor, Southwest Airlines (created in 1971), remains a prosperous carrier today. Even more remarkably, it has been profitable almost every quarter since its creation and for 31 consecutive years (Air Transport World), in an industry where profitability is extremely volatile and cyclical: $5B net profit in 1997 compared to $8B net losses in 2001 (Hansman, 2003). At the same time, new entrants emerged and failed very quickly. For example, as will be discussed in Chapter 2, in 1981 alone, 13 new airlines were created, while 28 ceased operations.
Since the early 1990s, a new kind of airline has played an increasing role in the US airline industry. Low-fare, low-cost carriers have substantially increased their presence in the US domestic market, and now carry over 25% of total domestic US traffic (Hazel, 2003). Low-fare carrier presence has been expanding since 1998 when network carrier profitability initially started to decrease. After major network carriers drastically reduced their capacity (post 9/11/2001), low-fare, low-cost carriers further continued their expansion. On the east coast, JetBlue started operating in early 2000 from New York to Florida and southern California; Air Tran began its operations in 1994 out of Orlando and merged in 1997 with ValuJet's operation out of Atlanta. In the central United States, Midwest Express and ATA operate out of Chicago/Milwaukee, while Spirit operates out of Detroit. Frontier operates out of Denver, and JetBlue is expanding its presence on the West Coast, and in Denver. Southwest has a national presence in the United States, mostly in secondary airports. Other smaller low-fare carriers also operate in other regions of the United States.
The growth of low-fare carriers in the US has led to a number of responses from established US carriers, ranging from matching low-fare carriers' fares in competitive markets to offering bonus miles and free flights. These responses to entry consequently raised the question of unfair and predatory competition, as we discuss in subsequent chapters. In this context, regulatory bodies in the US (US DOT) and in Canada (Competition Tribunal) have suggested a need for regulation in order to ensure fair competition. In addition, a number of legal actions were undertaken in North America to determine whether incumbent network carriers were competing unfairly against low-fare competitors. For example, in the US, American Airlines was criticized by a number of its low-fare competitors, and subsequently sued by the US
-Introduction
Department of Justice (2001), while the Competition Tribunal in Canada attempted to determine whether Air Canada competed unfairly against CanJet (2000) and WestJet (2001).
As the situation evolves in North America, the recent deregulation of aviation markets in Europe has led to similar consequences: New entrant carriers proliferate and incumbent network carriers retaliate (i.e. respond to entry with comparable strategies as their North American counterparts). Burghouwt (2003) and ICAO (2003) provide a good discussion and description of the history and effects of European deregulation on aviation markets. Among the more successful low-fare carriers in Europe are EasyJet, Ryanair and Virgin Express. In this context, European regulators have also questioned the fairness of incumbent responses, as evidenced by the ruling of the German Federal Cartel Office, which imposed a
E35 premium on Lufthansa's lowest one-way fares between Frankfurt and Berlin relative to that of its
low-fare competitors (Bundeskartellamt, 2002).
The growth of low-fare carriers is not limited to North America and Europe. Asia and Australia are also currently experiencing the birth and growth of low-fare carriers. This increased competition by low-fare carriers all over the world has spurred a number of research efforts on the effect of low-fare entry in airline markets (c.f. Chapter 3).
In this research, we focus on identifying the major drivers of airline performance in the face of low-fare entry and illustrate the pitfalls associated with using aggregate measures to assess the nature of a response by incumbent carriers. Such aggregate measures include average fares, revenues and market share. As we will show, these measures are influenced by additional factors that make them inappropriate indicators of response to entry.
1.2. Research Objectives
Our goals are twofold. First, after providing essential definitions of low-fare entry and predatory practices in the airline industry, we highlight the inappropriateness of aggregate measure of airline performance in assessing the nature of a response to entry by incumbent network carriers. Second, given the inadequacy of these measures, we determine the important factors that affect such aggregate measures, and explain the impacts of these factors on these aggregate measures, through the use of simulation.
As we will discuss in the literature review, it is often the case that regulatory agencies and researchers focus on aggregate measures of airline performance to determine the nature of a competitive response to entry. While some researchers recognize the difficulties and pitfalls associated with such conclusions, the lack of available disaggregate data, as well as the availability of aggregate data, often leads to the use
-21-Chapter 1
measures such as average fares, market shares, and passenger traffic to evaluate the nature of a response to entry. This research will show, by using case studies and simulation, that these aggregate measures are in fact very poor indicators of the competitive situation. For example, we show in Chapter 4 that two apparently comparable markets with respect to these aggregate measures, led to opposite competitive outcomes for the low-fare carriers competing against two different network carriers.
Having illustrated the inappropriateness of these aggregate measures of airline performance, we explain which important factors affect these measures through the use of simulation. We identify relative competitor capacity, competitive revenue management capabilities and the flow of network passengers as major factors leading to various changes in aggregate measures of airline performance. In particular, we note that average fares, perhaps the most commonly used measure to assess the nature of a competitive response, tend to be most affected by these factors. As a result, if average fares are the most sensitive to the previously identified factors, they undoubtedly should not be used as the primary measure in evaluating the nature of a competitive response.
Another important finding of this research is the importance of revenue management under low-fare entry. It is often assumed that incumbent carriers engage only in pricing, capacity and marketing responses to entry. This research shows that even with no such response, the mere use of revenue management can lead to very different results from cases without revenue management. Furthermore, in a network environment, network revenue management also has a very distinct impact on individual airline performance as compared to leg-based revenue management.
1.3. Structure of the Thesis
The thesis is divided into three distinct parts. In the first part, we provide background information regarding the motivation of the research and the context in which it is set. In particular, we supply a brief history of the US airline industry and how it was affected by deregulation. We focus the discussion on the effect deregulation had on the growth of new entrant carriers in general, and follow this discussion with a description of the low-fare carrier business model (Chapter 2). Although this discussion tends to center on the US experience, the low-fare business model also applies to worldwide low-fare new entrant carriers. In this first part, we also discuss the concerns of government agencies with respect to unfair competition practices in the airline industry. Finally, we provide a discussion of existing literature on the topics of predatory practices and unfair competition, low-fare entry and revenue management in the airline industry (Chapter 3).
-Introduction
In the second part of the thesis (Chapter 4), we use case studies to identify important factors affecting new entrant and incumbent carrier performance. We first describe the results of general surveys with respect to individual airline performance before and after low-fare entry as evidenced by aggregate measures of performance. We then single out two specific markets (Atlanta-Orlando and Detroit-Boston) and provide an in-depth analysis of the effects of entry. We conclude by observing that aggregate measures of airline performance (as measured by average fares, market share or revenues) do not provide a complete picture of the competitive response of incumbent carriers. We also highlight a set of important factors which help to explain differences in aggregate measures of performance. These factors are relative competitor capacity, competitive revenue management settings and network flows of passengers.
In the third part of the thesis, we use the Passenger Origin Destination Simulator (PODS) to study the individual and joint effect of previously identified factors on individual carrier performance under the assumption of low-fare entry. We first simulate entry in a single market environment (to eliminate network flow effects) under various pricing conditions for the new entrant carrier. The incumbent carriers respond to entry by either matching the new entrant carrier's lowest fare only - which we refer to as a limited match response - or by completely matching the new entrant carrier's fare structure - which we refer to as a full match response. In this single market environment, we first focus in Chapter 5 on the effect of relative competitor capacity. In Chapter 6, we add revenue management, and study the effect of revenue management and relative competitor capacity on individual carrier performance. We then extend the results to a large network environment (Chapter 7) in order to capture the combined effect of network flows of passengers with relative competitor capacity and revenue management on individual carrier performance. Results support the observation that aggregate measures of airline performance are highly dependent on these individual factors and should therefore not be used to explain the response of incumbent carriers to entry. Results also show the impact of each of these individual factors on individual carrier performance as well as the joint effect of these factors.
-24-CHAPTER 2
CONTEXT AND MOTIVATION OF THE
RESEARCH
New entrant carriers have been the focus of much attention in the recent past as more and more airlines are created, often with the goal of providing low-fare competition to established carriers. The shift in the strategy of new entrant carriers in the 1990's - from niche carriers in underserved markets to low-fare carriers directly challenging the dominance of network carriers - has changed the competitive environment and the way new entrant carriers are perceived by their competitors: Low-fare new entrant
carriers are now considered a threat to network carrier profitability.
In this chapter, we discuss the evolution of low-fare new entrant carriers and the ensuing concerns with predatory practices, as motivation to the research and upcoming case studies and simulations. We first provide a definition of low-fare new entrant carriers and discuss the history and evolution of new entrants in the U.S. airline industry. We give a brief chronological account of changes in the airline industry followed by a discussion of the situation as it is today. We highlight the importance the low-fare business model in the airline industry today and provide a comparison of the traditional model of airlines, as exemplified by U.S. Majors' and international flag carriers, to this more novel business model introduced by low-fare new entrant carriers all over the world. We then explore the impact that these carriers have had on the airline industry and, finally, we discuss the concerns of low-fare carriers and government agencies alike, with respect to unfair competition and predatory response to entry.
1 Majors are defined by the Department of Transportation as those airlines with annual operating
revenues of over $1,000,000,000.
-Chapter 2
2.1. Low-Fare New Entrants: A Definition
Most research studies usually fail to define the term new entrant airline. The wording of these studies implies that any airline that does not qualify as a "US Major" is a new entrant carrier. Some studies even go as far as to implicitly equate new entrants to low-fare or low-cost carriers and vice-versa. In the next few paragraphs, we attempt to set a stricter definition of the term, without restricting the scope of our study. We first define the concept of a new entrant carrier, and then that of a low-fare new entrant carrier.
2.1.1. New Entrants
The notion of "new entry" literally requires us to distinguish two types of entry: (1) entry into the airline industry as whole, and (2) entry into a specific market.
Therefore, according to the first type of entry, any airline starting operations should qualify as a new entrant airline. We will refer to this type of entrant as an industry new entrant. Naturally, "new entrant" is often equated with "small". A new entrant airline, by our first definition, is a small carrier having recently started operations in the airline industry. Unsurprisingly, size matters in the airline industry, and a large established carrier will therefore benefit from economies of scale and will not be overly susceptible to entry in any single market. A new entrant on the other hand will be more likely to suffer from intense competition in any one of the few markets it serves. Becoming an established carrier is therefore related to the size of the airline, which can be measured in terms of fleet, network size or passenger traffic.
A new entrant can also be an airline that offers service in a market that it did not previously serve. We will refer to this type of entrant as a market new entrant. Note that an established carrier - such as a US Major - could qualify as a market new entrant. Another observation is that any industry new entrant will necessarily be a market new entrant in any market it serves. Once again, determining when this carrier ceases to qualify as an entrant is critical. In this type of entry, while market share and size of the airline will undoubtedly play an important role in the success of entry, it should not be the only determinant of the market new entrant status. It therefore seems relevant to limit the length of time during which a carrier
is considered a market new entrant.
The confusion between new entrant carriers and low-fare, low-cost airlines is an easy one to make in that industry new entrants today are in majority low-fare, low-cost airlines. Market new entrants, on the other hand, can be established network carriers, or low-fare, low-cost carriers. In the remainder of the thesis, we focus on new entrant carriers in general: whether they are industry or market new entrants will be somewhat irrelevant to the research presented here, although the general assumption will be that the
-Context and Motivation of the Research
carriers modeled are market new entrants, operating according to the low-fare carrier business model, as described in Sections 2.1.2 and 2.3.
2.1.2. Low-Fare New Entrants
Low-fare new entrants are simply industry or market new entrants that provide service at substantially lower fares than incumbent network carriers did (or still do) post-entry. For example, numerous studies focus on the "Southwest Effect" (Hallowell and Heskett, 1993; Bennett and Craun, 1993; US DOT, 2001) and conclude that, as a general rule, when Southwest Airlines enters a new route, average fares decrease by approximately fifty percent, while traffic at least doubles. In Section 2.2, we expand the discussion on entry in the US airline industry since deregulation as well as low-fare entry since 1990.
In his 2004 thesis, Dietlin (2004) argues that fares in the airline industry are market driven rather than cost driven. Fares in the airline industry are based on origin-destination markets, rather on the cost of providing the service, which depends on the various routings offered by the airline. As a result, Dietlin argues that the notion of low-fare carrier is inappropriate since all carriers can arbitrarily price at low fare levels to match their competition, independently of their cost structure. While it is true that fares are in part market driven in the airline industry, it is also the case that only low-cost carriers can afford to price below existing steady-state fare levels and maintain a sustainable operation. In this respect, and since costs will not be taken into account in this thesis, we refer to low-fare airlines with the implication that the fares are lower because their costs allow for such low-fares.
The notion of low-fare entry is relative to pre-entry fare structure. Therefore, when referring to low-fare entrants, we will use the following guidelines. A carrier will be deemed a low-fare carrier if its fare structure undercuts that of the incumbent carriers previously operating in the market. We can arbitrarily set the minimum level of undercutting deemed admissible to meet the "low-fare" requirements to thirty percent below pre-entry unrestricted fare levels. Another possible measure of fare level could also be the average fare2
on the new entrant carrier as compared to the incumbent carrier's pre-entry average fare. However, as this thesis is set to demonstrate, average fares (and other similar measures) are a limited indicator of a carrier's pricing structure, as they reflect a number of additional competitive effects that
2 Airlines routinely offer multiple fares within any particular origin-destination market in an attempt to price discriminate. One measure of the fare paid by passengers in a particular market is therefore the average fare in the market on a particular airline.
-Chapter 2
also influence the carriers' average fares (including, but not limited to, revenue management, relative competitor's capacity, frequency, etc.).
2.2.
The Airline Industry after Deregulation: The Birth of Low-Fare
Carriers
2.2.1. New Entrants since U.S. Deregulation in 1978
Before 1978, the Civil Aeronautics Board (CAB) determined the routes each airline flew and the prices they should charge in each market. The Airline Deregulation Act, approved by Congress on October 24,
1978, and signed into law four days later by President Jimmy Carter, put an end to the era of regulation.
Deregulation brought many changes to the airline industry: The most notable changes were the growth of the "hub and spoke" networks, increased competition, reduction in fares, growth in air travel and of course new entrant carriers (Kaplan, 1995).
In 1978, the CAB reported 37 "certificated route air carriers" in its Air Carrier Financial Statistics publication (Air carrier financial statistics; Accounting, Cost and Statistics Division, Bureau of Accounts and Statistics, Civil Aeronautics Board). By 1979, the CAB reported 54 such carriers: of these 54 carriers,
17 were new entrant carriers, while the 37 pre-deregulation carriers remained.
In 1982, the CAB introduced a classification of Certificated Air Carriers into four distinct groups: 1. Majors, whose annual revenues exceed one billion dollars
2. Nationals, whose annual revenues range between $75 million and $1 billion
3. Large regionals, whose annual revenues range between $10 million and $75 million and
4. Medium regionals, whose annual revenues are below $10 million
Note that the $75 million threshold set in 1982 by the CAB was increased to $100 million in 1984. In addition, the Bureau of Transportation Statistics (Employees Certificated Carriers Database, Office of Airline Information) also provides an a posteriori breakdown of carriers (including cargo airlines) according to the CAB classification from 1978 on - even though this classification was only implemented in 1982.
Table 2.1 shows the evolution of the total number of carriers in the US as well as the breakdown by group from 1978 on. The total number of carriers quickly increased in the early 1980's as a number of new
-28-Context and Motivation of the Research
entrant carriers started operations. As shown in Figure 2.1, in 1979 alone, there were 17 new entrant carriers, compared to a total of 37 carriers listed in 1978, that is, over thirty percent of the carriers flying in 1979 were new entrant carriers. The total number of carriers kept increasing until 1981 when it started to level off. The number of airlines increased from 37 in 1978 to 78 in 1981, which represents a 111% increase within three years of deregulation.
Focusing on individual groups, we observe that in 1978 the CAB referenced 14 majors, 11 nationals, 6 large regionals and 6 medium regionals. By 1981, the number of majors remained constant, while the number of nationals had increased to 20, the number of large regionals to 9, and the number of medium regionals to 35, bringing the total number of carriers up from 37 to 78. Table 2.1 highlights the volatility of the numbers within each group, and
of regional carriers (medium or large).
shows that the greatest variations occur mostly within the category
CARRIER TYPE YEAR 1978 1979 1980 1981 1982 1983 1984 1985 1986 1987 1988 1989 1990 1991 1992 1993 1994 1995 1996 1997 1998 1999 2000 Major 14 14 14 14 11 11 13 13 13 12 12 10 12 10 10 11 11 11 12 13 13 13 14 National 11 15 18 20 16 15 14 14 17 12 12 17 15 15 16 16 23 24 24 24 24 24 24 Large Regional 6 7 10 9 15 20 30 26 27 24 25 21 19 21 19 21 23 28 23 21 21 18 13 Medium Regional 6 18 24 35 22 23 17 18 17 16 18 17 13 10 20 25 23 23 24 17 19 20 16 TOTAL 37 54 66 78 64 69 74 71 74 64 67 65 59 56 65 73 80 86 83 75 77 75 67
Table 2.1: Civil Aeronautics Board & Bureau of Transportation Statistics - Certified Route Air Carrier
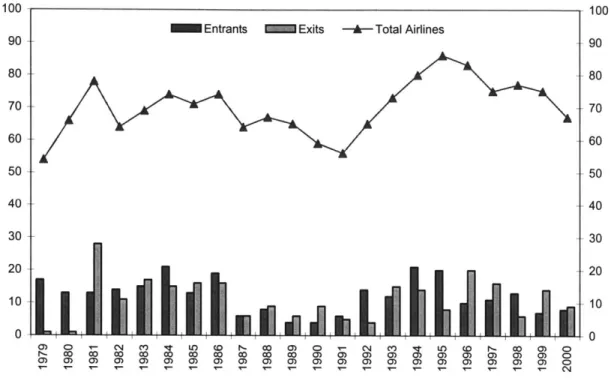
Figure 2.1 shows the evolution of the number of actual new entrants, exits and total airlines from 1979 on. This number reflects the variation in the total number of carriers from one year to the next. Figure 2.1 illustrates that there were many new entrant airlines immediately after deregulation until the mid 1980's when fewer carriers entered the US airline industry. In the early 1990's, the number of entries increased
-Chapter 2
again to finally stabilize between five and fifteen per year. The number of carriers exiting the market follows a somewhat similar pattern with a spike in total number of exits in 1981, probably due to the increase in oil prices in the late 1970's followed by the 1981-82 recession of the US economy. Overall, entries and exits consistently represent about 15-20% of total airlines.
100 90 80 70 60 50 40 30 20 10 0 0) 0) 0) 0)M )0) 0 0 0 C) 0 0) 0W 0) 0) 0 0- 0W 0 0 04. 100 90 80 70 60 50 40 30 20 10 0
Figure 2.1: Annual entering, exiting and total carriers in the U.S. airline industry post-deregulation (Source: Civil Aeronautics Board & Bureau of Transportation Statistics - Certified Route Air Carrier)
Figure 2.2 shows the cumulative number of entries and exits in the US airline industry and illustrates the continued renewal of the airline industry, with over 250 carriers starting operations between 1979 and 2000, and almost as many discontinuing operations in the same time period. Altogether, there were more cumulative new entrants than exits. Figure 2.2 highlights the number of entries increased consistently until 1986, after which it leveled off until 1992 when this number started increasing again.
-30-Context and Motivation of the Research 300 250 200 150 100 50 0) U) (0 00 0) 0) 00 co 0) E Cumulative Entrants 0D 0) Co r- N 0) 0) 0) 0) 0) 0) cr) M) a) Vj 0) 0) M Cumulative Exits
Figure 2.2: Cumulative number of entrants and exits since 1979 (Source: Bureau of Transportation Statistics, Office of Airline Information)
It is interesting to note that although one would expect new entrant carriers to start with small operations (falling under the category of "medium regional"), this is not necessarily the case. America West, for instance, began operating as a "large regional" in 1983. By 1986, America West became a national, and, finally, in 1990 reached the status of US major. JetBlue's 2000 revenues also immediately classified the airlines as a "national" carrier, and it remains a national, despite its 500% growth in revenues between 2000 and 2002. Conversely, AirTran followed a more classical pattern and started operations in 1994 as a medium regional, then became a large regional in 1997 and a national in 1998. Table 2.2 shows a sample of new entrants within each of the four categories created by the CAB and emphasizes the fact that most new entrants start operations as large or medium regionals, with a few notable exceptions such as JetBlue which started as a national carrier in 2000.
Among the major impacts of deregulation on the US airline industry, we noted the advent of hub-and-spoke networks, the decrease in average fares and the relative freedom of entry. This discussion emphasizes the impact of deregulation on entry, and highlights that while many new entrants did not survive very long, some of today's more successful airlines date back to post-deregulation. We gave the example of America West, which started as a large regional with three aircraft and became a major in 1990. Conversely, a number of established carriers also disappeared in the period between 1978 and 1990, for lack of profitability.
31
-0
0M 0 N-0)
1979 1980 1981 1982 1983 1984 1985
u Air California Midway American Trans Air Texas Int'l Braniff, Inc.
E
Air Florida New York Air Transtar0
Pacific Southwest People Express
Z Southwest
Empire Alaska Int'l Muse Air Illinois Air Atlanta Britt
Rosenbalm Pacific East America West Aspen Jet America
Southern Air Pacific Express Hawaii Express Buffalo Markair
Intl Air Service Florida Express Pilgrim
- Sunworld Frontier Horizon Ports of Call
Horizon Air South Pacific
Key
Midwest Express Pacific Interstate Ryan
Tower
Altair Air North Aeromech American Int'l Air Express Aerial Airlift
Big Sky American Eagle Aerostar Arista All Star Airmark Atlantic Gulf
Cochise Cascade Air Nevada Arrow Blue Bell Flight Inti-Aerostar Galaxy
Colgan Golden Gate Air North/Nenana Best Challenge Independent Independent Air
.2 Golden West Great American Challenge Emerald Gulf Air Transport Jet Charter Jet East
Imperial Mid South Elan Global Jet Fleet Skystar Rosenbalm
E Mackey T-Bird Guy America Jet America Mid-South Total Skybus
2 Mississippi Valley Midstate Northeastern Northern Air Trans Air Link
:5
5 NewAir Sea Airmotive Overseas South Pacific Trans International
Sky West Sun Land Peninsula Sun Country
Southeast Western Yukon
Swift Air
I)
Table 2.2: New entrant carriers 1979-1985 Information)