HAL Id: hal-00317756
https://hal.archives-ouvertes.fr/hal-00317756
Submitted on 22 Dec 2004
HAL is a multi-disciplinary open access
archive for the deposit and dissemination of
sci-entific research documents, whether they are
pub-lished or not. The documents may come from
teaching and research institutions in France or
abroad, or from public or private research centers.
L’archive ouverte pluridisciplinaire HAL, est
destinée au dépôt et à la diffusion de documents
scientifiques de niveau recherche, publiés ou non,
émanant des établissements d’enseignement et de
recherche français ou étrangers, des laboratoires
publics ou privés.
observed with oblique incidence HF radars: analysis
using simultaneous MF and VHF radar data
T. Ogawa, S. Nozawa, M. Tsutsumi, N. F. Arnold, N. Nishitani, N. Sato, A. S.
Yukimatu
To cite this version:
T. Ogawa, S. Nozawa, M. Tsutsumi, N. F. Arnold, N. Nishitani, et al.. Arctic and Antarctic polar
mesosphere summer echoes observed with oblique incidence HF radars: analysis using simultaneous
MF and VHF radar data. Annales Geophysicae, European Geosciences Union, 2004, 22 (12),
pp.4049-4059. �hal-00317756�
SRef-ID: 1432-0576/ag/2004-22-4049 © European Geosciences Union 2004
Annales
Geophysicae
Arctic and Antarctic polar mesosphere summer echoes observed
with oblique incidence HF radars: analysis using simultaneous MF
and VHF radar data
T. Ogawa1, S. Nozawa2, M. Tsutsumi3, N. F. Arnold4, N. Nishitani1, N. Sato3, and A. S. Yukimatu3 1Solar-Terrestrial Environment Lab., Nagoya Univ., Honohara, Toyokawa, Aichi 442-8507, Japan 2Solar-Terrestrial Environment Lab., Nagoya Univ., Furo-cho, Chikusa-ku, Nagoya 464-8601, Japan 3National Inst. of Polar Res., Kaga, Itabashi-ku, Tokyo 173-8515, Japan
4Dept. of Phys. and Astron., Univ. of Leicester, University Road, Leicester, LE1 7RH, UK
Received: 26 January 2004 – Revised: 19 August 2004 – Accepted: 9 September 2004 – Published: 22 December 2004
Abstract. Polar mesosphere summer echoes (PMSEs) have
been well studied using vertical incidence VHF radars at northern high-latitudes. In this paper, two PMSE events de-tected with the oblique incidence SuperDARN HF radars at Hankasalmi, Finland (62.3◦N) and Syowa Station, Antarc-tica (69.0◦S), are analyzed, together with simultaneous VHF and medium-frequency (MF) radar data. Altitude resolutions of the HF radars in the mesosphere and the lower thermo-sphere are too poor to know exact PMSE altitudes. How-ever, a comparison of Doppler velocity from the HF radar and neutral wind velocity from the MF radar shows that PM-SEs at the HF band appeared at altitudes within 80–90 km, which are consistent with those from previous vertical inci-dence HF-VHF radar results. The HF-VHF PMSE occur-rences exhibit a semidiurnal behavior, as observed by other researchers. It is found that in one event, PMSEs occurred when westward semidiurnal winds with large amplitude at 85–88 km altitudes attained a maximum. When the HF-VHF PMSEs were observed at distances beyond 180 km from MF radar sites, the MF radars detected no appreciable signatures of echo enhancement.
Key words. Meteorology and atmospheric dynamics
(mid-dle atmosphere dynamics; thermospheric dynamics; waves and tides)
1 Introduction
Polar mesosphere summer echoes (PMSEs), which ap-pear at high-latitudes under very low temperature near the mesopause in summer, have been well investigated using VHF-UHF radars at northern high-latitudes (see reviews by Cho and Kelley, 1993; Cho and R¨ottger, 1997). Recently, HF radars (Karashtin et al., 1997; Kelley et al., 2002) and a
digi-Correspondence to: T. Ogawa
(ogawa@stelab.nagoya-u.ac.jp)
tal ionosonde (dynasonde) collocated with the EISCAT VHF radar (Lee et al., 2001; Liu et al., 2002) have also been used for PMSE observations.
PMSE occurrences at VHF band are known to show a semidiurnal behavior, that is two maxima around noon and midnight (e.g. Palmer et al., 1996; Hoffmann et al., 1999). This fact suggests that physical and chemical processes af-fected by neutral wind (in particular, semidiurnal compo-nent) play a role in producing low temperature near the mesopause necessary for the formation of heavy water clus-ter ions, etc., resulting in PMSEs (e.g. Berger and von Zahn, 2002; Singer et al., 2003). The relationship between VHF PMSEs and neutral winds has been discussed by many re-searchers (Hoffmann et al., 1999 and references therein; Singer et al., 2003). Numerical modeling (Forbes, 1982; Aso, 1993) and observations (Singer et al., 2003) indicate that atmospheric tides accompany a temperature variation of less than a few K near the mesopause.
The existence of PMSEs at medium-frequency (MF) is still controversial. Some researchers report simultaneous PMSEs at VHF and MF (R¨ottger, 1994; Bremer et al., 1996; Liu et al., 2002) and phenomena that may be signatures of PMSEs (Murphy and Vincent, 2000), while others report no PMSE-related echo enhancements (Hoppe et al., 1990; Jones and Davis, 1998).
All the HF and VHF radars mentioned above have ver-tical incidence beams because PMSEs are believed to be strongest for a vertical beam with very high aspect sensitiv-ity; that is, scattering is much higher in the vertical direc-tion than from off-vertical (Czechowsky et al., 1988). Using the Syowa Station SuperDARN HF radars (69.0◦S) equipped with multibeams that have low elevation angles of about 30◦ (Greenwald et al., 1995), Ogawa et al. (2002; see also 2003b) have found, for the first time, Antarctic PMSEs at the HF band. Then, Ogawa et al. (2003a) have reported simultane-ous PMSE observations from a SuperDARN radar in Finland and an MST radar in Sweden. These studies suggest that the
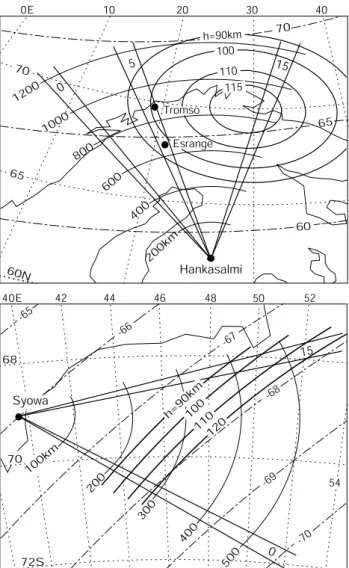
72S 70 68 Hankasalmi Syowa 15 40E 42 44 46 48 50 52 -66 -65 -68 -67 -69 -70 Esrange Tromso 100 km 200 300 500 400 1200 1000 800 600 400 200km 0 54 60N 65 70 70 60 65 0E 10 20 30 40 15 5 h=90km100 110120 0 h=90km 100 110 115
Fig. 1. Fields of view (FOVs) of (top) the Hankasalmi and (bottom) Syowa East HF radars. Each FOV is covered with 16 beams (beam numbers 0, 1, 2, ..., 15). Contour lines of perpendicularity between radar wave vector and the geomagnetic field vector at some altitudes (h) are also shown. Ground ranges from the radar site and geo-magnetic latitudes are indicated by the solid and dot-dashed curves, respectively.
aspect sensitivity is not strong at HF. Using HF radar data from Syowa Station for 46 months, Hosokawa et al. (2004) have recently investigated statistical characteristics of near range echoes, which were categorized as PMSEs by Ogawa et al. (2002). Most of the echoes appeared after local noon in summer.
In this paper, we study two PMSE events, one on 8 August 1999 and the other on 27 December 2001, detected with the SuperDARN HF radars. Since these radars, originally de-signed for the study of ionospheric E- and F -region irregu-larities, have a poor altitude resolution in the mesosphere and the lower thermosphere, it is difficult to know exact PMSE al-titudes. To resolve this problem in part, we compare Doppler velocity of HF PMSEs and simultaneous horizontal neutral wind velocity derived from an MF radar with an altitude
res-olution of 2 or 3 km. Neutral wind data on 8 August are harmonically analyzed to know how tidal wind components are related to the HF PMSE occurrences. MF radar data are also used to examine a signature of echo enhancement at the MF band that might be related to HF PMSEs.
2 Experimental setup
PMSEs to be discussed in this paper were observed with the SuperDARN HF radars located at Hankasalmi, Finland (62.3◦N, 26.6◦E; LT=UT+2 h) and Syowa Station, Antarc-tica (69.0◦S, 39.6◦E; LT=UT+3 h). Figure 1 shows the radar fields of view (FOVs). Each FOV is covered with 16 nar-row beams (beam numbers 0, 1, 2, ..., 15; each beam width
∼3.3◦) over an azimuth sector of 52◦. The beams have a maximum sensitivity at elevation angles of 15◦–35◦ (de-pending on radar frequency), suitable for the detection of fieldaligned electron density irregularities in the E and F -regions (Greenwald et al., 1985). Beam 5 of the Hankasalmi radar looks toward Esrange in Sweden (67.6◦N, 21.0◦E),
about 650 km from the radar site, where a 52-MHz MST radar is located, and also toward Tromsø in Norway (69.6◦N, 19.2◦E), about 850 km from the radar site, where a partial re-flection radar (MF radar) and an ionosonde (dynasonde) are located. The solid curves in Fig. 1 represent contour lines of perpendicularity between the radar wave vector and the geo-magnetic field vector (model: IGRF1997) at some altitudes (h): no radar wave refraction during propagation is assumed in the calculations.
On 8 August 1999, the Hankasalmi radar was operated in a special mode that is it emitted sequentially four frequen-cies close to 9, 11, 13 and 15 MHz (Ogawa et al., 2003a). At each frequency, the radar beam was sequentially scanned from beam 15 to beam 0 for about 35 s with a step in az-imuth of 3.3◦, a range resolution of 15 km, and the first range gate of 60 km. The 2.8-MHz MF radar system at Tromsø has been described by, for example, Hall (2001). In brief, it has a peak power of 50 kW, and can measure horizontal neu-tral wind and echo power, through a full correlation analysis (FCA) of data from a spaced antenna system, with a range (altitude) resolution of 3 km and a time resolution of 2 min. A pulse length of 3 km is used. Errors of wind velocities are estimated to be less than 10 m s−1. Nozawa et al. (2002) have compared neutral winds from this MF radar with those from the 931-MHz EISCAT UHF radar also located at Tromsø.
On 27 December 2001, the Syowa radar was operated in the normal mode; that is, the beam was scanned from beam 0 to beam 15 for about 120 s with a step in azimuth of 3.3◦, a range resolution of 45 km and the first range gate of 180 km. The radar frequency was around 11 MHz. Tsutsumi et al. (2001) have described the 2.4-MHz MF radar system at Syowa and presented initial results of neutral winds in the mesosphere and the lower thermosphere over Syowa Station. The radar, with a peak power of 50 kW, can measure horizon-tal neutral wind and echo power through the FCA technique,
8 August 1999
Velocity Along Beam 5 (m/s)-60 0 40 Velocity (m/s)-40 0 40 -20 -40 20 60 -20 20 MF Power (dB) 40 80 120 0 R=120-135 km R=135-150 km 9 10 11 12 UT 13 14 15 16 5 10 15 20 0 Power (dB) HF Power (dB) 5 10 15 20 0 Finland HF 9 MHz Beam 5 Finland HF 9 MHz Beam 5 (a) (c) (b) (d) R=150-165 km R=120-135 km R=135-150 km R=150-165 km MF (h=82,85,88,91 km) R=120-135 km R=135-150 km R=150-165 km Esrange Esrange 9 10 11 12 UT 13 14 15 16 9 10 11 12 UT 13 14 15 16 HF R=120-135 km R=135-150 km R=150-165 km HF MF (h=82 km) MF (h=85,88 km) MF (h=91 km)
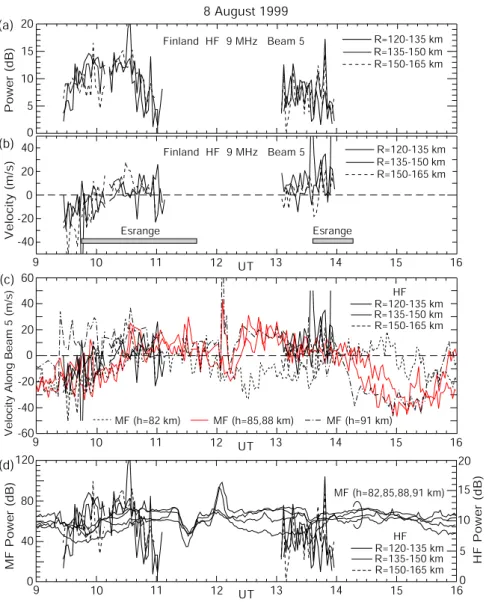
Fig. 2. Time variations of (a) echo power and (b) Doppler velocity observed at three range gates on beam 5 (looking toward Tromsø) of the Hankasalmi HF radar (9 MHz) on 8 August 1999. (c) Time variations of neutral wind velocity (positive toward Hankasalmi) along HF radar beam 5 observed at four altitudes with the Tromsø MF radar, and of Doppler velocity at three range gates on beam 5 of the HF radar. (d) Time variations of echo power observed at four altitudes with the MF radar and at three range gates on beam 5 of the HF radar. Two PMSE occurrences detected with the Esrange radar are lightly shaded in (b).
with a range (altitude) resolution of 2 km and a time resolu-tion of 2 min. A pulse length of 4 km is used.
3 Results
3.1 Event on 8 August 1999 at Hankasalmi
The PMSE event detected during 09:30–11:20 UT on 8 Au-gust 1999 with the Hankasalmi HF radar has been studied in detail by Ogawa et al. (2003a). The echoes were observed at four frequencies of 9, 11, 13 and 15 MHz at slant ranges of 105–250 km and returned from 80–100 km altitudes with elevation angles of 20◦–60◦. The echo power (≤16 dB), Doppler velocity (between −30 and +30 m s−1) and spectral width (≤60 m s−1) fluctuated with periods of several minutes
to 20 min, due to short-period atmospheric gravity waves. When the HF radar detected the echoes, the Esrange MST radar also observed typical PMSEs at 83–90 km altitudes be-tween 09:45 and 11:40 UT. This fact supports that the near range HF echoes were PMSEs at HF band, although both radars did not probe a common volume.
Figures 2a and b show time variations of the echo power and Doppler velocity, respectively, at three range gates (120– 135, 135–150 and 150–165 km) on beam 5 (looking toward Esrange and Tromsø) of the Hankasalmi radar on 8 August. The radar frequency was close to 9 MHz. The event during 09:30–11:10 UT was followed by another PMSE event be-tween 13:00 and 14:00 UT: the latter PMSEs, which were not discussed by Ogawa et al. (2003a), were also detected between 13:35 and 14:15 UT at 84–87 km altitudes with the
50 dB
Tromso MF radar 8 August 1999 100 km Power (dB) 12 UT 91 km 94 km 97 km 76 km 79 km 85 km 82 km 88 km 70 km 73 km 21 18 15 9 6 3 0 24
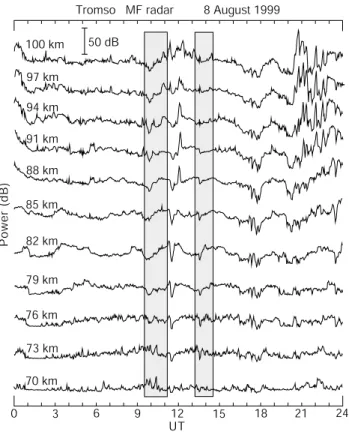
Fig. 3. Time and altitude variations of echo power observed with the Tromsø MF radar. Two PMSE occurrences detected with the Hankasalmi HF radar are lightly shaded.
Esrange MST radar. The HF echo powers in Fig. 2a are weaker in the second event than the first one. This is also true for the Esrange PMSEs. In addition, the Esrange radar observed weak, intermittent PMSEs at around 84–88 km dur-ing 00:30–04:00 UT, and rather strong PMSEs at around 85– 90 km during 23:30–24:00 UT. The Hankasalmi HF radar, however, detected no echoes in these periods.
The HF echoes in Figs. 2a and b are not due to field-aligned irregularities (FAIs) generated through plasma in-stabilities, like the gradient-drift and/or two-stream (Farley-Buneman) instabilities, in the E-region. It is well known that radar echoes due to FAIs are most strongly returned from regions where the angle between the radar wave vec-tor and the geomagnetic field vecvec-tor are close to 90◦. The contour lines of perpendicularity are shown in Fig. 1. As can be seen, if the HF echoes are caused by FAIs at al-titudes of 90–115 km in the E-region, the minimum echo range is 450 km on beam 15 and becomes farther with de-creasing beam number. No E-region echoes are expected on beams 0–3. In the observations, however, the echo ranges were 105–250 km on all the beams (Ogawa et al., 2003a). As has been described above, the Doppler velocities and spec-tral widths of the HF echoes were much smaller than those expected for E-region FAIs. Moreover, the IMAGE mag-netograms (http://www.geo.fmi.fi/image/) show that the geo-magnetic conditions over Scandinavia were quiet during the period of 09:00–15:00 UT (Kp–indices of 1+, 1 during the
50
Tromso MF Radar 8 August 1999
Northward Wind (m/s) Eastward Wind (m/s) -50 0 50 -50 0 50 -50 0 50 -50 0 50 -50 0 50 -50 0 50 -50 0 50 -50 0 50 -50 0 50 -50 0 50 -50 0 50 -50 0 91 km 76 km 82 km 79 km 85 km 88 km 79 km 82 km 85 km 88 km 91 km 76 km 24 6 0 UT12 15 9 3 18 21 24 6 0 UT 15 12 9 3 18 21
Fig. 4. Time and altitude variations of (upper) northward and (lower) eastward winds observed with the Tromsø MF radar. Two PMSE occurrences detected with the Hankasalmi HF radar are lightly shaded.
period). Under such conditions, it seems impossible to excite strong FAIs in the E- and D-regions at 105–250 km ranges. Thus, we believe that the HF echoes were backscattered from other targets in the upper mesosphere, i.e. they were PMSEs. Figure 3 displays time and (virtual) altitude variations of the echo power observed with the Tromsø MF radar on the same day. The echo power enhancements above 85 km be-fore 02:00 UT and the enhanced and/or irregular power vari-ations above 80 km after 18:00 UT are attributable to the ge-omagnetic disturbances (Kp-indices on 8 August: 2−, 1−,
1−, 1+, 1, 1−, 3−, 4−). It is clear, however, that the MF powers are not enhanced at all altitudes during the two daytime PMSE events at Hankasalmi and Esrange, and dur-ing the nighttime PMSE events at Esrange. Also, the dy-nasonde at Tromsø did not detect any echo enhancements at 3.514 MHz (M. Rietveld, private communication, 2002). These facts suggest that PMSEs did not occur or were too weak to be detected at frequencies of 2.8 and 3.5 MHz.
Figure 4 gives time and (virtual) altitude variations of the northward and eastward winds derived from the MF radar. Nozawa et al. (2002) have pointed out that MF radar wind
Period (hours) Amplitude (m/s) 12 6 mean 24 8 4.8 4 20 15 10 5 0 20 15 10 5 0 20 15 10 5 0 88 km 82 km 85 km Tromso MF Radar
8 August 1999 Northward WindEastward Wind
20 15 10 5 0 91 km 12 6 mean 24 8 4.8 4 12 6 mean 24 8 4.8 4 12 6 mean 24 8 4.8 4
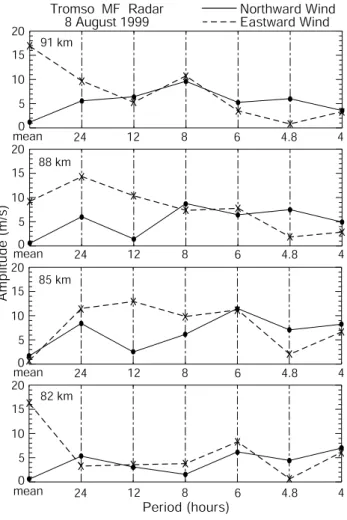
Fig. 5. Amplitude distributions of mean and tidal components of northward and eastward winds observed at four altitudes with the Tromsø MF radar.
data in summer at high-latitudes under high solar activity conditions are not reliable at altitudes above 91 km because of group retardation of the radio wave. Therefore, Fig. 4 dis-plays only the winds below 91 km. It is discernible that the wavy structures with periods of a few hours or more propa-gate vertically.
VHF PMSEs are believed to exist mostly between 80 and 90 km (R¨ottger, 1994). Unfortunately, the range resolution (15 km) for the current HF radar observations is not enough to determine precise altitudes of PMSEs shown in Figs. 2a and b. Using interferometer data from the Hankasalmi radar, Ogawa et al. (2003a) pointed out that the HF PMSE altitudes during 09:30–11:20 UT in Figs. 2a and b were between 80 and 100 km, with an altitude resolution of 10 km (or more). To derive the PMSE altitudes in another way, we compare the MF wind velocity (VMF) along beam 5 of the HF radar and
the Doppler velocity (VD) on beam 5 (Fig. 2b). The result is
displayed in Fig. 2c, where the multiple VMF at 82, 85, 88
and 91 km altitudes are plotted together with the multiple VD
(notice that the velocity sign is positive for motion toward Hankasalmi). The VD curves are fairly consistent with the
VMF curves at 85 and 88 km and deviate from those at other
altitudes, suggesting the PMSE altitudes to be around 85– 88 km. The 9 MHz echoes had elevation angles of 20◦–60◦
(see above) at which the altitude resolutions for the 15-km range resolution were 5–13 km. These altitude resolutions suggests that the multiple VD do not always represent the
winds at 85–88 km but may be smeared with those at about 80–90 km, if the echo region exists there. However, when the altitude thickness of the echo region is less than several km, the PMSE altitudes are estimated to be 85–88 km. Again no-tice that the Esrange radar detected the strong PMSEs at 83– 90 km altitudes between 09:45 and 11:40 UT and the weak PMSEs 84–87 km altitudes between 13:35 and 14:15 UT.
Figure 2d compares the MF radar echo powers at four altitudes (Fig. 3) and the HF radar echo powers (Fig. 2a). No MF power enhancements are appreciable during the HF-VHF PMSE events.
To know the behavior of mean wind and tidal compo-nents with periods from 4 to 24 h, we performed a harmonic analysis of the MF neutral wind data on this day. Figure 5 displays amplitude distributions of mean and tidal compo-nents at 82, 85, 88 and 91 km altitudes. The mean merid-ional winds close to zero are northward at 91 km and south-ward at 82–85 km, and the mean zonal winds are eastsouth-ward at 85–91 km and westward at 82 km. At 85–88 km, where the HF PMSEs seemingly appear, the diurnal meridional and zonal amplitudes are 6–8 m s−1 and 11–14 m s−1, respec-tively, and the semidiurnal meridional and zonal amplitudes are 1–3 m s−1 and 11–13 m s−1, respectively. These values are rather consistent with results from numerical modeling at 78.2◦N in August (Aso et al., 1999) and MF radar observa-tions at Tromsø (69.6◦N) in summer (Nozawa et al., 2002).
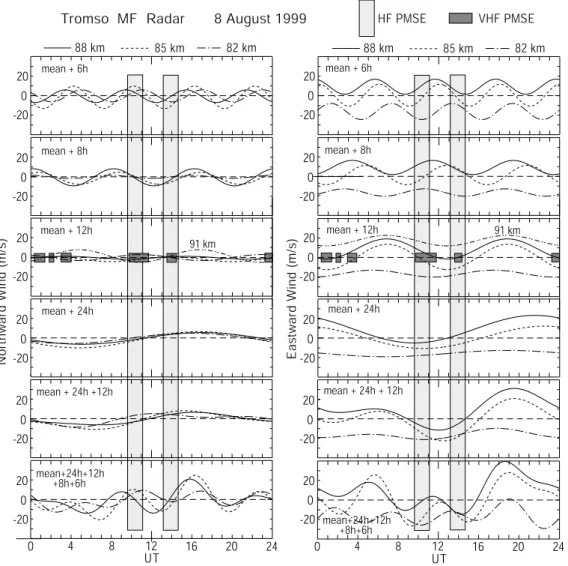
The mean winds and the 24-h, 12-h, 8-h and 6-h tidal am-plitudes and phases at 82, 85 and 88 km altitudes are used to reconstruct time variations of the tidal winds with periods of 6–24 h. The results are shown in Fig. 6. The mean +12-h components at 91 km altitude are also shown in the figure. From the timing of the PMSE occurrence at Hankasalmi and Esrange, together with the fact that the Esrange radar ob-served other weak PMSEs during 00:30–04:00 and 23:30– 24:00 UT (see above), we speculate that the HF-VHF PMSEs tend to appear when the westward semidiurnal wind at 82– 91 km altitudes attains a maximum (note that the semidiurnal wind amplitude is larger at 85–88 km where the HF PMSEs might appear). The northward semidiurnal wind is very small at 85–91 km (less than 5 m s−1; see Fig. 5). Other north-ward and eastnorth-ward tidal components (6h, 8h, and 24h) and their combinations (24 h+12 h and 24 h+12 h+8 h+6 h) can-not well explain the PMSE occurrence feature. The recon-structed eastward 24 h+12 h+8 h+6 h wind in Fig. 6 seems to well represent the observed eastward winds at 82–88 km in Fig. 4. Close inspection of the lower panel in Fig. 4 indicates that each HF PMSE event starts to appear when the winds at 82–88 km turn to westward and disappears when they attain the westward maximum, and that the winds tend to be ward between two PMSE events. We speculate that the east-ward winds, which might cause the suppression of PMSEs, are due to the localized, short-period (≤ 6 h) wave activity.
Tromso MF Radar 8 August 1999 Northward Wind (m/s) 20 0 -20 UT mean + 6h mean + 6h mean + 8h mean + 8h mean + 12h mean + 12h 88 km 85 km mean + 24h mean + 24h UT 20 0 -20 20 0 -20 20 0 -20 Eastward Wind (m/s) 20 0 -20 20 0 -20 20 0 -20 20 0 -20 0 4 8 12 16 20 24 mean+24h+12h +8h+6h mean + 24h + 12h mean + 24h +12h 0 4 8 12 16 20 24 20 0 -20 20 0 -20 20 0 -20 20 0 -20 mean+24h+12h +8h+6h HF PMSE VHF PMSE 82 km 88 km 85 km 82 km 91 km 91 km
Fig. 6. Time variations of (left) northward and (right) eastward tidal components at three altitudes reconstructed from mean wind and 24-h, 12-h, 8-h and 6-h amplitudes and phases. The mean +12-h components at 91 km altitude are also shown. PMSE occurrences detected with the Hankasalmi HF and Esrange VHF radars are shaded.
3.2 Event on 27 December 2001 at Syowa
The Syowa East HF radar detected PMSEs at ranges of 180– 315 km on all the beams during 08:40–13:30 UT on 27 De-cember 2001. The geomagnetic disturbances at Syowa dur-ing the period were quiet. Considerdur-ing this fact, the con-tour lines of perpendicularity between the radar wave and geomagnetic field vectors (Fig. 1) and the discussions in Sect. 3.1, we believe that the HF echoes did not originate from E-region FAIs but from the upper mesosphere (PM-SEs). The upper panel in Fig. 7 displays time and range vari-ations of the echo power on beams 0, 7 and 12. The radar fre-quency was close to 11 MHz. The PMSEs are characterized by highly temporal and spatial variations of the echo power, Doppler velocity and spectral width, as has been found by Ogawa et al. (2003a,b). The lower panel in Fig. 7 shows a contour map, in altitude and time coordinates, of the echo power observed with the 2.4-MHz Syowa MF radar. The echoes above 85 km are mainly due to the E-region electron
density enhanced by solar illumination. The weaker echoes at around 55–70 km continued all day, indicating that those were not associated with the HF PMSE occurrence.
Figure 8 plots time and altitude variations of the MF echo power between 70 and 100 km. The echo enhancements, with higher intensity with increasing altitude, due to solar il-lumination, can be seen above 80 km. Although the geomag-netic conditions were relatively quiet (Kp-indices of 1–2
be-tween 04:00 and 18:00 UT), the echo powers were simultane-ously enhanced at altitudes above 82 km around 10:00, 12:00 and 13:30 UT, due to high-energy particle precipitation. The echo powers between 70 and 80 km are extremely low. This fact and the particle precipitation were caused by the solar proton event associated with a large solar flare that happened at 05:40 UT on 26 December. In any event, we cannot de-termine a signature of the MF echo power enhancement as-sociated with the HF PMSE occurrence. It is noted that the altitude variations of the intensity in Figs. 7 and 8 do not al-ways represent real variations but somewhat smoothed ones
27 December 2001 Syowa East HF radar 400 300 Range (km) Syowa MF radar 40 60 50 30 70 80 90 20 Beam 0 Beam 12 Beam 7 200 100 120 100 80 60 6 8 10 UT 12 14 16 4 6 5 3 7 8 9 2 0 1 Altitude (km) (dB) (dB) 300 200 300 200 6 8 10 UT 12 14 16 27 December 2001 11 MHz 2.4 MHz 100 100
Fig. 7. Time and range variations of echo power observed (upper) on beams 0, 7, and 12 of the Syowa East HF radar (11 MHz) and (lower) with the Syowa MF radar on 27 December 2001.
50 dB
Syowa Station MF radar 27 December 2001
100 km 92 km 94 km 96 km 98 km 90 km 82 km 84 km 86 km 88 km 72 km 74 km 76 km 78 km 80 km 70 km 4 6 8 10 UT 12 14 16 18 Power (dB)
Fig. 8. Time and altitude variations of echo power observed with the Syowa MF radar. PMSE occurrence detected with the Syowa HF radar is lightly shaded.
Syowa MF Radar 27 December 2001
Eastward Wind (m/s) 50 -50 0 50 -50 0 50 -50 0 50 -50 0 50 -50 0 50 -50 0 50 -50 0 50 -50 0 50 -50 0 50 -50 0 50 -50 0 50 -50 0 Northward Wind (m/s) 10 9 11 UT 12 13 14 15 10 9 11 12 13 14 15 UT 94 km 84 km 86 km 88 km 90 km 92 km 84 km 86 km 88 km 90 km 92 km 94 km PMSE PMSE
Fig. 9. Time and altitude variations of (upper) northward and (lower) eastward winds observed with the Syowa MF radar. PMSE occurrence period detected with the Syowa HF radar is marked.
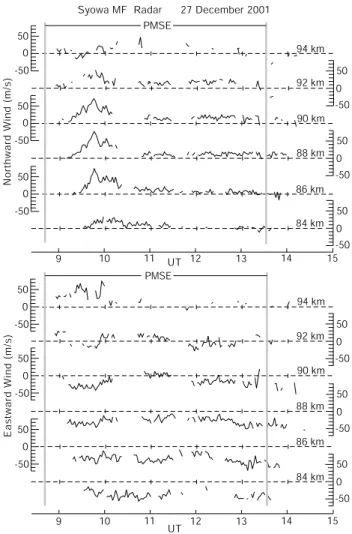
because the radar pulse length used is relatively long (4 km). Figure 9 gives time and altitude variations of the northward and eastward (VE−W) wind velocities observed with the MF
radar. Unfortunately, because of a partial lack of the data due to the solar proton event, it was impossible to derive the tidal wind components.
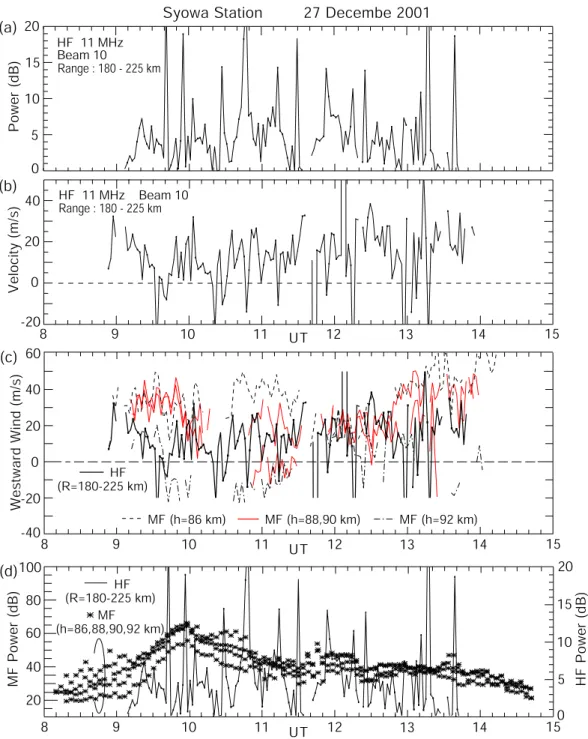
The HF and MF radar results are compared in Fig. 10. Fig-ures 10a and b give time variations of the echo power and Doppler velocity (VD), respectively, observed at the 180–
225 km range gate on beam 10 that looks toward the east. Some sporadic echo power enhancements in Fig. 10a (and corresponding velocities in Fig. 10b) may not be related to PMSEs but meteors or radio interference. Figure 10c plots eastward winds (VW −E) at four altitudes (86, 88, 90 and
92 km) and VD (Fig. 10b). In the figure, the sign of the
or-dinate is westward positive. The multiple VDare rather
con-sistent with the multiple VW −E at 88 and 90 km, although
the coincidence is not so excellent as that seen in Fig. 2c. Such a consistency is not found for the multiple VW −E at 86
and 92 km altitudes. An assumption that elevation angles of the echoes are around 30◦, around which the radar beam has
Syowa Station 27 Decembe 2001 Power (dB) 5 10 15 20 0 20 40 -20 Velocity (m/s) HF 11 MHz Beam 10 HF (R=180-225 km) 0 Range : 180 - 225 km HF 11 MHz Beam 10 Range : 180 - 225 km 0 60 20 -40 -20 40 Westward Wind (m/s) 100 20 40 60 80 12 10 8 9 11 UT 13 14 15 HF Power (dB) 5 10 15 20 0 MF Power (dB) (a) (c) (b) (d) MF (h=86,88,90,92 km) HF (R=180-225 km) 12 10 8 9 11 UT 13 14 15 12 10 8 9 11 UT 13 14 15 MF (h=86 km) MF (h=88,90 km) MF (h=92 km)
Fig. 10. Time variations of (a) echo power and (b) Doppler velocity observed at 180–225 km range gate on beam 10 of the Syowa HF (11 MHz) radar. (c) Time variations of westward wind observed at four altitudes with the Syowa MF radar, and of Doppler velocity at 180–225 km range gate on beam 10 (looking toward the geographic east) of the HF radar. (d) Time variations of echo power observed at four altitudes with the MF radar and at 180–225 km range gate on beam 10 of the HF radar.
a maximum gain, means that the altitude resolution for the 45-km range resolution is 23 km. This coarse altitude reso-lution indicates that the multiple VDdo not always represent
the winds at 88–90 km, but may be affected by those at other altitudes, if the echo scatterers exist there. However, if the altitude thickness of the echo region is less than several km, the PMSE altitudes are estimated to be 88–90 km. Consult-ing with Fig. 9, we know that the PMSE occurrence can be related to the northward (equatorward) and/or westward
neu-tral winds below 90 km altitude. Figure 10d compares the MF radar echo powers at four altitudes and the HF radar echo power (Fig. 10a). Again, noting that the MF powers during 09:00–14:00 UT increase due to the solar illumination and particle precipitation, we cannot recognize any correlation between the MF power enhancement and PMSEs.
4 Discussion
The results are summarized as follows: 1) Doppler veloc-ities observed with HF radar are similar to neutral winds, derived from MF radar, at 85–88 km and 88–90 km for the cases of 8 August 1999 (Hankasalmi) and 27 December 2001 (Syowa), respectively, 2) when PMSEs are observed with HF radar (and also with MST radar for the 8 August case), no appreciable echo enhancements at the MF band are detected, and 3) PMSE occurrences on 8 August show a semidiurnal variation; that is, PMSEs appear when westward semidiurnal wind, whose amplitude is large at 85–88 km, attains a maxi-mum.
The altitude resolutions of the current HF radars are poor (≥ 5 km). Regarding item 1, if an altitude thickness of HF echo region is thin (several km), the estimated altitudes can be regarded as PMSE altitudes. However, if the echo region exists at 80–90 km altitudes, the Doppler velocities are af-fected by the neutral winds at these altitudes, meaning that it is impossible to know the PMSE altitudes only from a com-parison of Doppler velocity and neutral wind at each altitude. Notice that the MF radar can determine wind altitudes with an accuracy of several km (depending on a pulse length of MF radar), and that “group retardation”, which locates vir-tual altitudes of MF wave reflections at somewhat (1–2 km) higher altitudes, becomes effective above 90 km (e.g. Hall, 2001). Anyway, we speculate from Figs. 2c, 6 and 10c and the interferometer measurements (Ogawa et al., 2003a) that the HF PMSE altitudes are within 80–90 km. These alti-tudes are consistent with the altialti-tudes (83–90 km) observed with the Esrange MST radar. They are also consistent with previous vertical incidence HF radar observations of PMSEs (Karashtin et al., 1997; Kelley et al., 2002).
The horizontal distances between the HF PMSE area and the MF radar site were 600–750 km and 180–315 km for the Hankasalmi and Syowa cases, respectively. So, if the neu-tral wind system is not uniform over these distances, the HF PMSE altitudes estimated above do not always give true val-ues. In the future, simultaneous PMSE observations within a common volume using oblique incidence HF radar, verti-cal incidence HF and MF radars, and vertiverti-cal incidence VHF MST radar are required. Such observations within a common volume are helpful in understanding the differences in PMSE altitudes obtained from three radars, radio wave scattering mechanisms peculiar to each radar, wave number spectrum of irregularities, and wave number dependence of aspect sen-sitivity of the irregularities.
R¨ottger (1994) reported simultaneous PMSE observations with the 224-MHz EISCAT radar at Tromsø and a 2.7-MHz MF radar at Murmansk, about 800 km east of Tromsø. Then, Bremer et al. (1996) have associated characteristics of the signal-to-noise ratio from the Tromsø MF radar with PMSEs from the collocated EISCAT VHF radar, to show a strong hint that PMSEs also occurred at the MF band. Murphy and Vincent (2000) have studied enhanced echo amplitudes detected in summer with a 1.94-MHz MF radar at Davis (68.6◦S), Antarctica, to discuss the potential use of the echo
enhancement as a measure of PMSE. Liu et al. (2002) have discussed the relationship between PMSEs from the EIS-CAT VHF radar and echoes at the MF band from the collo-cated dynasonde. Our case studies (item 2), however, show that when PMSEs appeared at the HF-VHF bands, those were not detected with the MF radar. Hoppe et al. (1990) also reported no obvious relation between Tromsø MF radar echoes and PMSEs simultaneously detected with the EIS-CAT VHF radar and an MST radar located at 130 km south-west of Tromsø. Analyzing statistically mesospheric echoes on dynasonde ionograms from Halley, Antarctica (75.5◦S) and Tromsø, Jones and Davis (1998) have found that echo characteristics were different from those of PMSEs and that there was no statistical evidence to suggest that echoes in summer were different from those in other seasons.
Regarding item 3, many papers (Palmer et al., 1996; Hoff-mann et al., 1999 and references therein) have noticed a semidiurnal behavior of VHF-PMSE occurrences. This be-havior is also true for four PMSE events detected in the aus-tral summer of 1997/1998 with the Syowa HF radars (Ogawa et al., 2003b). Using HF radar data from Syowa Station under quiet geomagnetic conditions during 46 months from March 1997 until December 2000, Hosokawa et al. (2004) have investigated seasonal and yearly variations of near range echoes, which were recognized as PMSEs by Ogawa et al. (2002). They identified 24 events: 2 of them were de-tected in winter (their origins are unclear) and 22 in summer. The echoes were mainly observed after local noon and their occurrences exhibited a semidiurnal behavior. Kirkwood et al. (1995) noted that PMSE occurrence was correlated to westward neutral wind at 85 km reconstructed from mean, diurnal and semidiurnal components, and that when the oc-currence had a minimum between 16:00 and 21:00 UT, the reconstructed wind showed strong minimum. Similar results have been presented by Bremer et al. (1996). Williams et al. (1995) concluded that tidal modes (in particular, semidi-urnal mode) play a crucial role in the generation of PMSEs, showing a semidiurnal variation with minima at 07:00 and 19:00 UT, observed with the EISCAT VHF radar. Kirkwood et al. (1995), Williams et al. (1995) and Bremer et al. (1996) used one- or two-month average neutral wind data obtained with the Tromsø MF radar. Our result, derived from the si-multaneous MF (neutral winds) and HF-VHF radar obser-vations on 8 August, indicates that the PMSE occurrences can be mainly associated with a westward semidiurnal mode and that they are coincident when this component attains to a maximum: actually, even if the semidiurnal wind is westward, PMSEs may disappear when a localized eastward wind, due to short-period gravity waves is strong. It is be-lieved that PMSEs occur when the mesopause temperatures are below, say, 150 K (Balsley and Huaman, 1997; Singer et al., 2003). Such low temperatures are favorable to form water cluster ions, charged aerosols and ice particles that may cause strong backscatter resulting in PMSEs. Numerical modeling (Forbes, 1982; Aso, 1999) and observations (Singer et al., 2003) indicate that atmospheric tides also accompany tem-perature variations of about a few K near the mesopause.
5 Conclusions
Arctic and Antarctic PMSEs observed with the oblique in-cidence SuperDARN HF radars have been studied with the help of simultaneous data from MF and VHF-MST radars. From a comparison of Doppler velocity observed by HF radar and horizontal neutral wind velocity derived from MF radar, HF PMSE altitude range is estimated to be within 80– 90 km. This altitude range is consistent with that from pre-vious PMSE observations by HF-VHF radars equipped with vertical (and nearly vertical) beams.
When the HF PMSEs were observed, no echo enhance-ments were detected with the 2.8-MHz (Tromsø) and 2.4-MHz (Syowa) MF radars. Occurrences of PMSEs at MF band are still controversial. We need more sophisticated MF radar observations to know whether or not there exist MF PMSEs. Moreover, simultaneous PMSE observations within a common volume with VHF, HF and MF radars are required to understand the conditions of the MF PMSE occurrence. Such studies are important to understand how neutral air tur-bulence invoking HF-VHF PMSEs affects scattering or re-flection of MF waves.
The 8 August event suggests that the HF and VHF PMSE occurrences exhibit a semidiurnal behavior. When they ap-peared, semidiurnal neutral wind derived from the Tromsø MF radar was westward. At present, we do not know whether the low mesopause temperature necessary for the PMSE formation stems only from westward semidiurnal wind or whether is caused by other tidal modes and/or short-period gravity waves. More modeling work, and simultaneous PMSE and wind observations are required to resolve this is-sue.
Acknowledgements. The authors wish to thank the teams at the Uni-versity of Leicester (UK) and National Institute of Polar Research (Japan) who operated the CUTLASS and Syowa Station HF radars, respectively. The Tromsø MF radar is jointly funded by the Univer-sities of Saskatchewan (Canada), Tromsø (Norway), and Nagoya (Japan). The Esrange MST radar data and Tromsø dynasonde data were kindly supplied through S. Kirkwood and M. Rietveld, respec-tively. One of the authors (TO) thanks T. Aso for his helpful discus-sion. N. F. Arnold was supported by an advanced fellowship from the UK Particle Physics and Astronomy Research Council.
Topical Editor U.-P. Hoppe thanks B. Jacobsen and another ref-eree for their help in evaluating this paper.
References
Aso, T.: Time-dependent numerical modelling of tides in the middle atmosphere, J. Geomag. Geoelectr., 45, 41–63, 1993.
Aso, T., van Eyken, A. P., and Williams, P. J. W.: EISCAT Svalbard radar-derived atmospheric diurnal features in the lower thermo-sphere as compared with the numerical modeling ATM2, Adv. Polar Upper Atmos. Res., 13, 48–56, 1999.
Balsley, B. B. and Huaman, M.: On the relationship between sea-sonal occurrence of northern hemispheric polar mesosphere sum-mer echoes and mean mesopause temperatures, J. Geophys. Res., 102, 2021–2024, 1997.
Berger, U. and von Zahn, U.: Icy particles in the summer mesopause region: Three-dimensional modeling of their environment and two-dimensional modeling of their transport. J. Geophys. Res., 107(A11), 1366, doi:10.1029/2001JA000316, 2002.
Bremer, J., Hoffmann, P., Manson, A. H., Meek, C. E., R¨uster R., and Singer, W.: PMSE observations at three different frequen-cies in northern Europe during summer 1994, Ann. Geophys., 14, 1317–1327, 1996.
Cho, J. Y. N. and Kelley, M. C.: Polar mesosphere summer radar echoes: Observations and current theories, Rev. Geophys., 31, 243–265, 1993.
Cho, J. Y. N. and R¨ottger, J.: An updated review of polar meso-sphere summer echoes: Observation, theory, and their relation-ship to noctilucent clouds and subvisible aerosols, J. Geophys. Res., 102, 2001–2020, 1997.
Czechowsky, P., Reid, I. M., and R¨uster, R.: VHF radar measure-ments of the aspect sensitivity of the summer polar mesopause echoes over Andenes (69◦N, 16◦E), Norway, Geophys. Res. Lett., 15, 1259–1262, 1988.
Forbes, J. M.: Atmospheric tides 2. The solar and lunar semidiurnal components, J. Geophys. Res., 87, 5241–5252, 1982.
Greenwald, R. A., Baker, K. B., Hutchins, R. A., and Hanuise, C.: An HF phased-array radar for studying small-scale structure in the high-latitude ionosphere, Radio Sci., 20, 63–79, 1985. Greenwald, R. A., Baker, K. B., Dudeney, J. R., Pinnock, M., Jones,
T. B., Thomas, E. C., Villain, J. -P., Cerisier, J. -C., Senior, C., Hanuise, C., Hunsucker, R. D., Sofko, G., Koehler, J., Nielsen, E., Pellinen, R., Walker, A. D. M., Sato, N., and Yamagishi, H.: DARN/SuperDARN: A global view of the dynamics of high-latitude convection, Space Sci. Rev., 71, 761–796, 1995. Hall, C.: The Ramfjordmoen MF radar (69◦N, 19◦E): Application
development 1990–2000, J. Atmos. Solar-Terr. Phys., 63, 171– 179, 2001.
Hoffmann, P., Singer, W., and Bremer, J.: Mean seasonal and diur-nal variations of PMSE and winds from 4 years of radar observa-tions at ALOMAR, Geophys. Res. Lett., 26, 1525–1528, 1999. Hoppe, U. -P., Fritts, D. C., Reid, I. M., Czechowsky, P., Hall, C. M.,
and Hansen, T. L.: Multiple-frequency studies of te high-latitude summer mesosphere: Implications for scattering processes, J. At-mos. Terr. Phys., 52, 907–926, 1990.
Hosokawa, K., Ogawa, T., Yukimatu, A. S., Sato, N., and Iyemori, T.: Statistics of Antarctic mesospheric echoes observed with the SuperDARN Syowa radar, Geophys. Res. Lett., 31, L02106, doi:10.1029/2003GL018776, 2004.
Jones, G. O. and Davis, C. J.: Occurrence and characteristics of high-latitude mesospheric echoes at MF: Observations by Halley and Tromsø dynasondes, J. Atmos. Solar-Terr. Phys., 60, 595– 605, 1998.
Karashtin, A. N., Shlyugaev, Yu. V., Abramov, V. I., Belov, I. F., Berezin, I. V., Bychkov, V. V., Eryshev, E. B., and Komrakov, G. P.: First HF radar measurements of summer mesopause echoes at SURA. Ann. Geophys., 15, 935–941, 1997.
Kelley, M. C., Huaman, M. M., Chen, C. Y., Ramos, C., Djuth, F., and Kennedy, E.: Polar mesosphere summer echo observations at HF frequencies using the HAARP Gakona Ionospheric Ob-servatory, Geophys. Res. Lett., 29(12), 10.1029/2001GL013411, 2002.
Kirkwood., S., Cho, J., Hall, C. M., Hoppe, J. -P., Murtagh, D. P., Stegman, J., Swartz, W. E., van Eyken, A. P. Wannberg, G., and Witt, G.: A comparison of PMSE and other ground-based observations during the NLC-91 campaign, J. Atmos. Terr. Phys., 57, 35–44, 1995.
Lee, C. C., Liu, J. Y., Pan, C. J., and Liu, C. H.: Doppler velocities obtained by the EISCAT VHF radar and the dynasonde during the PMSE95 campaign, J. Atmos. Solar-Terr. Phys., 63, 193– 199, 2001.
Liu, J. Y., Pan, C. J., and Lee, C. C.: VHF radar and MF/HF dy-nasonde observations during polar mesosphere summer echoes conditions at EISCAT, Earth Planets Space, 54, 691–698, 2002. Murphy, D. J. and Vincent, R. A.: Amplitude enhancements in
Antarctic MF radar echoes, J. Geophys. Res., 105, 26 683– 26 693, 2000.
Nozawa, S., Brekke, A., Manson, A., Hall, C. E., Meek, C., Morise, K., Oyama, S., Dobashi, K., and Fujii, R.: A comparison study of the auroral lower thermospheric neutral winds derived by the EISCAT UHF radar and the Tromsø medium frequency radar, J. Geophys. Res., 109(A8), 10.1029/2000JA007581, 2002. Ogawa, T., Nishitani, N., Sato, N., Yamagishi, H., and Yukimatu, A.
S.: Upper mesosphere summer echoes detected with the Antarc-tic Syowa HF radar, Geophys. Res. Lett., 29(7), 10.1029/ 2001GL014094, 2002.
Ogawa, T., Arnold, N. F., Kirkwood, S., Nishitani, N., and Lester, M.: Finland HF and Esrange MST radar observations of po-lar mesosphere summer echoes, Ann. Geophys., 21, 1047–1055, 2003a.
Ogawa, T., Hosokawa, K., Nishitani, N., Sato, N., Yamagishi, H., and Yukimatu, A. S.: Characteristics of polar mesosphere sum-mer echoes observed with oblique incidence HF radars at Syowa Station, Adv. Polar Upper Atmos. Res., 17, 13–29, 2003b. Palmer, J. R., Rishbeth, H., Jones, G. O. L., and Williams, P. J. S.:
A statistical study of polar mesosphere summer echoes observed by EISCAT, J. Atmos. Terr. Phys., 58, 307–315, 1996.
R¨ottger, J.: Polar mesosphere summer echoes: Dynamics and aeronomy of the mesosphere, Adv. Space Res., 14, (9)123– (9)137, 1994.
Singer, W., Bremer, J., Hocking, W. K., Weiss, J., Latteck, R., and Zecha, M.: Temperature and wind tides around the sum-mer mesopause at middle and Arctic latitudes, Adv. Space Res., 31(9), 2055–2060, 2003.
Tsutsumi, M., Aso, T., and Ejiri, M.: Initial results of Syowa MF radar observations in Antarctica, Adv. Polar Upper Atmos. Res., 15, 103–116, 2001.
Williams, P. J. S., Jones, G. O. L., Palmer, J. R., and Rishbeth, H.: The association of polar mesosphere summer echo layers with tidal modes, Ann. Geophys., 13, 454–457, 1995.