HAL Id: hal-00301933
https://hal.archives-ouvertes.fr/hal-00301933
Submitted on 15 Nov 2005HAL is a multi-disciplinary open access
archive for the deposit and dissemination of sci-entific research documents, whether they are pub-lished or not. The documents may come from teaching and research institutions in France or abroad, or from public or private research centers.
L’archive ouverte pluridisciplinaire HAL, est destinée au dépôt et à la diffusion de documents scientifiques de niveau recherche, publiés ou non, émanant des établissements d’enseignement et de recherche français ou étrangers, des laboratoires publics ou privés.
Measurements of optical properties of atmospheric
aerosols in Northern Finland
V. Aaltonen, H. Lihavainen, V.-M. Kerminen, M. Komppula, J. Hatakka, K.
Eneroth, M. Kulmala, Y. Viisanen
To cite this version:
V. Aaltonen, H. Lihavainen, V.-M. Kerminen, M. Komppula, J. Hatakka, et al.. Measurements of optical properties of atmospheric aerosols in Northern Finland. Atmospheric Chemistry and Physics Discussions, European Geosciences Union, 2005, 5 (6), pp.11703-11728. �hal-00301933�
ACPD
5, 11703–11728, 2005 Measurements of optical properties V. Aaltonen et al. Title Page Abstract Introduction Conclusions References Tables Figures J I J I Back CloseFull Screen / Esc
Print Version Interactive Discussion
EGU
Atmos. Chem. Phys. Discuss., 5, 11703–11728, 2005 www.atmos-chem-phys.org/acpd/5/11703/
SRef-ID: 1680-7375/acpd/2005-5-11703 European Geosciences Union
Atmospheric Chemistry and Physics Discussions
Measurements of optical properties of
atmospheric aerosols in Northern Finland
V. Aaltonen1, H. Lihavainen1, V.-M. Kerminen1, M. Komppula1, J. Hatakka1, K. Eneroth2, M. Kulmala3, and Y. Viisanen1
1
Climate and Global Change Research, Finnish Meteorological Institute, P.O. Box 503, 00 101 Helsinki, Finland
2
Department of Applied Environmental Science, Stockholm University, 10 691 Stockholm, Sweden
3
Department of Physical Sciences, Division of Atmospheric Sciences, P.O. Box 64, 00 014 University of Helsinki, Finland
Received: 14 September 2005 – Accepted: 8 October 2005 – Published: 15 November 2005 Correspondence to: V. Aaltonen (veijo.aaltonen@fmi.fi)
© 2005 Author(s). This work is licensed under a Creative Commons License.
ACPD
5, 11703–11728, 2005 Measurements of optical properties V. Aaltonen et al. Title Page Abstract Introduction Conclusions References Tables Figures J I J I Back CloseFull Screen / Esc
Print Version Interactive Discussion
EGU Abstract
Three years of continuous measurements of aerosol optical properties and simultane-ous aerosol number size distribution measurements at Pallas GAW station, a remote subarctic site in the northern border of the boreal forest zone, have been analysed. The scattering coefficient at 550 nm varied from 0.2 to 94.4 Mm−1 with an average of
5
7.1±8.6 Mm−1. Both the scattering and backscattering coefficients had a clear sea-sonal cycle with an autumn minimum and a 4–5 times higher summer maximum. The scattering was dominated by submicron aerosols and especially so during late summer and autumn. The ˚Angstr ¨om exponent had a clear seasonal pattern with maximum val-ues in late summer and minimum valval-ues during wintertime. The highest hemispheric
10
backscattering fraction values were observed in autumn, indicating clean air with few scattering particles and a particle size distribution strongly dominated by ultrafine par-ticles. To analyse the influence of air mass origin on the aerosol optical properties a trajectory climatology was applied to the Pallas aerosol data. The most polluted trajec-tory patterns represented air masses from the Kola Peninsula, Scandinavia and Russia
15
as well as long-range transport from Britain and Eastern Europe. These air masses had the largest average scattering and backscattering coefficients for all seasons. Higher than average values of the ˚Angstr ¨om exponent were also observed in connection with transport from these areas.
1. Introduction
20
There is a growing evidence that the Earth’s radiation budget, and thus climate, is affected through radiative forcing caused by changes in the concentration and com-position of aerosol particles (Lohmann and Feichter, 2005; Ramanathan et al., 2001; Charlson et al., 1999; Hansen et al., 1997). However, owing to their high spatial and temporal variability (seasonal dust storms or biomass burning), the globally and
annu-25
ACPD
5, 11703–11728, 2005 Measurements of optical properties V. Aaltonen et al. Title Page Abstract Introduction Conclusions References Tables Figures J I J I Back CloseFull Screen / Esc
Print Version Interactive Discussion
EGU
2001).
Aerosol optical properties and their relation to other aerosol properties are key fac-tors in investigating the direct radiative effects by atmospheric aerosols. The most im-portant particles in this respect are submicron accumulation mode particles (Charlson et al., 1999). However, supermicron sea salt and dust may also have an important role
5
in scattering in certain conditions (O’Dowd and Smith, 1993). Measurements concern-ing aerosol optical properties have been made in the marine boundary layer (Hegg et al., 1996), at a few coastal sites (O’Dowd and Smith, 1993; Sheridan and Ogren, 1999; Delene and Ogren, 2002; Anderson et al., 1999), in the free troposphere (Sheri-dan and Ogren, 1999), in Arctic regions (Virkkula et al., 1998; Treffeisen et al., 2004;
10
Beine et al., 1996), and in areas with a high sulfate burden (Koloutsou-Vakakis et al., 2001; Delene and Ogren, 2002). High Arctic aerosol loadings, i.e. Arctic haze, have also been investigated (Treffeisen et al., 2004; Heintzenberg et al., 2003; Beine et al., 1996). In addition to field measurements, aerosol optical properties have been studied with airborne in-situ measurements as well as from satellites (Bodhaine et al., 1991;
15
Kaufman et al., 2002).
Although the optical properties of particles with different size have been studied widely, there is still a need for measurements from remote or moderately polluted ar-eas. In this study we present results from simultaneous aerosol scattering and size distribution measurements conducted at a remote continental subarctic site. The data
20
covers three years of continuous measurements. Our purpose is to illustrate 1) how the aerosol optical properties (scattering and backscattering coefficients, ˚Angstr¨om ex-ponent, hemispheric backscattering fraction) vary seasonally and with air mass origin, and 2) how the optical properties are related to the properties of measured aerosol number size distributions.
25
ACPD
5, 11703–11728, 2005 Measurements of optical properties V. Aaltonen et al. Title Page Abstract Introduction Conclusions References Tables Figures J I J I Back CloseFull Screen / Esc
Print Version Interactive Discussion
EGU 2. Instrumentation and methods
2.1. Site description
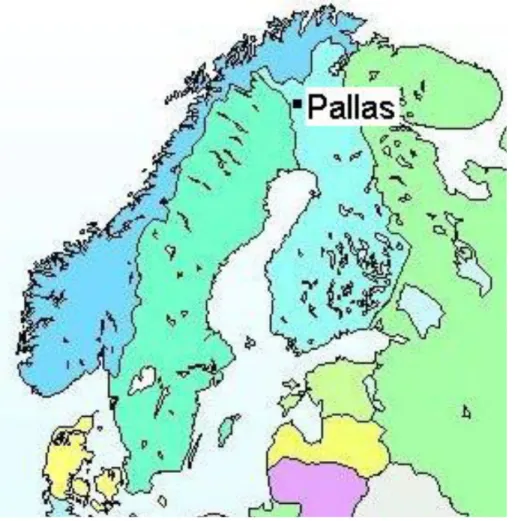
The Finnish Meteorological Institute (FMI) has participated in the Global Atmosphere Watch (GAW) programme since 1994 and maintains the Pallas-Sodankyl ¨a GAW sta-tion. The main measuring station (Fig. 1, 67◦580N, 24◦070E) is located on a top of fjeld
5
(an Arctic hill) Sammaltunturi, at the height of 560 m above sea level, and ca 300 m above the surrounding area. The measuring site is very suitable for tropospheric mea-surements due to the absence of large local and regional pollution sources. The dis-tance to the nearest town, Muonio, with some 2500 inhabitants, is 19 km to the west. The second nearest town, Kittil ¨a (6000 inhabitants) is 46 km to the south-east. The
10
closest major pollution sources are the smelters Nikel and Montshegorsk in Russia, located about 350 km away from Pallas, Nikel to the northeast and Montshegorsk to the east. A detailed description on the site is given by Hatakka et al. (2003).
2.2. Instrumentation
The scattering (σsp) and backscattering coefficients (σbsp) were measured with an
inte-15
grating nephelometer (model 3563, TSI, Inc., St. Paul, Minnesota). The measurements at Pallas have been going on continuously since February 2000. The instrument mea-sures scattering (σsp) and backscattering coefficients (σbsp) in three wavelengths, 450, 550 and 700 nm. The instrument illuminates the sample volume from the side and measures the light scattered by aerosol particles and gas molecules in the direction of
20
the photomultiplier tube integrating the scattering over angle of 7–170◦. The instrument is described in detail by Anderson et al. (1996) and Bodhaine et al. (1991). Calibration of the nephelometer is carried out at least twice per year by using CO2(purity 4.0) as high span gas and filtered air as low span gas. The averaging time is set to 5 min. The zero signal is measured once an hour.
25
ACPD
5, 11703–11728, 2005 Measurements of optical properties V. Aaltonen et al. Title Page Abstract Introduction Conclusions References Tables Figures J I J I Back CloseFull Screen / Esc
Print Version Interactive Discussion
EGU
station building, about 7 m above the ground. Calculated (Baron and Willeke, 2001) cut off diameter of the inlet nozzle and sample transport lines was about 5 µm. More detailed description of the inlet system is found in Komppula et al. (2005).
The sample air is heated to station indoor temperature (about 20◦C) prior to en-tering the nephelometer. The heater inside the nephelometer was not activated until
5
December 2003. The heater decreases condensation inside the measurement cham-ber. Before turning the heater on, the mean relative humidity (RH) was 18±10%, the maximum hourly mean RH being 60%. After turning the heater on, the mean RH was 9±3% and the maximum hourly mean RH was 23%.
The particle number size distribution in the range 7–500 nm was measured with a
10
Differential Mobility Particle Sizer (DMPS). Continuous DMPS measurements were started on 13 April 2000. The instrument and measuring arrangements have been described in detail by Komppula et al. (2003).
The total aerosol number concentration was measured with a Condensation Particle Counter (CPC, TSI model 3010). These measurements have been going on since
15
28 June 1996. The CPC measures particles larger than about 10 nm. Concentration of particles larger than 0.5 µm was measured with a Laser Particle Counter (LPC, TSI model 7550) between October 1998 and April 2004. The instrument measures number concentration of aerosol particles in two size channels, Dp>0.5 µm and Dp>5.0 µm.
Other measurements in Pallas include trace gas measurements and meteorological
20
parameters. In this analysis we used SO2concentration as well as visibility measured with a Vaisala FD12P weather sensor. The detection limit of the SO2 measurements, carried out with Thermo Electron 43 S, is 0.1 µg m−3. The weather measurements are made with an automatic weather station (Hatakka et al., 2003).
2.3. Data processing
25
Measurement data were analysed for the period from 9 November 2001 to 9 November 2004. The data associated with abnormal peaks, calibrations or visits at the station were rejected, as were also the cases when the zero mode was not activated, values
ACPD
5, 11703–11728, 2005 Measurements of optical properties V. Aaltonen et al. Title Page Abstract Introduction Conclusions References Tables Figures J I J I Back CloseFull Screen / Esc
Print Version Interactive Discussion
EGU
when the RH inside the nephelometer exceeded 40%, or the station was inside clouds. Nonidealities due to nonlambertian and truncation errors were corrected using the method described by Anderson and Ogren (1998). Nonlambertian errors are most important for sub-micron particles whereas truncation errors are most important for
>1 µm particles (Anderson and Ogren, 1998). Nonlambertian error is the slightly
5
noncosine-weighted intensity distribution of illumination light provided by the opal glass diffusor of the nephelometer. Truncation error is the geometrical blockage of near-forward-scattered light for angles below about 7◦.
For 5-min averages applied here, the detection limits for total scattering coefficients are 0.44, 0.17, and 0.26 Mm−1 for 450, 550, and 700 nm, respectively (Anderson et
10
al., 1996). For backscattering, the detection limits are 0.29, 0.11, and 0.21 Mm−1 for 450, 550, and 700 nm, respectively. Values below these detection limits were excluded. Hourly averages were calculated from valid results.
The ˚Angstr ¨om exponent, ˚a, is defined as the negative slope of the logarithm of scat-tering coefficient as a function of wavelength and is given by σsp=K λ–˚a, where K is a
15
constant. In practice, ˚a is calculated from the equation
˚a= −log σsp(700 nm) − log σsp(550 nm)
log 700 − log 550 . (1)
A large ˚Angstr ¨om exponent implies an aerosol size distribution with scattering domi-nated by submicron particles, while a distribution domidomi-nated by coarse particles has typically smaller ˚a. The hemispheric backscattering fraction, b, was obtained from
20
b=σbsp/σsp.
2.4. Cluster analysis
To analyse the influence of air-mass origin on the optical aerosol measurements at Pallas, three-dimensional 5-day back-trajectories arriving at 925 hPa were calculated, using the kinematic model FLEXTRA (Stohl and Wotawa, 1995; Stohl and Koffi, 1998;
ACPD
5, 11703–11728, 2005 Measurements of optical properties V. Aaltonen et al. Title Page Abstract Introduction Conclusions References Tables Figures J I J I Back CloseFull Screen / Esc
Print Version Interactive Discussion
EGU
Stohl et al., 1999). The model utilizes meteorological data from the European Centre for Medium Range Weather Forecasts (ECMWF). The calculations were performed twice daily (00:00 and 12:00 UTC) during the period 1997–2003, resulting in a data set of 5112 trajectories.
The trajectories were classified into different flow patterns with the use of cluster
5
analysis. Cluster analysis denotes a variety of multivariate techniques used to group similar objects together, whereby differences between individual elements within a clus-ter are minimized but differences between clusters are maximized (Romesburg, 1984). In the present study the Ward’s minimum variance technique was used, provided in a Matlab standard statistical package. Seven transport patterns, representing the
at-10
mospheric flow to Pallas during the 7-year period 1997–2003, were identified. The clustering procedure and the resulting trajectory climatology are described in detail by Eneroth et al. (2005).
3. Results and discussion
3.1. General features
15
Figure 2 shows daily mean scattering coefficients σsp at 550 nm covering the whole measurement period. The value of σspvaries widely – more than two orders of mag-nitude. This variation is embedded in the consistent seasonal cycle discussed below. Gaps in the data are mainly due to burned lamp or maintenance.
Statistical properties of the hourly mean values of the measured and calculated
20
parameters are presented in Table 1. Based on three years of hourly averaged data, σsp at 550 nm varied in the range 0.2–94.4 Mm−1 with an average of 7.1 Mm−1 and a standard deviation (STD) of 8.6 Mm−1. These values are lower than those (10.4±11.1 Mm−1) measured between October 1997 and September 2000 in Barrow, Alaska (Delene and Ogren, 2002), but higher than those measured in Ny- ˚Alesund,
25
Svalbard (5.0±3.9 Mm−1) during the Arctic haze period in spring 1994 (Beine et al., 11709
ACPD
5, 11703–11728, 2005 Measurements of optical properties V. Aaltonen et al. Title Page Abstract Introduction Conclusions References Tables Figures J I J I Back CloseFull Screen / Esc
Print Version Interactive Discussion
EGU
1996).
The seasonal variation of various optical parameters can best be seen from the monthly-average data, which is shown in Fig. 3. Both the scattering and backscattering coefficients display a clear seasonal cycle with an autumn minimum and a 4–5 times higher summer maximum. These two parameters started to rise early in spring,
reach-5
ing their highest values in summer. After July the values decreased very rapidly and stayed relative constant during the autumn. The autumn scattering minimum may be related to the fact that both cloudiness and precipitation have their maximum in au-tumn, and therefore the air is expected to be cleaner. The scattering coefficient usually reached its maximum in July and minimum in October. The backscattering coefficient
10
behaved in the same way, though with lower absolute values. At Barrow, Alaska, σsp was lowest in summer and highest (10–15 times higher than summer values) in winter (Delene and Ogren, 2002). High values at Barrow in winter are related to a winter max-imum in submicron sulfate aerosol and sea-salt aerosol mass concentration, indicating periods of Arctic haze as well as high sea-salt mass concentrations.
15
The ˚Angstr ¨om exponent also had a clear seasonal variation with a minimum in spring and a 2–4 times higher maximum in late summer. Based on the absolute values of ˚a, we conclude that scattering is dominated by submicron aerosols in Pallas, and espe-cially so during late summer and autumn. The hemispheric backscattering fraction b at 550 nm varied by roughly a factor two between the months but does not show a
20
consistent seasonal pattern.
3.2. Relationships between the measured quantities
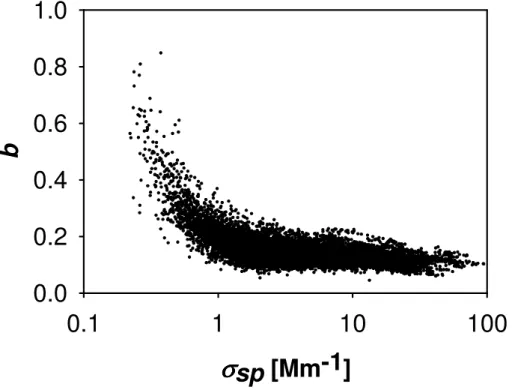
The scattering and backscattering coefficients were found to be strongly correlated to each other. The ratio of these two quantities, the hemispheric backscattering fraction
b, was also found to be dependent on the magnitude of σsp(Fig. 4). For σsp>1 Mm−1,
25
the value of b decreased gradually with increasing σsp, being mostly below 0.2 when
ACPD
5, 11703–11728, 2005 Measurements of optical properties V. Aaltonen et al. Title Page Abstract Introduction Conclusions References Tables Figures J I J I Back CloseFull Screen / Esc
Print Version Interactive Discussion
EGU
and Ogren (2002) at four different sites in Northern America. Interestingly, b started to increase very rapidly with decreasing σspin very clean air (σsp<1 Mm−1). A closer look at the particle size distribution data revealed that these cases were characterized by very low accumulation mode particle number concentrations, as well as a particle size distribution strongly dominated by ultrafine particles.
5
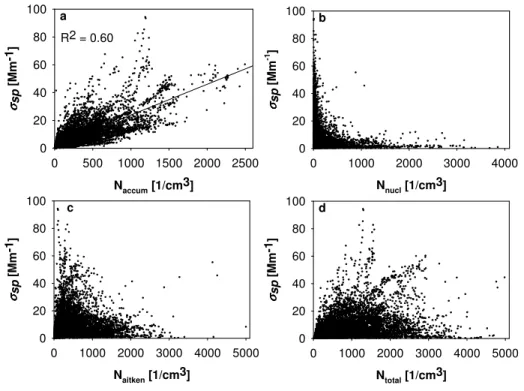
Figure 5 displays σsp as a function of the particle number concentration in different modes, including the accumulation mode (particle diameter 95–500 nm), aitken mode (25–95 nm) and nucleation mode (7–25 nm). Aerosol particles in the accumulation mode have the highest scattering efficiency at measured wavelengths. This can be seen as a clear correlation between σspand the number concentration of accumulation
10
mode particles (Fig. 5a). The relation between σsp and the number concentration of nucleation mode particles displays an envelope type pattern (Fig. 5b), with high values of σsp being always associated with low nucleation mode particle number concentra-tion and vice versa. This kind of behaviour can be explained in two ways: 1) no major primary sources (such as traffic emissions) for nucleation mode particles observed at
15
Pallas exist, and 2) atmospheric new-particle formation at Pallas takes place only in clean air masses originating from the North Atlantic or the Arctic Ocean (Komppula et al., 2003). No clear connection between σspand the aitken mode particle number con-centration (Fig. 5c), or between σsp and total particle number concentration (Fig. 5d), could be seen.
20
The scattering coefficient σsp correlated strongly with the particle number concen-tration measured by the LPC (Fig. 6d, R2=0.71), which is consistent with the results by Virkkula et al. (1998) at another Finnish Arctic site. This correlation is higher than that of σsp with the number concentration of accumulation mode particles (R2=0.60), but lower than that of σsp with 400–500 nm particles (R2=0.87) or with 300–400 nm
25
particles (Fig. 6c, R2=0.92). By looking at particles larger than a certain threshold size, rather than by looking at specific size ranges, a complementary picture emerges. For example, the correlation between σsp and >200 nm particles was 0.85 (Fig. 6a), that between σspand >300 nm particles was 0.93 (Fig. 6b), and that between σspand
ACPD
5, 11703–11728, 2005 Measurements of optical properties V. Aaltonen et al. Title Page Abstract Introduction Conclusions References Tables Figures J I J I Back CloseFull Screen / Esc
Print Version Interactive Discussion
EGU
>400 nm particles was 0.87. No correlation could be seen between σspand concen-tration of 100–200 nm particles. Probably most of the particles in the accumulation mode are too small to effectively scatter the atmospheric radiation in the visible range. When using the backscattering coefficient instead of scattering coefficient, a behaviour similar to that in Figs. 5 and 6 was observed.
5
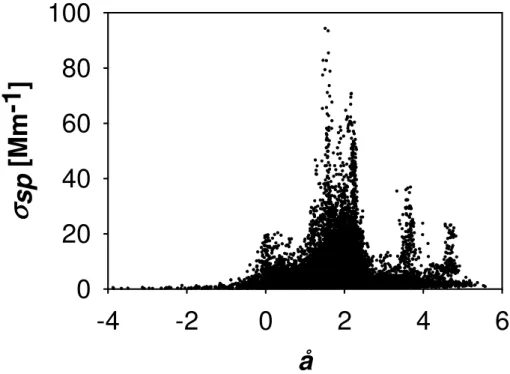
The highest values of σsp (>40 Mm−1) were observed in air with ˚Angstr ¨om expo-nents ˚a in the range 1.3–2.3 and with SO2 concentrations typically smaller than a few
µg/m3 (Fig. 7). This indicates that these episodes were dominated by submicron par-ticles from various combustion sources. The largest regional pollution source affecting Northern Finland is the Kola Peninsula industrial area some 350 km east from Pallas.
10
During periods of air mass transport from this area the highest SO2 concentrations (>10 µg/m3) are observed at Pallas (Virkkula et al., 1998; Ruuskanen et al., 2003). Although higher than averages, the values of σsp were mostly below 10 Mm−1 in air clearly affected by Kola Peninsula sources. Taken together, these things suggest that the episodes showing the highest values of scattering are associated with long-range
15
transported particulate pollution originating from Central or Eastern Europe rather than by local or regional pollution.
3.3. Long-range transport
Figure 8 shows the calculated climatology for trajectories arriving at Pallas at 925 hPa. The clusters are depicted by mean trajectories. The cluster mean represents the
aver-20
age pathway of trajectories in that cluster and describes potential source areas within a 5-day transport time to Pallas. Each cluster is assigned an identification number (1– 7). Clusters 3–5 represent transport across the Arctic Basin, clusters 2 and 6 from the Eurasian continent, and clusters 1 and 7 from the Atlantic. The mean trajectory length for each of the clusters is shown in Fig. 8. The highest mean wind speeds, i.e. the
25
longest trajectories, are found in connection with transport over the Atlantic (clusters 1 and 7). Clusters 2, 4 and 6 are associated with the lowest mean wind speeds. Figure 8
ACPD
5, 11703–11728, 2005 Measurements of optical properties V. Aaltonen et al. Title Page Abstract Introduction Conclusions References Tables Figures J I J I Back CloseFull Screen / Esc
Print Version Interactive Discussion
EGU
also shows the mean frequency of occurrence of the transport clusters. However, this frequency of occurrence co-varies with the seasonal changes of the general circulation patterns (Eneroth et al., 2005).
To study the influence of long-range atmospheric transport on the observed optical aerosol properties at Pallas, the aerosol data were correlated with cluster membership.
5
The data was divided into seven separate groups according to the trajectory clima-tology. The mean value of the hourly means between ±1 h of the arrival time of the trajectory was calculated and used in the analysis.
In terms of aerosol properties, the cleanest air conditions were associated with clusters 3 and 7 containing trajectories originating from the Arctic Ocean and the
10
North Atlantic, respectively. These clusters had the lowest average scattering and backscattering coefficients (σspat 550 nm for clusters 3 and 7 were 3.2±3.3 Mm−1and 4.0±3.4 Mm−1, respectively) as well as accumulation mode particle number concen-trations for all seasons. The same clusters also showed high nucleation mode particle number concentrations during spring and late summer, which is an indication of new
15
particle formation (Komppula et al., 2003). The most polluted conditions were associ-ated with cluster 1 representing air mass transport from Scandinavia and Britain, and cluster 6, representing air mass transport from Russia and Eastern Europe. Cluster 6 also includes trajectories from the polluted Kola Peninsula area. Clusters 1 and 6 showed the largest average scattering and backscattering coefficients (σsp at 550 nm
20
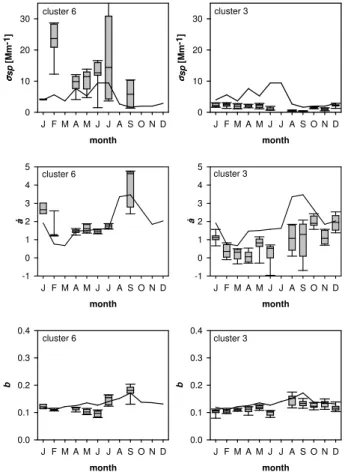
were 12.2±16.8 Mm−1 and 16.2±9.1 Mm−1, respectively) as well as the largest ac-cumulation mode particle number concentrations for all seasons. Furthermore, these clusters were associated with year-round low nucleation mode particle number concen-trations. Figure 9 shows monthly variations of σspat 550 nm, ˚a as well as b at 550 nm for clusters 6 and 3, illustrating polluted and clean air conditions at Pallas, respectively.
25
From Fig. 9 it can be seen that the ˚Angstr ¨om exponent has a clear seasonal pattern for all clusters, with maximum values in autumn and minimum values during winter. The high autumn values of ˚a could possible be related to the maximum cloud frequency ob-served in Pallas at that time of the year. When clouds are present, the relative amount
ACPD
5, 11703–11728, 2005 Measurements of optical properties V. Aaltonen et al. Title Page Abstract Introduction Conclusions References Tables Figures J I J I Back CloseFull Screen / Esc
Print Version Interactive Discussion
EGU
of large sea-salt and dust particles is likely to be reduced, causing an increase in the value of ˚a. On average, the values of ˚a were found to be somewhat higher in connection with clusters 1, 2 and 6 compared to the other transport patterns. This may be due to the dominance of submicron pollution-related particles in these air masses. The high-est values of the hemispheric backscattering fraction was observed in autumn for all
5
clusters, indicating clean air with few scattering particles and particle size distribution emphasized by ultrafine particles. No clear linkage between atmospheric circulation and the observed aitken mode and total particle number concentrations was found.
4. Summary and conclusions
Three years of continuous measurements of aerosol optical properties have been
anal-10
ysed at Pallas GAW station, a remote subarctic site in the northern border of the boreal forest zone. The measurements were analysed as a function of aerosol size distribu-tion and atmospheric long-range transport. The seasonal variadistribu-tion of the data was also studied. The scattering coefficient at 550 nm varied from 0.2 to 94.4 Mm−1 with an av-erage of 7.1±8.6 Mm−1. Both the scattering and backscattering coefficients had a clear
15
seasonal cycle with an autumn minimum and 4–5 times higher summer maximum. Also the ˚Angstr ¨om exponent varied over the year, having a minimum in spring and 2–4 times higher maximum values in late summer. The scattering was dominated by submicron aerosols in Pallas, and especially so during late summer and autumn. The ratio be-tween the backscattering and scattering coefficients was very high at small scattering
20
coefficients. These cases were characterized by very low accumulation mode parti-cle number concentrations, as well as partiparti-cle size distributions strongly dominated by ultrafine particles.
The scattering coefficient correlated strongly with the number concentration of ac-cumulation mode particles, even though most acac-cumulation mode particles were too
25
small to effectively scatter at the measured wavelengths. The relation between σspand nucleation mode particle number concentration displayed an envelope type pattern,
ACPD
5, 11703–11728, 2005 Measurements of optical properties V. Aaltonen et al. Title Page Abstract Introduction Conclusions References Tables Figures J I J I Back CloseFull Screen / Esc
Print Version Interactive Discussion
EGU
with high values of σsp being associated with low nucleation mode particle number concentration and vice versa. This kind of behaviour is due to the fact that atmospheric new-particle formation at Pallas takes place only in clean air masses originating from the North Atlantic or the Arctic Ocean.
Aerosol data was inspected in terms of trajectory clusters, each of which
repre-5
senting different regions of air masses origin. The cleanest air mass conditions were observed in connection with trajectories coming from the Arctic Ocean and the North Atlantic, showing the lowest average scattering and backscattering coefficients as well as the lowest accumulation mode particle number concentrations all year-round. The most polluted air masses were associated with air mass transport from the Kola
Penin-10
sula, Scandinavia and Russia as well as Britain and Eastern Europe. These trajectory clusters had the largest average scattering and backscattering coefficients as well as the largest accumulation mode particle number concentrations for all the seasons.
Our results demonstrate that aerosol optical properties, including scattering and backscattering coefficients and ˚Angstr¨om exponent, depend strongly on the aerosol
15
number size distribution. In the future, we will focus on 1) optical closure studies based on the aerosol number size distribution, chemical composition, and optical parameters such as index of refraction and the RH dependence of scattering, and 2) column clo-sure experiments including aerosol optical depth attained by surface meaclo-surements and estimations of vertical distribution of extinction coefficient and RH.
20
References
Anderson, T. L., Covert, D. S., Marshall, S. F., Laucks, M. L., Charlson, R. J., Waggoner, A. P., Ogren, J. A., Caldow, R., Holm, R. L., Quant, F. R., Sem, G. J., Wiedensohler, A., Ahlquist, N. A., and Bates, T. S.: Performance characteristics of a high-sensitivity, three-wavelength, total scatter/backscatter nephelometer, J. Atmos. Oceanic Technol., 13, 967–986, 1996.
25
Anderson, T. L. and Ogren, J. A.: Determining aerosol radiative properties using the TSI 3563 integrating nephelometer, Aerosol. Sci. Technol., 29, 57–69, 1998.
ACPD
5, 11703–11728, 2005 Measurements of optical properties V. Aaltonen et al. Title Page Abstract Introduction Conclusions References Tables Figures J I J I Back CloseFull Screen / Esc
Print Version Interactive Discussion
EGU
Anderson, T. L., Covert, D. S., Wheeler, J. D., Harris, J. M., Perry, K. D., Trost, B. E., Jaffe, D. J., and Ogren, J. A.: Aerosol backscatter fraction and single scattering albedo: Measured values and uncertainties at a coastal station in the Pacific Northwest, J. Geophys. Res., 104, 26 793–26 807, 1999.
Baron, P. A. and Willeke, K.: Aerosol Measurement, 2nd ed., John Wiley, Hoboken, N. J.,
5
2001.
Beine, H. J., Engardt, M., Jaffe, D. A., Hov, Ø., Holm´en, K., and Stordal., F.: Measurements of NOx and aerosol particles at the Ny- ˚Alesund Zeppelin mountain station on Svalbard: Influ-ence on regional and local pollution sources, Atmos. Environ., 30, 1067–1079, 1996. Bodhaine, B. A., Ahlquist, N. C., and Schnell, R. C.: Three-wavelength nephelometer suitable
10
for aircraft measurement of background aerosol scattering coefficient, Atmos. Environ., 25A, 2267–2276, 1991.
Bodhaine, B.: Aerosol absorption measurements at Barrow, Mauna Loa and the south pole, J. Geophys. Res., 100, 8967–8975, 1995.
Charlson, R. J., Anderson, T. L., and Rodhe, H.: Direct climate forcing by anthropogenic
15
aerosols: quantifying the link between atmosphere sulfate and radiation, Contr. Atmos. Phys., 72, 79–94, 1999.
Delene, D. J. and Ogren, J. A.: Variability of aerosol optical properties at four North American surface monitoring sites, J. Atmos. Sci., 59, 1135–1150, 2002.
Eneroth, K., Aalto, T., Hatakka, J., Holm ´en, K., Laurila, T., and Viisanen, Y.: Atmospheric
20
transport of carbon dioxide to a baseline monitoring station in northern Finland, Tellus, 57B, 366–374, 2005.
Hansen, J., Sato, M., and Ruedy, R.: Radiative forcing and climate response, J. Geophys. Res., 102, 6831–6864, 1997.
Hatakka, J., Aalto, T., Aaltonen, V., Aurela, M., Hakola, H., Komppula, M., Laurila, T.,
Li-25
havainen, H., Paatero, J., Salminen, K., and Viisanen, Y.: Overview of the atmospheric research activities and results at Pallas GAW station, Boreal Env. Res., 8, 365–383, 2003. Hegg, D. A., Covert, D. S., Rood, M. J., and Hobbs, P. V.: Measurements of aerosol optical
properties in marine air, J. Geophys. Res., 101, 12 893–12 903, 1996.
Heintzenberg, J. and Charlson, R. J.: Design and Applications of the Integrating Nephelometer:
30
A Review, J. Atmos. Oceanic Technol., 13, 987, 1996.
Heintzenberg, J., Tuch, T., Wehner, B., Wiedensohler, A., Wex, H., Ansmann, A., Mattis, I., M ¨uller, D., Wendisch, M, Eckhardt, S., and Stohl, A.: Arctic haze over Central Europe, Tellus,
ACPD
5, 11703–11728, 2005 Measurements of optical properties V. Aaltonen et al. Title Page Abstract Introduction Conclusions References Tables Figures J I J I Back CloseFull Screen / Esc
Print Version Interactive Discussion
EGU
55B, 796–807, 2003.
Intergovernmental Panel on Climate Change: Climate Change 2001: The Scientific Basis (con-tribution of working group I to the Third Assessment Report of the Intergovernmental Panel on Climate Change), Cambridge Univ. Press, Cambridge, 2001.
Kaufman, Y. J., Tanr ´e, D., and Boucher, O.: A satellite view of aerosols in the climate system,
5
Nature, 419, 215–223, 2002.
Koloutsou-Vakakis, S., Carrico, C. M., Kus, P., Rood, M. J., Li, Z., Shrestha, R., Ogren, J. A., Chow, J. C., and Watson, J. G.: Aerosol properties at a midlatitude Northern Hemisphere continental site, J. Geophys. Res., 106, 3019–3032, 2001.
Komppula, M., Lihavainen, H., Hatakka, J., Paatero, J., Aalto, P., Kulmala, M., and Viisanen,
10
Y.: Observations of new particle formation and size distributions at two different heights and surroundings in subarctic area in northern Finland, J. Geophys. Res., 108, D9, 4295, doi:10.1029/2002JD002939, 2003.
Komppula, M., Lihavainen, H., Kerminen, V.-M., Kulmala, M., and Viisanen, Y.: Measurements of cloud droplet activation of aerosol particles at a clean subarctic background site, J.
Geo-15
phys. Res., 110, D06204, doi:10.1029/2004JD005200, 2005.
Lohmann, U. and Feichter, J.: Global indirect aerosol effects: a review, Atmos. Chem. Phys., 5, 715–737, 2005,
SRef-ID: 1680-7324/acp/2005-5-715.
O’Dowd, C. D. and Smith, M. H.: Physico-chemical properties of aerosols over the Northeast
20
Atlantic: Evidence for wind-speed-related sub-micron sea-salt aerosol production, J. Geo-phys. Res., 98, 1137–1149, 1993.
Ramanathan, V., Crutzen, P. J., Kiehl, J. T., and Rosenfeld, D.: Aerosols, climate, and the hydrological cycle, Science, 294, 2119–2124, 2001.
Romesburg, H. C.: Cluster analysis for Researchers, Lifetime Learning Publications, Belmont,
25
California, 1984.
Ruuskanen, T. M., Reissell, A., Keronen, P., Aalto, P. P., Laakso, L., Gr ¨onholm, T., Hari, P., and Kulmala, M.: Atmospheric trace gas and aerosol particle concentration measurements in Eastern Lapland, Finland 1992–2001, Boreal Env. Res., 8, 335–349, 2003.
Seinfeld, J. H. and Pandis, S. N.: Atmospheric chemistry and physics. From air pollution to
30
climate change, John Wiley & Sons, Inc., New York, 1998.
Sheridan, P. J. and Ogren, J. A.: Observations of the vertical and regional variability of aerosol optical properties over central and eastern North America, J. Geophys. Res., 104, 16 793–
ACPD
5, 11703–11728, 2005 Measurements of optical properties V. Aaltonen et al. Title Page Abstract Introduction Conclusions References Tables Figures J I J I Back CloseFull Screen / Esc
Print Version Interactive Discussion
EGU
16 805, 1999.
Stohl, A. and Koffi, N. E.: Evaluation of trajectories calculated from ECMWF data against con-stant volume balloon flights during ETEX, Atmos. Environ., 24, 4151–4156, 1998.
Stohl, A. and Wotawa, G.: A method for computing single trajectories representing boundary layer transport, Atmos. Environ., 29, 3235–3239, 1995.
5
Stohl., A., Haimberger, L., Scheele, M. P., and Wernli, H.: An intercomparison of results from three trajectory models, Meteorol. Appl., 8, 127–135, 1999.
Treffeisen, R., Herber, A., Str¨om, J., Shiobara, M., Yamanouchi, T., Yamagata, S., Holm´en, K., Kriews, M., and Schrems, O.: Interpretation of Arctic aerosol properties using cluster analysis applied to observations in the Svalbard area, Tellus, 56B, 457–476, 2004.
10
Virkkula, A., Hillamo, R. E., Kerminen, V.-M., and Stohl, A.: The influence of Kola Peninsula, continental European and marine sources on the number concentrations and scattering coef-ficients of the atmospheric aerosol in Finnish Lapland, Boreal Env. Res., 2, 317–336, 1998.
ACPD
5, 11703–11728, 2005 Measurements of optical properties V. Aaltonen et al. Title Page Abstract Introduction Conclusions References Tables Figures J I J I Back CloseFull Screen / Esc
Print Version Interactive Discussion
EGU
Table 1. Statistics of aerosol optical parameters. The averages are expressed as arithmetic
means (AM), and variations as standard deviations (STD). Scattering and backscattering co-efficients are given in unit Mm−1, while DMPS and LPC number concentrations are given in particles cm−3. SO2concentrations are given in µg/m3.
Percentiles Parameter N AM STD 10 50 90 99 σsp(450 nm) 13 357 10.2 12.6 1.5 5.5 24.7 65.3 σsp(550 nm) 13 381 7.1 8.6 1.0 3.9 16.8 44.4 σsp(700 nm) 13 325 4.6 5.5 0.6 2.7 10.7 26.9 σbsp(450 nm) 12 833 1.2 1.2 0.4 0.7 2.6 6.4 σbsp(550 nm) 13 263 0.9 1.0 0.2 0.5 2.1 5.1 σbsp(700 nm) 12 428 0.9 0.9 0.3 0.6 1.9 4.5 ˚a550/450 nm 13 349 1.7 0.6 0.9 1.8 2.4 3.2 ˚a700/450 nm 13 280 1.8 0.7 0.8 1.8 2.7 3.9 ˚a700/550 nm 13 311 1.8 1.0 0.6 1.8 3.1 4.7 b450 nm 12 823 0.1 0.1 0.1 0.1 0.2 0.5 b550 nm 13 261 0.1 0.1 0.1 0.1 0.2 0.4 b700 nm 12 419 0.2 0.1 0.1 0.2 0.3 0.6 Ntotal 11 151 764 736 94 528 1783 3132 Nnucl 11 151 145 283 10 48 366 1410 Naitken 11 151 375 464 31 206 979 2007 Naccum 11 151 243 310 29 118 644 1436 N100−200 nm 11 224 173 238 17 74 482 1066 N200−300 nm 11 224 56 74 5 30 138 366 N300−400 nm 11 224 14 19 1 6 36 98 N400−500 nm 11 204 4 5 0 2 9 26 N>100 nm 11 189 247 320 29 119 650 1474 N>200 nm 11 189 73 96 7 38 181 488 N>300 nm 11 189 17 24 2 8 45 123 N>500 nm, LPC 10 505 2 2 0 1 4 9 SO2 12 901 0.5 1.3 0.0 0.2 1.0 4.9 11719
ACPD
5, 11703–11728, 2005 Measurements of optical properties V. Aaltonen et al. Title Page Abstract Introduction Conclusions References Tables Figures J I J I Back CloseFull Screen / Esc
Print Version Interactive Discussion
EGU
ACPD
5, 11703–11728, 2005 Measurements of optical properties V. Aaltonen et al. Title Page Abstract Introduction Conclusions References Tables Figures J I J I Back CloseFull Screen / Esc
Print Version Interactive Discussion EGU
date
11/2001 11/2002 11/2003 11/2004
σσσσ
sp
[M
m
-1
]
0
10
20
30
40
50
60
70
Fig. 2. Time-series of σspat 550 nm. 11721ACPD
5, 11703–11728, 2005 Measurements of optical properties V. Aaltonen et al. Title Page Abstract Introduction Conclusions References Tables Figures J I J I Back CloseFull Screen / Esc
Print Version Interactive Discussion EGU month 11/2001 11/2002 11/2003 11/2004 σσσσ sp [M m -1] 0 5 10 15 20 a month 11/2001 11/2002 11/2003 11/2004 σσσσbs p [M m -1] 0 1 2 3 b month 11/2001 11/2002 11/2003 11/2004 å 0 1 2 3 4 5 c month 11/2001 11/2002 11/2003 11/2004 b 0.10 0.14 0.18 0.22 d
Fig. 3. Monthly average values of (a) σspat three wavelengths,(b) σbspat three wavelengths,
(c) ˚a and (d) b at 550 nm. Triangles, circles and squares correspond to σspand σbspvalues at 450 nm, 550 nm and 700 nm, respectively.
ACPD
5, 11703–11728, 2005 Measurements of optical properties V. Aaltonen et al. Title Page Abstract Introduction Conclusions References Tables Figures J I J I Back CloseFull Screen / Esc
Print Version Interactive Discussion EGU
σσσσ
sp [Mm-1]
0.1
1
10
100
b
0.0
0.2
0.4
0.6
0.8
1.0
Fig. 4. Relation between σspand b at 550 nm.
ACPD
5, 11703–11728, 2005 Measurements of optical properties V. Aaltonen et al. Title Page Abstract Introduction Conclusions References Tables Figures J I J I Back CloseFull Screen / Esc
Print Version Interactive Discussion EGU Naccum [1/cm3] 0 500 1000 1500 2000 2500 σσσσ sp [M m -1] 0 20 40 60 80 100 a R2 = 0.60 Nnucl [1/cm3] 0 1000 2000 3000 4000 σσσσ sp [M m -1 ] 0 20 40 60 80 100 b Naitken [1/cm3] 0 1000 2000 3000 4000 5000 σσσσsp [M m -1] 0 20 40 60 80 100 c Ntotal [1/cm3] 0 1000 2000 3000 4000 5000 σσσσsp [M m -1] 0 20 40 60 80 100 d
Fig. 5. Relation between σsp at 550 nm and (a) accumulation mode, (b) aitken mode, (c)
ACPD
5, 11703–11728, 2005 Measurements of optical properties V. Aaltonen et al. Title Page Abstract Introduction Conclusions References Tables Figures J I J I Back CloseFull Screen / Esc
Print Version Interactive Discussion EGU N>200nm [1/cm3] 0 200 400 600 800 1000 σσσσ sp [M m -1] 0 20 40 60 80 100 R2 = 0.85 a N>300nm [1/cm3] 0 50 100 150 200 250 300 σσσσ sp [M m -1] 0 20 40 60 80 100 R2 = 0.93 b N300-400nm [1/cm3] 0 50 100 150 200 σσσσsp [M m -1] 0 20 40 60 80 100 R2 = 0.92 c N>500nm,LPC [1/cm3] 0 5 10 15 20 25 σσσσsp [M m -1] 0 20 40 60 80 100 R2 = 0.71 d
Fig. 6. Relation between σspat 550 nm and concentration of(a) >200 nm particles, (b) >300 nm
particles,(c) 300–400 nm particles measured with DMPS and (d) >500 nm particles measured
with LPC.
ACPD
5, 11703–11728, 2005 Measurements of optical properties V. Aaltonen et al. Title Page Abstract Introduction Conclusions References Tables Figures J I J I Back CloseFull Screen / Esc
Print Version Interactive Discussion EGU
å
-4
-2
0
2
4
6
σσσσ
sp
[M
m
-1
]
0
20
40
60
80
100
ACPD
5, 11703–11728, 2005 Measurements of optical properties V. Aaltonen et al. Title Page Abstract Introduction Conclusions References Tables Figures J I J I Back CloseFull Screen / Esc
Print Version Interactive Discussion
EGU
Fig. 8. Transport paths to Pallas illustrated by cluster mean trajectories, denoted 1–7. Percent
occurrence of trajectories within each cluster as well as the average trajectory lengths in the different clusters are indicated in the figure.
ACPD
5, 11703–11728, 2005 Measurements of optical properties V. Aaltonen et al. Title Page Abstract Introduction Conclusions References Tables Figures J I J I Back CloseFull Screen / Esc
Print Version Interactive Discussion EGU month J F M A M J J A S O N D σσσσ sp [M m -1] 0 10 20 30 cluster 6 cluster 3 month J F M A M J J A S O N D -1 0 1 2 3 4 5 cluster 6 å month J F M A M J J A S O N D -1 0 1 2 3 4 5 cluster 3 å month J F M A M J J A S O N D b 0.0 0.1 0.2 0.3 0.4 cluster 6 month J F M A M J J A S O N D b 0.0 0.1 0.2 0.3 0.4 cluster 3 month J F M A M J J A S O N D σσσσsp [M m -1] 0 10 20 30 cluster 3
Fig. 9. Box whisker diagrams of the monthly variation of σspat 550 nm (top), ˚a (middle) and b at 550 nm (bottom) for clusters 6 and 3. The box has a horizontal line at the lower quartile, median and upper quartile values. The whiskers are lines extending from each end of the box to show the 10th and 90th percentiles. The curve shows the median value of all data, regardless of transport pattern.


![[PDF] Cours Word : Saisie et correction de texte | Télécharger PDF](data:image/gif;base64,R0lGODlhAQABAIAAAP///wAAACH5BAEAAAAALAAAAAABAAEAAAICRAEAOw==)