Development of Interactive and Real-Time
Educational Software for Mechanical Principles
by
Jochen Schlingloff
Submitted to the Department of Civil and Environmental Engineering in
Partial Fulfillment of the Requirements for the Degree of
Master of Engineering in Civil and Environmental Engineering
At the
Massachusetts Institute of Technology
June 2001
© 2001 Jochen Schlingloff
All Rights reserved
The author hereby grants permission to MIT to reproduce and to distribute the paper and
electronic copies of this thesis document in whole and in part.
Signature of author:
Jochen Schlingloff
Department of Civil and Environmental Engineering
May 11, 2001
Certified by:
Kevin Amaratunga
Associate Professor, Department of Civil and Environmental Engineering
Thesis Supervisor
Accepted by:
if
Oral Buyukozturk
BARKER
Chairman, Departmental Committee on Graduate Studies
MASSACHUSETTS INSTITUTE
Development of Interactive and Real-Time
Educational Software for Mechanical Principles
by
Jochen Schlingloff
Submitted to the Department of Civil and Environmental Engineering
on May 11, 2001 in Partial Fulfillment of the
Requirements for the Degree of Master of Engineering in
Civil and Environmental Engineering
Abstract
This document is based on the work that was part of the 'Flagpole project', a research project in the Department of Civil and Environmental Engineering at the Massachusetts Institute of Technology (MIT). Its focus is on the development of interactive and real-time educational software that could be used as a supplementary tool in mechanics education.
In the beginning, the document contains an overview of the Flagpole project and the problem statement that was part of this project, i.e. to develop software that improves the learning experience of students through hands-on studies with cutting-edge teaching tools.
An overview of the Java applets developed during that project is provided as well as an in-depth explanation of one example applet. In addition, one chapter discusses different approaches to the software development cycle.
Finally, the achievements of the Flagpole project and possible future research options are summarized, and the code of the example software that is explained in more detail is appended. Thesis Supervisor: Kevin Amaratunga
Acknowledgements
I would like to thank my advisors, Professor Kevin Amaratunga for his help and guidance
throughout the flagpole project and this thesis, and Professor George Kocur for his advice
throughout the course of this year.
Furthermore, I would like to give my thanks to my fellow students in the Flagpole project and the
Master of Engineering Program, especially the guys who taught me the subtleties of the English
language and never ceased to make fun of me when I was a stupid foreigner. You have been a
very important part of this year for me and I really hope to see you again some day!
I also don't want to forget my friends back in Germany, who showed me that true friendship also
lives over long distances.
But most of all, I want to thank my family and my girlfriend Andrea for their endless love and
support. I am very grateful for all the opportunities you gave me and I will always remember it.
Words cannot express my gratitude, but I hope that my actions will do. Tausend Dank und auf ein
Table of Content
1
Introduction ... 91.1 M otivation...9
1.2 The Flagpole Project... 10
1.3 Problem Statem ent...13
2 Softw are D evelopm ent Process ... 15
2.1 The Softw are D evelopm ent Process ... 15
2.2 Software Process M odels... 17
2.2.1 The Linear Sequential M odel... 17
2.2.2 The Prototyping M odel ... 19
2.2.3 The RAD e ... 20
2.2.4 The Increm ental M odel ... 21
2.2.5 The Spiral M odel... 22
2.2.6 The Form al M ethods M odel... 24
2.2.7 Fourth Generation Techniques ... 25
2.2.8 Extrem e Program m ing ... 26
2.3 Extrem e Program m ing and the Flagpole project ... 30
3 Educational Software in the Flagpole project... 33
3.1 O verview ... 33
3.2 M ohr's Circle...35
3.3 A Single D egree of Freedom System ... 39
3.4 Sim ulation of a Tuned M ass Dam per ... 45
4 A n Exam ple: The Culm ann M ethod... 56
4.1 Explanation of the Culm ann M ethod... 56
4.2 Im plem entation of the Culm ann M ethod in Java code ... 61
4.3 The Java A pplet ... 67
5 Conclusion and O utlook ... 72
6 A ppendix ... 74
Table of Figures
Figure 1-1:The Flagpole Project parts for a decision-support system... 11
Figure 3-1: The Mohr's Circle applet and its results ... 36
Figure 3-2: The help section of the Mohr's Circle applet... 38
Figure 3-3: The Single Degree of Freedom applet... 43
Figure 3-4: The Tuned Mass Damper applet ... 47
Figure 3-5: System Properties w indow ... 48
Figure 3-6: Types of Excitation ... 48
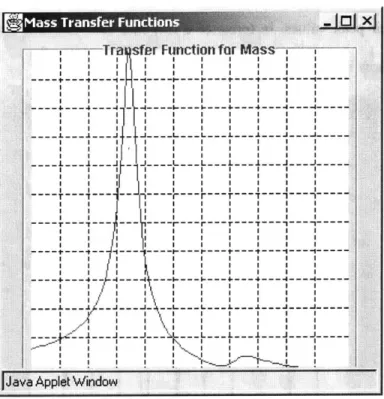
Figure 3-7: Mass Transfer Function... 49
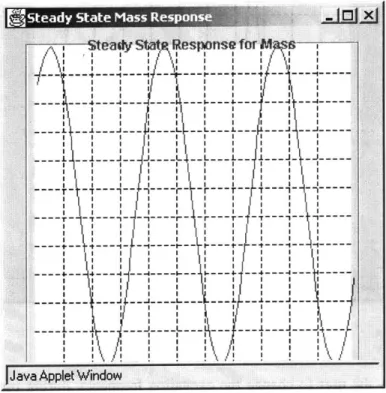
Figure 3-8: Steady State Response window... 50
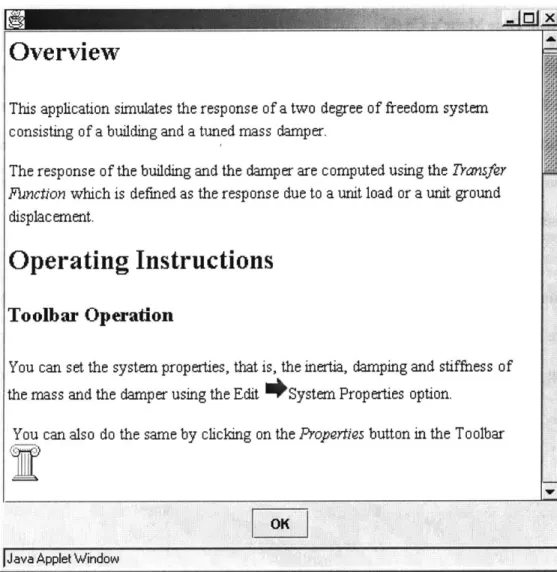
Figure 3-9: Help section of the Tuned Mass Damper applet ... 51
Figure 3-10: Real-Time Mohr's Circle applet ... 53
Figure 3-11: Comparison of real-time and fictitious data...54
Figure 4-1: Example of a statically determinate system...58
Figure 4-2: The Layout Plan of the Culmann Method ... 59
Figure 4-3: The Force Plan of the Culmann Method ... 60
Figure 4-4: Class Diagram of the Culmann applet...62
Figure 4-5: The Culmann Method applet's main screen ... 68
1
Introduction
1.1 Motivation
We are living in a world that is characterized by technological innovations and constantly
increasing amounts of available data. All these data are meaningless by themselves and have to be
gathered, organized, and analyzed in order to become useful information. This can be achieved
with the help of new high-technology products, which are developed faster and faster as their life
cycle becomes shorter and shorter.
These new technologies do not aim to replace more traditional sciences and technologies but
rather to expand their capabilities. Biotechnology offers new ways of medical examination and
treatment. New planes and trains speed up traveling and make it easy to access regions previously
considered inaccessible. The Internet, cellular phones, laptops, organizers and innumerable other
devices facilitate communication and fast transfer of information all around the world.
The impact these developments have had on the profession of civil engineering is enormous.
Sophisticated software and increasing computational capabilities provide the possibility to
calculate and erect very complex structures. A single computer can execute an analysis that
would have a required a month's work from a number of engineers twenty years ago in a few
seconds. But a computer is only a machine that does what it is told to do. Therefore, it is very
important to understand the engineering tasks and problems that are part of the building process
to avoid the infamous 'garbage in - garbage out' result of a computer-supported structural
The basic principles of civil engineering remain unchallenged in their importance and it is the
task of the universities to combine the basic engineering expertise with the knowledge of newly
emerging technologies in a student's education. The universities have to face this challenge to
provide their students with a widened education that prepares them well for today's diverse civil
engineering tasks.
This document is going to explain one of many possible ways to improve education, the
development of software products for educational purposes, in order to prepare today's students
for the tasks of tomorrow.
1.2 The Flagpole Project
The Flagpole project is a research project at the Massachusetts Institute of Technology (MIT). It
was started in the fall semester of the year 2000 as a project for the students in the Master of
Engineering Program in the Department of Civil and Environmental Engineering. The Microsoft
Education Fund sponsors the project.
The Flagpole project team consists of two Master of Science students and eight Master of
Engineering students under the leadership of Professor K. Amaratunga. While the Master of
Engineering students are only able to participate for one year because of the program's duration,
the management by Professor Amaratunga and the involvement of the Master of Science students
The basic goals of the Flagpole project are to create a decision-support system for real-world
structural systems as well as to improve structural education through the use of new technologies.
This document focuses mainly on the educational aspect of the Flagpole project, only a brief
overview of the decision-support system is provided in this chapter. A flagpole on the MIT
campus was chosen as an example structure to develop an initial decision-support system that
ideally would be expandable to larger real-world structures in the future.
The team's effort to create a structural decision-support system that is able to react to changing
external loads and conditions can be divided into three main areas: hardware, software, and
visualization. The figure below shows these three areas and their characteristic parts.
Hardware
Structure SnosData Acquisition
Data Server Web Server Decision Making Database
Visualization
AnlssSoftwareHardware: The hardware section contains all the instrumentation that is necessary to collect and
prepare the data from the flagpole as well as the flagpole structure itself. Although the flagpole
has been replaced with an aluminum prototype to test the hardware equipment until now, the
flagpole itself will be equipped with the sensors in the near future. The goal is to monitor the
loads and the structural reaction through the data coming from the sensors. Different types of
sensors are used to capture the characteristic loads and system responses. An anemometer
measures the wind speed in the environment of the flagpole, the main source of loading in this
particular case. Strain gauges measure the structural strains as an indicator of the systems
behavior. To monitor the dynamic system responses, accelerometers are attached to the structure.
Software: The software section takes care of collecting and storing the data delivered from the
hardware components. It is possible to get the data in real-time as it is coming from the sensors as
well as to retrieve old data from a database. Server software is used to publish this data and to
make it available for further analysis.
Visualization: The raw data coming from the sensors and collected by the software section has to
be edited and visualized in order to become a meaningful analysis of the events at the structure's
location. This is the task of the visualization section. It contains software for a structural analysis
as well as software to analyze and display the collected data in a well-ordered format. The
educational software that this document focuses on is also part of this section of the Flagpole
project. Although the visualization section consists mainly of software, it is separated from the
section called 'software' to stress the fact that it focuses on the data analysis in order to lay the
system behavior but also to influence flexible system parameters, e.g. the damping, in order to
react to changing circumstances.
An overview of the Flagpole project and the software that is the topic of this document can be
found on the Internet under http://flagpole.mit.edu.
1.3 Problem Statement
University education today is based mainly on lectures, assignments, and exams. For some
courses, the material is put on the Internet, but that is not a standard today. The Flagpole project
wants to create a virtual laboratory that could be used in education to provide hands-on
experience for student learning. By giving them the opportunity to apply the theoretical
knowledge gained from lectures and assignments to a real-world system, their preparation for
professional practice would be improved.
Creating educational software poses the question of how people learn most effectively. For this
reason, constant feedback and interaction with the users is an indispensable part of the Flagpole
project to constantly improve the educational software. Therefore, it is one goal to make
professors use our software in their classes in order to build a base of users that could be asked to
provide their comments and proposals after using the software. However, since we did not have
access to a large number of customers that our software is aimed at, we had to try to put ourselves
in the position of a learning student during the initial software development phase.
The educational software of the Flagpole project does not claim to replace the more 'traditional'
Thus a basic familiarity with the corresponding mechanical concepts can be presupposed for our
users. The advantage of using the software instead of doing it by hand is the reduction of
execution time and the opportunity to study a large number of different system settings in a short
period of time. However, the software does not relieve a student of the need to have at least a
basic idea of the underlying mechanical concepts, otherwise the software will not be able to
deepen his understanding.
A distinctive feature of the Flagpole project is the opportunity to study structural behavior
real-time. A lot of existing software deals with archived data or delayed data, but dealing with data in
real time is more difficult to do. As a benefit, dealing with real-time data allows the studying of
dynamic processes as they occur, which makes it more exciting because of the opportunity to
compare what one sees with the expectation one gets from applying the software.
There are numerous possible ways to attack this project. Some of them along with the one that the
2
Software Development Process
2.1 The Software Development Process
The software development process can be defined as a framework for the tasks that are required
to build high-quality software. Like any engineering approach, software development must rest
on a commitment to quality. It is important to go through a series of predictable steps, a road map
that helps to create a timely, high-quality result. Software developers adapt the process to their
needs and then follow it. The key process areas form the basis for control of software projects and
establish the context in which technical methods are applied, work products (models, documents,
data, reports, forms, etc.) are produced, milestones are achieved, quality is ensured, and change is
properly managed. In addition, the people who are going to be the users of the final product play
a role in the development process. It is important to follow a process because it provides stability,
control, and organization to an activity that can become chaotic if it is left uncontrolled.
There are many different approaches to this process. This chapter introduces the most common
software development models and their structures. It outlines their advantages and disadvantages
as well as their appropriateness for certain software projects and the Flagpole project,
respectively.
No matter which model one chooses to follow, it is important to analyze its suitability to the
undertaken project. Software projects always contain a high risk of failing to deliver a product
with high quality in time. The selection of an appropriate development model can help to reduce
an easy task and requires some experience. However, once the project is finished, the quality,
timeliness, and long-term viability of the software product that has been built are going to
indicate the efficacy of the process that one had chosen to use.
Regardless of application area, project size, or complexity, the work associated with software
development can be categorized into three generic phases:
The definition phase focuses on the question what is to be done. During this phase, the software
developer attempts to identify what information is to be processed, what function and
performance are desired, what system behavior can be expected, what interfaces are to be
established, what design constraints exist, and what validation criteria are required to define a
successful system. The key requirements of the system and the software are identified.
The development phase focuses on the question of how it is to be done. During this phase, it has
to be identified how the data are to be structured, how function is to be implemented within a
software architecture, how interfaces are to be characterized, and how testing will be performed.
Finally, the support phase focuses on change associated with error correction, adaptations
required as the software's environment evolves, and changes due to enhancements brought about
by changing customer requirements. This phase reapplies the steps undertaken during the
2.2 Software Process Models
2.2.1 The Linear Sequential Model
Also known as the classic life cycle or the waterfall model, the linear sequential model suggests a
systematic, sequential approach to software development. Modeled after a conventional
engineering cycle and beginning at the system level, it progresses through a series of activities
that are described in the following paragraphs.
System/information engineering and modeling: Software is always part of a larger system.
Therefore, work begins by establishing requirements for all system elements and then allocating
some subset of these requirements to software. This view of software as a part of a larger system
is especially important when software must interact with other system components such as
hardware, people, and databases.
Software requirement analysis: During this phase, the requirements gathering process is
intensified and focused particularly on software. The software developer must get an idea of the
required function, behavior, performance and interface of the software. Requirements for both the
system and the software are documented and reviewed with the customer.
Design: This is actually a multistep process that focuses on four distinct attributes of a program:
data structure, software architecture, interface representation, and procedural detail. Requirements
are translated into a representation of the software that can be assessed for quality before coding
Code generation: The task that has to be performed now is the translation of the design into a
machine-readable form. It is strongly dependent on the quality of the design. If the design has
been performed well in a detailed manner, code generation can be done mechanistically.
Testing: After the code generation, testing begins with a focus on the logical internals and the
functional externals of the software. It is important to ensure that all statements have been tested
to uncover errors and that defined input will produce actual results that agree with required
results.
Support: It is highly likely that software will undergo change after it has been delivered to the
customer. The reasons for that may be encountering of errors, a need of adaptation to
accommodate changes in the external environment (new operating systems, new peripheral
devices, etc.) and customers requiring functional or performance enhancements. Rather than
creating a new program, software support/maintenance reapplies each of the preceding phases to
an existing program.
The linear sequential model is today's most widely used paradigm for software development. It
provides a template into which methods for analysis, design, coding, testing, and support can be
placed. Nevertheless, it also has its downsides. Since real projects rarely follow the sequential
flow that the model proposes, changes can cause confusion as the project team proceeds. This
model has its difficulties with the accommodation of the natural uncertainty that exists at the
beginning of many projects, because it is often difficult for customers to state all requirements
which some team members have to wait for others to fulfill their depending tasks. However, the
linear sequential model has a definite and important place in software development work.
2.2.2 The Prototyping Model
The prototyping model may offer the best approach to developing software if a customer defines
a general set of objectives but does not identify detailed input, processing, or output requirements.
It may also be suitable in cases where developers are unsure about the efficiency of an algorithm,
the adaptability of an operating system, or the form that human-machine interaction should take.
Developers and customers start by defining the overall objectives for the software, identify
whatever requirements are known, and outline areas of the project where further definition will be
necessary. The following 'quick design' emphasizes the representation of those aspects that will
be visible to the user and leads to the construction of a prototype. The customer according to his
objectives evaluates this prototype and both customer and developer use it to refine requirements
for the software to be developed. After that, the prototype is tuned to satisfy the needs of the
customer. If a working prototype is built, the developer attempts to use existing program
fragments or applies tools that enable working programs to be generated quickly. The advantages
of this paradigm are that users get a feel for the actual system very early and that developers have
the opportunity to build something immediately. The question that remains is what to do with the
prototype. Here lies the danger of the prototyping model since customers might be trying to force
the software developers to complete 'a few fixes' to make the prototype a working product after
seeing what appears to be a working version of the software, unaware that in the rush to get it
working no one has considered overall quality or long-term maintainability. The key to success is
as a tool for defining requirements and is then at least partially discarded. Although problems can
occur, prototyping can be an effective paradigm for software development.
2.2.3 The RAD Model
An incremental software development process model that focuses on extremely short
development cycles is the rapid application development (RAD) model. It is a 'high-speed'
adaptation of the linear sequential model and uses component-based construction to achieve rapid
development. The RAD process enables developers to build a working software system within
short time periods, if the project scope is constrained and the requirements are well understood. It
encompasses the following phases:
Business modeling: The initial phase deals with the modeling of the information flow among
business functions. Its goal is to provide answers to the questions of what information drives the
business, what information is generated, who generates it, where does the information go, and
who processes it.
Data modeling: The previously defined information flow is refined into a set of data objects that
are needed to support the business. The attributes of each object are identified and the
relationships between these objects are established.
Process modeling: The data objects are transformed to achieve the information flow necessary to
implement a business function. Additionally, processing descriptions are produced to add,
Application generation: RAD prefers to reuse existing program components (when possible) and
to create new reusable components (when necessary) rather than using conventional
programming languages. It works with automated tools to facilitate the development of software.
Testing and turnover: Overall testing time is reduced because many of the components are reused
and have already been tested. However, it is still necessary to test the new components and all
interfaces.
RAD is an appropriate software development paradigm if it is possible to modularize a business
application in a way that enables each major function to be completed in less than three months.
In this case, separate RAD teams can address each major function and finally integrate them to
form a whole. But RAD has also its disadvantages. First of all, it requires sufficient human
resources to create the RAD teams and a commitment from developers and customers to the
rapid-fire activities necessary for completing a system in an abbreviated time frame. Although it
may be especially tempting to use RAD for projects that involve the heavy use of new technology
in order to go out to the market early, it is not an appropriate paradigm in such cases because
technical risks are too high.
2.2.4 The Incremental Model
The incremental model is part of a larger group of evolutionary software process models, which
emerged from the recognition that software evolves over a period of time, like all complex
systems. Nowadays, a straight path to an end product is often unrealistic, because business and
product requirements frequently change as development proceeds and tight market deadlines
software developers need a paradigm that accounts for the evolution of the product. All
evolutionary models are iterative and enable software developers to produce increasingly more
complete versions of the software over time.
The incremental model offers a combination of the repetitive application of elements known from
the linear sequential model with the iterative approach of prototyping. It delivers software in
increments. Each of these small but usable pieces builds on those that have already been
delivered. The first increment is often a core product that reflects the basic requirements without
delivering supplementary features. After that, a plan for the next increment is developed
according to the results of the customer's use and evaluation of this first increment. This process
is repeated following the delivery of each increment, modifying the core product and adding
additional features and functionality until the complete product is produced.
The advantage of the incremental model is that early increments are stripped down versions of the
final product, which provide capabilities that serve the user and also provide a platform for
evaluation. It is especially useful when a difficult deadline has been established that cannot be
changed, because this model allows the implementation of early increments with fewer people
and the addition of personnel when the project proceeds.
2.2.5 The Spiral Model
The spiral model is another evolutionary software process model that couples the iterative nature
of prototyping with the controlled and systematic aspects of the linear sequential model. It
provides the potential for rapid development due to software building in a series of incremental
A spiral model is divided into three to six framework activities, the so-called 'task regions',
which usually contain customer communication, planning, risk analysis, engineering,
construction and release, and customer evaluation. A task set is associated with each task region,
whose work tasks are adapted to the size and characteristics of the project to be undertaken. As
this evolutionary process begins, the software development team moves around the spiral, starting
at the center. The first circuit around the spiral might result in the development of a product
specification. Subsequent passes around the spiral might be used to develop a prototype and then
progressively more sophisticated versions of the software. Each pass through the planning region
results in adjustments to the project plan. Cost and schedule are adjusted based on feedback
deduced from customer evaluation. The project management also has the opportunity to fit the
planned number of iterations to complete the software.
The spiral model is different from classical process models in the fact that it does not end when
the software is delivered. It can be adapted to apply throughout the whole life cycle of a software
product. This paradigm provides a realistic approach to the development of large-scale software.
Because of the iterative process, the developer and the customer better understand and react to
risks at each evolutionary level. Developers are enabled to apply the prototyping approach at any
desired stage during the evolution of the product. The spiral model should significantly reduce
project risks, if properly applied, because it demands a direct consideration of technical risks at
all stages of the project. Nevertheless, this realistic and thorough process model has its
drawbacks, too. First of all, it may be problematic to convince customers that this approach is
controllable and does not go out of hand. It also demands considerable risk assessment expertise
software development process models and it might take some years until its efficacy can be
determined with certainty.
2.2.6 The Formal Methods Model
The formal methods model encompasses a set of activities that leads to formal mathematical
specifications of software. It applies a rigorous, mathematical notation to specify, develop, and
verify a computer-based system with the support of formal methods.
Using the formal methods model for software development provides a mechanism for eliminating
a number of problems that are difficult to overcome when using other paradigms. Through the
application of mathematical analysis, it is easier to discover and correct ambiguity,
incompleteness, and inconsistency. The formal methods model offers the promise of defect-free
software, yet it is doubtful that it will become a mainstream approach, due to the following
concerns: it is currently quite expensive and time-consuming to develop formal models; a lot of
extensive training is required since not many software developers already have the necessary
background to apply formal methods; finally, it is difficult to communicate with technically
unsophisticated customers using this model.
The formal methods model will likely gain popularity among software developers who must build
safety-critical software, e.g. for aircraft avionics or medical devices, and among those who would
2.2.7 Fourth Generation Techniques
The termfourth generation techniques (4GT) represents a broad array of software tools that have
one thing in common: each of them enables the software developer to specify some
characteristics of the software at a high level. The tool then automatically generates source code
based on the developer's specification. The 4GT paradigm for software development concentrates
on the ability to specify software using specialized language forms or a graphic notation that
describes the problem to be solved in terms that the customer can understand. Usually, most of
the following features are contained in a software development environment that supports the
4GT paradigm: nonprocedural languages for database queries, report generation, data
manipulation, screen interaction, and code generation; high-level graphics capabilities;
spreadsheet capability and automated generation of HTML and similar languages used for
Web-site creation.
The first phase of 4GT is requirements gathering. It is impossible to translate the customer's
description of the requirements directly into a prototype hence the customer/developer dialog
remains a very important part of the 4GT approach. In the next step, larger systems require a
design strategy for the system, while small systems can be done without that. After this phase, the
project moves to implementation using a nonprocedural fourth generation language (4GL) or a
model composed of a network of graphical icons. Automatic code generation is achieved through
the means of implementation using a 4GL that enables the software developer to represent results
in a suitable way. Ultimately, in order to transform a 4GT implementation into a product,
thorough testing has to be conducted, meaningful documentation has to be developed, and all
remaining solution integration activities required in other software development paradigms have
The greatest advantages of 4GT are the reduction of software development time and the improved
productivity of people who build software. On the other hand, one might claim that 4GT tools are
not that much easier to use than programming languages and that the resulting source code
produced by such tools is inefficient.
Today, 4GT environments have been extended to address most software application categories.
However, it is important to remember that even with the use of 4GT, one has to emphasize solid
software development by doing analysis, design, and testing. 4GT are already an important part
of software development and may become the dominant paradigm in the future.
2.2.8 Extreme Programming
Extreme programming (XP) is a new lightweight methodology for small-to-medium sized teams
developing software in the face of vague or rapidly changing requirements. It is called 'extreme'
programming because it takes commonsense principles and traditional practices to extreme levels,
e.g. constant code review, perpetual testing, highest possible level of simplicity, continuous
integration, and shortest feasible iterations. This paradigm challenges many conventional tenets,
including the long-held assumption that the cost of changing a piece of software necessarily rises
dramatically over the course of time.
XP takes an incremental planning approach, which quickly comes up with an overall plan that is
expected to evolve through the life of the project. Short development cycles provide early,
concrete, and continuing feedback. This model relies on automated tests written by programmers
catch defects early. It uses oral communication, tests, and well-documented source code to
communicate system structure and intent. It is furthermore distinguished from other process
models by its ability to flexibly schedule the implementation of functionality, responding to
changing customer needs. The design process that follows this model is supposed to last as long
the system lasts.
The development cycle of XP can be summed up in a few characteristics. First of all, pairs of
programmers program together. The development is driven by tests. The work is not done until
all tests run perfectly. When all tests run and the developers cannot think of any more tests that
might break, they are done adding functionality. Making test cases run is not the only task of the
programming pairs. They are also expected to add value to the analysis, design, and
implementation of the system. The integration of the software immediately follows development,
including the integration testing.
XP acknowledges risk as the basic problem of software development and claims to address these
risks before they are threatening the whole project. The following paragraphs explain the way in
which XP addresses software development risks:
Schedule slips: The scope of any slip is limited from the very beginning, since XP calls for short
release cycles that are not longer than a few months. Within a release, XP uses one- to four-week
iterations of customer-requested features for fine-grained feedback about the project progress.
One- to three-day tasks are planned within an iteration thus enabling developers to solve
problems even during iteration. Finally, XP requires implementing the highest-priority features
Project canceled: The customer is asked to specify the smallest thinkable release that still makes
sense from the business perspective, thereby the number of things that can possibly go wrong is
minimized before going into production.
System goes sour: XP keeps the system in prime condition at all times with the help of a
comprehensive suite of tests, which are run and re-run after every change to ensure a quality
baseline.
Defect rate: The defect rate is reduced via tests that are written both from a programmer's point
of view and from a customer's point of view.
Business misunderstood: XP regards the customer as an integral part of the project. Learning by
the team and by the customer can be reflected in the software, because the specification of the
problem is continuously refined during the development process.
Business changes: XP reduces the amount of change during the development of a single release
due to the shortened release cycle. During a release, the customer is welcome to substitute new
functionality for functionality not yet completed.
False feature rich: This risk is avoided since XP calls only for the implementation of the
Staff turnover: This is often the biggest problem in software development projects, because
programmers drop out due to job dissatisfaction and burnout syndromes. XP encourages human
contact among the team thus reducing the loneliness that is often at the root of job dissatisfaction.
It also asks programmers to accept responsibility for estimating and completing their own work,
gives them feedback about the actual time taken so their estimates can improve, and respects
those estimates. Clear rules for who can make and change estimates are established in order to
avoid the frustration of a programmer when asked to do the obviously impossible. New team
members are encouraged to gradually accept more responsibility, and are assisted along the way
by experienced programmers.
XP allows programmers to work on tasks that really matter every day, since they are responsible
for all aspects of the software. It avoids tempting programmers to make decisions they are not
best qualified to make. On the other hand, it gives them the freedom to make decisions that they
can make best. To customers and managers, XP promises to deliver the highest possible value out
of every programming week. On top of that, they will be able to see concrete progress of the
project every few weeks and they have the opportunity to influence the direction of the project in
the middle of the development process without exorbitant cost increases.
The major disadvantage of XP is that its suitability is limited to relatively small software
development projects. But if appropriate, XP promises to reduce project risk, improve
responsiveness to business changes, improve productivity throughout the life of a system, and add
2.3 Extreme Programming and the Flagpole project
The Flagpole project required software development for a variety of project areas like data
collection, data processing, data compression, data publishing, and, of course, development of
educational software, the area on which this thesis focuses. We did not really make use of a
particular software development process model, due to a number of reasons. Educational software
development in the Flagpole project was more about creating small software products that are
relatively independent of one another than building a single large piece of software. Because of
that, the impact of integration issues was lowered hence reducing project risks and constantly
monitoring the software development process were not as relevant as they are in larger coherent
software projects. Additionally, most of the people that developed the educational software for
the Flagpole project were initially just programming 'greenhorns'. In the beginning, they did not
have much experience with the different software development process models and all associated
activities like requirements gathering, system design, testing, and implementation. Consequently,
it would have been difficult to go with a sophisticated model that is aimed at experienced
software developers. The main goal was to gain programming knowledge and develop relatively
simple yet useful software for educational purposes.
However, extreme programming is as close to a software development process model used for the
educational software in the Flagpole project as it gets. We applied numerous features that are
characteristic of the XP paradigm as described earlier. First of all, we were able to do it because
our task was not to build a large, complex system that requires a lot of manpower and resources,
for which XP is not appropriate. In the beginning, our project team faced vague and eventually
changing requirements, because none of us had ever built educational software before and we did
Master of Engineering Program required. We did not establish an explicit testing strategy before
coding started, but all software was tested several times a day and integration was also frequently
completed. Although we did not work as pairs of programmers sitting in front of and working on
the same screen, there was constant code review by fellow teammates and collaboration took
place during all phases of the software development process. This collaboration was supported by
an open workspace in a computer laboratory at MIT where we did our project work for most of
the time. The computers in this room are set up in an unobstructed way that facilitates
communication between developers, a great help especially when the team structure consists
mainly of inexperienced programmers. This setting helped to bring up fresh ideas for all software
products that could be implemented and tested either immediately or at a suitable point of time.
Since we did not really have customers that could give us feedback and help in refining the
requirements, the teammates also filled up this role for one another. All of us started off with
simple designs that constantly evolved over time as functionality was added and unneeded
complexity was removed. We put minimal systems into production quickly and grew them in
whatever direction seemed to be most valuable for a learning student, our assumed customer. No
team member was forced to become a specialized analyst, architect, programmer, tester, or
integrator - everyone participated in all of these crucial activities almost every day.
Software development in the Flagpole project was distinguished from software development done
by companies in the information technology business by its research-based nature. A definite
distinctive feature was that we did not have to take costs of software development into
consideration, because we were all doing this work as our research project and we did not get
time before the end of the project, but it cannot be compared to a strict deadline that eventually
3
Educational Software in the Flagpole project
3.1 Overview
As mentioned earlier, the development of educational software was one of the main aspects of the
Flagpole project. The goal was to improve several facets of structural engineering education,
from the learning student's understanding of structural engineering concepts over his ability to
use software tools when solving engineering problems to the teacher's understanding of how
students learn most efficiently. I want to especially thank all the group members of the Flagpole
project team who developed these applets and allowed me to use them for this document.
The Flagpole project team decided to use Java applets for the development of the educational
software. There are many reasons for this decision. An applet is a program written in the Java
programming language that can be embedded in an HTML page and thus it can be displayed on
the Internet. It is not necessary for the customer to obtain expensive additional software to be able
to use these applets, because all he needs is a Java plug-in that can be downloaded free of charge.
A page that contains an applet can be viewed using a Java technology-enabled browser. The
applet's code is transferred to the user's system and executed by the browser's Java Virtual
Machine (JVM). This was very important for us because our philosophy is to make our software
available to anyone who is interested in it, anywhere in the world. Java is a widely used and
powerful object-oriented programming language. It provides a great diversity of graphical tools
that have been proven very helpful in the visualization of engineering concepts. In general,
computer users like the simple, click-to-start model of Java applets. IT managers like the
technology speeds up their work and enables solutions that could not be created any other way.
Usually, Java applets run with high reliability and consistency. However, they are subject to
security restrictions of browsers that try to keep them from compromising system security. Any
applet that is loaded over a network cannot load libraries or define native methods, ordinarily read
or write files on the host that is executing it, make network connections except to the host that it
came from, start any program on the executing host, or read certain system properties. On the
other hand, applets do have some capabilities that applications do not have. They can invoke
public methods of other applets on the same page, make network connections to the host they
came from, and, when running within a web browser, cause HTML documents to be displayed.
Moreover, applets that are loaded from the local file system of a computer have none of the
restrictions that applets loaded over the network have.
The educational applets developed for the Flagpole project provide a good opportunity for
students to deepen their knowledge of structural engineering principles gained in lectures or start
learning these principles on their own. They cover several areas of structural engineering, but the
limited scope of the project and the restricted time resources certainly did not allow us to cover
the complete range of this science. All applets developed during the project offer the user the
opportunity to gain hands-on experience about possible abstractions of real-world systems and
about the influence of certain parameters on the results of a structural analysis. The underlying
philosophy is that the student has as much influence on the setup of the structural system as
possible in order to be able to explore the effects of changing parameters on system behavior.
Additionally, on-line help and tutorial sections are provided, which contain the theoretical
background of the concepts. Little initial knowledge is required before starting to use the
This chapter explains the applets about Mohr's circle (tutorial and real-time), a single degree of
freedom system, and a tuned mass damper. The focus is a little bit more on the resulting software
than on the mechanical concept that is portrayed. Yet some information is provided about the
foundational engineering concepts, the implementation of those concepts into software, and
screenshots of the applets that show the working products.
One of the Java applets that have been developed for the Flagpole project, the one about the
Culmann Method, is not part of this chapter, because it is explained in more detail in the next
chapter to illustrate all aspects of the development of educational software in greater depth.
3.2 Mohr's Circle
Mohr's circle is a popular graphical tool that helps to determine the normal stress and shear stress
acting on a plane. Introduced by the German engineer Otto Mohr in 1882, it was the leading
method to visualize maximum stresses before hand-held calculators became available.
The abscissa of the graph where the Mohr's circle is drawn represents the normal stress, and the
ordinate represents the shear stress. The circle is centered at the average stress value and its radius
is equal to the maximum shear stress. The normal stresses are called principal stresses when the
stress element is aligned with the principal directions, i.e. the horizontal axis of the Mohr's
circle's coordinate system. The principal stresses and the maximum shear stress are obtained
immediately after drawing the Mohr's circle, the greatest advantage of this graphical tool. It can
also be used to transform stresses from any desired coordinate set to another, or to illustrate
stress state at a point, it is sufficient to know the normal and shear stresses acting on two
perpendicular planes at that point. Initially, these given values of stress are plotted as two pairs of
coordinates of (normal stress, shear stress). A line is drawn to connect the two points in the
following step. The midpoint of this line is located on the x-axis and it is the center of the
corresponding Mohr's circle. Finally, the Mohr's circle is drawn, and principal stresses can be
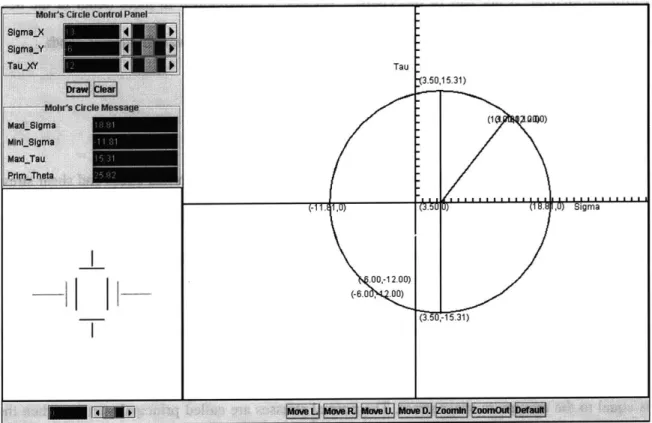
taken from the circle as well as maximum shear stresses. The applet about Mohr's circle follows
these steps, except that it uses transformation equations to calculate the characteristic points of
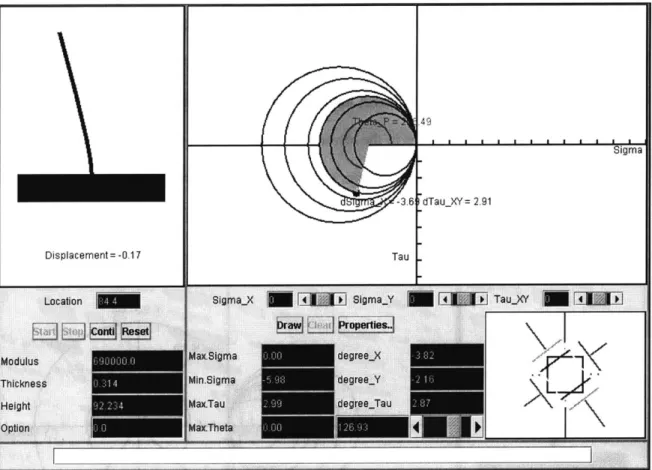
the circle from the given values. The following screenshot shows the output of that applet:
Tau
I ~ ~
I-(-11. lU) U) ~i ~ I U) uigma .ao,-12.00) (-6.0 .00) -(3.50,15.31) (3.5, -15.31)Figure 3-1: The Mohr's Circle applet and its results
When the user starts the program, he enters values for the normal stresses ,, and (TY as well as for
the shear stress t,,y, all of them referring to the initial coordinate system of x and y. When he prompts the applet to draw the circle, the circle is displayed. The principal stresses a, and a2, the
maximum shear stress max and the angle Op, which indicates the rotational difference between the
initial axes and the principal axes, are calculated and displayed on the screen. The user can
determine the stress values for any rotated coordinate system by using the tool on the lower
left-hand corner of the screenshot to dynamically change the rotation angle. The angle and the
corresponding stress values are immediately shown as part of the Mohr's circle and the changing
size of these stresses can be observed in the lower left-hand part of the screen. The applet allows
the user to select the drawing properties he is interested in. He can choose to display the pole
position, multiple circles for multiple points or stress states in one coordinate system, or he can
decide whether he wants to see the characteristic numbers of the Mohr's circle on the screen or
not. In case the resulting Mohr's circle is too small, too big, or too far off on one side of the
screen, the applet provides options to zoom in, zoom out, and move the Mohr's circle to any
desired direction.
People who are not familiar with the concept of Mohr's circle may be able to use this program by
punching in random numbers, but they will not be capable of making sense of the results.
Therefore, this applet offers a help section that gives background information about the origin and
intention of Mohr's circle and explains its methodology. But since the educational software in the
Flagpole project has been developed with focus on university students, a basic understanding of
engineering concepts has been assumed. A beginner may not be able to use this program as a
starting point, but, going back to our intentions mentioned earlier in this chapter, our goal was to
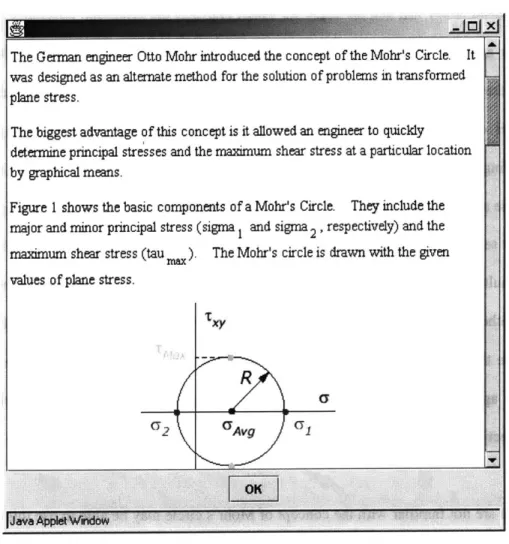
create tools that support learning from lectures and do not replace it. The following screenshots
The German engineer Otto Mohr introduced the concept of the Mohr's Circle. It was designed as an alternate method for the solution o f problems in transformed plane stress.
The biggest advantage of this concept is it allowed an engineer to quickly determine principal stresses and the maximum shear stress at a particular location
by graphical means.
Figure 1 shows the basic components of a Mohr's Circle. They include the major and minor principal stress (sigma 1 and sigma 2 , respectively) and the maximum shear stress (tau ). The Mohr's circle is drawn with the given values of plane stress.
R
(72 CyAvg (1
Figure 3-2: The help section of the Mohr's Circle applet
Although one might argue that learning a tool like Mohr's circle is done most effectively by
drawing every step by hand, thus thoughtfully following the process, this applet provides the
opportunity to change parameters interactively and study several stress states, an activity that
would otherwise take a lot of time or it would not be done at all.
A drawback of the Mohr's circle approach is that the exactness of the results is lower when drawn
by hand than when calculating the stresses. Nevertheless, Mohr's circle is a valuable and vivid
engineering tool. It is worth mentioning that this applet is already used as a teaching tool in an
3.3 A Single Degree of Freedom System
A single degree of freedom system (SDOF) with free vibrations (no external forces) is the most
basic system for a dynamic structural analysis. It restricts possible movements to just one
direction and abstracts the actually evenly distributed mass of the structure to a single lumped
mass. Naturally, these simplifications limit the applicability of this analytical method to relatively
unsophisticated systems. But that is not a big problem since our abstractions are on the safe side
and the great reduction of work absolutely justifies these simplifications. Concluding, we can say
that for a restrained cantilever, which is the common system used in the Flagpole project, this is a
valid method.
For an unforced damped SDOF system, the general equation of motion, which describes the
system state, is given by,
mX +
cvi
+ kx = 0where m stands for the mass, X for the acceleration of the mass, c, is the viscous damping
variable, i is the velocity of the mass, k represents a spring stiffness, and x indicates the
displacement of the mass. The goal is to solve this equation in order to forecast the displacement
of the mass at any point in time, if the initial conditions and the system properties are known. The
initial displacement is defined as x(t = 0) = x0 and the initial velocity is described as
x(t = 0) = vo. This equation of motion is a second order, homogeneous, ordinary differential
equation (ODE). We assume that all parameters (mass, spring, stiffness, and viscous damping)
are constant, which turns the equation of motion into a linear ODE with constant coefficients. It
can then be solved by the Characteristic Equation method. The characteristic equation is,
which determines the two independent roots for the damped vibration problem. The roots to the
characteristic equation fall into one of the three following cases:
1. If cvj - 4mk < 0 , the system is termed underdamped. The roots of the characteristic
equation are complex conjugates, corresponding to oscillatory motion with an
exponential decay in amplitude.
2. If c ,2
- 4mk = 0, the system is termed critically-damped. The roots of the characteristic
equation are repeated, corresponding to simple decaying motion with at most one
overshoot of the system's resting position.
3. If c V - 4mk > 0, the system is termed overdamped. The roots of the characteristic
equation are purely real and distinct, corresponding to simple exponentially decaying
motion.
The Java applet about the single degree of freedom system only deals with underdamped systems,
because this is the most common and meaningful case.
To simplify the solutions coming up, we define the critical damping cc , the damping ratio ,
and the damped vibration frequency O0
d as,
cC = 2m - = 2mn
m
cc
w0h i give( by where the natural frequency of the system con is given by,
n=
k
( <1 or cv < cc are representative of an underdamped system, as mentioned earlier the only
case implemented in our software. The resulting displacement solution for this kind of system is,
x(t) =
e
xO cos(a.Ot) + vO + Onx sin(9dt)Cod I
This is the algorithm that has been used in the applet's code to produce the displayed results.
Having described the theoretical background of a single degree of freedom system, the following
paragraphs will discuss its implementation into a piece of software, its difficulties, peculiarities,
and its usefulness.
After uploading it from the Flagpole website, the Java applet about the single degree of freedom
system allows the user to choose one of the most frequently used cross sections: a rectangle, a
circle, or an I-section. Regardless of the cross section type, the user has to enter the length, the
weight, and the damping ratio of the structure. He has to be careful when entering the value for
the damping ratio, because it is entered as a percentage, which means that the damping ratio
C
= -v- has to be multiplied by one hundred in order to get meaningful results from the program.
Cc
The reason for that lies in the common habit of specifying the damping ratio as a percentage.
Additionally, the user can provide values for the initial conditions, displacement and velocity at
time zero at the top of the system. Depending on the type of cross section that is selected, the user
can input the additional cross section's properties. For a rectangle, width and height are required.
A circular cross section asks only for a radius. The width and thickness of the flange and the
velocity are set to zero, nothing will happen, because that is no longer a dynamic problem. There
is no option to enter a force directly on the structure, but it is possible to transform a force at any
place of the structure to a displacement at the top with a basic structural calculation that has to be
conducted by hand. Usually, the weight of the structure has to be calculated by hand, too, due to
the fact that in most cases the length of the structure and the density of the material are given.
However, it is important to remember that this applet does not handle the vibration of a single
degree of freedom system under a general forcing function
f(t),
which makes solving theequation of motion more complex and requires the use of either a convolution integral or a
Laplace transform.
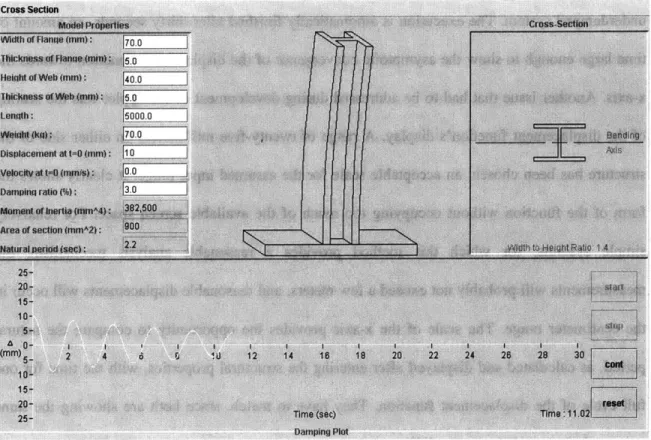
The following screenshot shows the interface of the applet with the produced output after the
Figure 3-3: The Single Degree of Freedom applet
The applet keeps all inputs and results conveniently visible all the time. As you can see, the
execution can be stopped, continued, and reset at any point of time. The applet calculates and
displays the moment of inertia, the area of the cross section, and the natural period of the
structure from the provided input. In addition, the width-to-height ratio is computed, but only for
a rectangle and an I-section. When the user hits the start button, the applet starts to show the
moving cantilever, and, simultaneously, the development of the displacement function, labeled as
A, in the lower part of the screen. Underlying is the solution of the equation of motion, executed
by the program according to the procedure described above. The spring stiffness is calculated
depending on the system's length, the cross section's moment of inertia, and the material's
modulus of elasticity, for which the value is predefined in the applet's Java code. The display