HAL Id: hal-01274197
https://hal-mines-paristech.archives-ouvertes.fr/hal-01274197
Submitted on 18 Feb 2016HAL is a multi-disciplinary open access
archive for the deposit and dissemination of sci-entific research documents, whether they are pub-lished or not. The documents may come from teaching and research institutions in France or abroad, or from public or private research centers.
L’archive ouverte pluridisciplinaire HAL, est destinée au dépôt et à la diffusion de documents scientifiques de niveau recherche, publiés ou non, émanant des établissements d’enseignement et de recherche français ou étrangers, des laboratoires publics ou privés.
Pending the adoption of an international climate
agreement An overview of the energy-climate regime
Sandrine Selosse, Nadia Maïzi
To cite this version:
Sandrine Selosse, Nadia Maïzi. Pending the adoption of an international climate agreement An overview of the energy-climate regime. [Research Report] Working Paper 2015-02-16, Chaire Mod-élisation prospective au service du développement durable. 2015, pp.21 - Les Cahiers de la Chaire. �hal-01274197�
Les Cahiers de la Chaire
Chair
e Modé
lisa
tion pr
ospectiv
e au se
rvice du dé
veloppe
me
nt dur
able
Pending the adoption of an
international climate agreement
An overview of the energy-climate regime
Sandrine Selosse and Nadia Maïzi
MINES ParisTech - CMA
PENDING THE ADOPTION OF AN INTERNATIONAL CLIMATE AGREEMENT.
AN OVERVIEW OF THE ENERGY-CLIMATE REGIME
Sandrine SELOSSE
1and Nadia MAÏZI
MINES ParisTech, PSL Research University, CMA - Centre for applied mathematics,
CS 10207 rue Claude Daunesse 06904 Sophia Antipolis Cedex, France
Abstract
After a large awareness and decades of negotiations, a historic climate agreement is waiting to be adopted by all 195 parties at the UNFCCC, in December during the 2015 Paris Climate Change Conference (COP 21), in order to provide an answer to the climate issue. The ambition of this agreement is to support countries in a new world, a decarbonized world. Tackling the problem of global climate change indeed requires a high level of international cooperation. The challenge is therefore once again to get countries to converge towards a global, multilateral agreement to keep their sights on the ambitious targets to limit GHG emissions. While the deadline for the implementation of this agreement is imminent, we propose to discuss the key points of these ambitious objectives for 2015 and provide a framework for understanding the future climate regime that has to be decided. Using a long-term prospective approach, and more precisely the bottom-up optimization model TIAM-FR, we investigated various scenarios including environmental targets on different world regions over the period 2000-2050. We analyze a combination of these scenarios to discuss what would happen if, for example, developing countries do not contribute to reducing GHG emissions, or if the objectives that industrialized and emerging countries have committed to are not ambitious enough, etc. Our analysis of the scenario results then focuses on the effects on the level of GHG emissions and the carbon abatement costs associated with the different GHG reduction targets for regions (developed, fast developing or developing countries). We end with a discussion of the technological solutions to climate issues to assess the plausibility of the challenges.
Keywords: Global energy system, GHG mitigation targets, long-term modeling, TIAM-FR,
International agreements
JEL codes: O21, Q29, Q4, Q54, Q58 Acknowledgements
This research was supported by the Chair Modeling for sustainable development, driven by MINES ParisTech, Ecole des Ponts ParisTech, and AgroParisTech, supported by ADEME, EDF, GRTgaz, SCHNEIDER ELECTRIC and the French Ministry of Ecology, Sustainable Development and Energy
1.
Introduction
After a large awareness and decades of negotiations, a historic climate agreement is waiting to be adopted by all 195 parties at the UNFCCC, in December during the 2015 Paris Climate Change Conference (COP 21), in order to provide an answer to the climate issue. The ambition of this agreement is to support countries in a new world, a decarbonized world. The conclusion of scientists is unanimous; the atmosphere of our planet is warming because of the too high level of anthropic greenhouse gas emissions (IPCC, AR4 and AR5). Tackling the problem of global climate change indeed requires a high level of international cooperation. The challenge is therefore once again to get countries to converge towards a global, multilateral agreement to keep their sights on the ambitious targets to limit GHG emissions. Preventing global warming requires a drastic reduction in total greenhouse gas emissions; however, in the absence of an international agreement on emissions control, countries have less incentive to put in place strong measures to reduce emissions. The Kyoto Protocol was the first international agreement in which some countries (Annex I to the protocol) committed to emission reduction targets over the period 2008-2012. The protocol’s impact has however been limited, because of a lack of commitments from rapidly growing emerging countries such as China and India, and non-ratification by the United States. The challenge of the Copenhagen summit in 2009 was to determine the rules for the post-Kyoto period. It was therefore essential to ensure the ratification of a global agreement on emission reduction targets and to include all major industrialized and emerging countries. Although negotiations during the summit failed to reach a global agreement, in late January 2010 some countries including major emerging nations pledged their commitment to the United Nations Framework Convention on Climate Change (UNFCCC) as part of the Copenhagen Agreement. Emissions control commitments now cover 80% of 2005 global GHG emissions. These pledges occur until 2020 and constitute period 2 of the Kyoto Protocol (2013-2020). The challenge now is to get countries to converge towards a global and multilateral agreement to keep in line with ambitious targets to limit GHG emissions. This is the ultimate aim of the Conference of Parties due to take place in Paris in 2015. For this purpose; many countries have submitted and published their preliminary contributions to reduce GHG emissions, under the
Intended Nationally Determined Contributions mechanism (INDCs), and notably, the three largest
CO2 emitters, representing nearly 54% of global emissions, submitted their contribution: by order of issue, China, USA, Europe (a single contribution for the 28 Member States). China has declared to peak their emissions by 2030. Regarding the USA, they have declared to contributing with 26-28% reduction by 2025 compared to 2005, and the European Union with at least 40% reduction by 2030 compared to 1990. While the deadline for the implementation of this agreement is imminent, we propose to discuss the key points to reach ambitious objectives by 2015. The aim of this study is to analyze different paths of CO2 emission mitigation targets and to discuss the future climate regime
with the modeling tool TIAM-FR. More precisely, we investigate different coordination schemes for regions pledging to reach CO2 mitigation targets in line with 1) commitments occurring according to
the Copenhagen Agreement by 2020, 2) an ambitious ultimate and global target by 2050 in line with the UNFCCC ultimate objective (limiting the global increase in temperature to 2°C) and the IPCC recommendations (AR4 and AR5), and 3) regional assumptions by 2050 according to the group of countries (industrialized, fast developing or developing). Our analysis mainly focuses on the effects of these environmental constraints on global and regional CO2 emissions and the evolution of the
variety of climate policies and finally discusses the impact of the development of technologies in the energy mix in 2050.
2.
The climate regime inherited from the past negotiations
2.1. The political climate regime
First of all, it is worth taking a look at the post-COP 15 targets. In late January 2010, at the end of the fifteenth Conference of the Parties, some countries pledged their commitment to the United Nations Framework Convention on Climate Change as part of the Copenhagen Agreement to mitigate CO2
emissions in line with various targets. Although this international agreement did not meet up to expectations, it laid the first foundations of the post-Kyoto global fight against climate change, which was not an easy task. Over recent years, the climate change debate has not only seen increased scientific evidence published in the fourth and fifth IPCC assessment reports, but also a number of major political events: the approval of the EU climate package by the EU parliament in December 2008, a shift in the US, with greener positions expressed by the new administration, and the high participation of developed and developing countries at the Copenhagen Climate Change Conference (COP 15), in December 2009 and since that date. The international agreement made at COP 15 was to be the last step in the two-year negotiation process determined at the 2007 Bali conference. The Kyoto Protocol was signed ten years earlier in 1997 and aimed to address climate change, and more precisely a 5% reduction in GHG emissions over the period 2008-2012 for the industrialized countries included in Annex I. For the post-Kyoto period, i.e. beyond 2012, no international agreement had been planned, and this was the aim of COP 15. In the event of a failure in negotiations at Copenhagen, no process would be in place. It was therefore essential to ensure the signing of a global agreement at the Copenhagen conference, including all major industrialized countries (and primarily the United States, which had not ratified the Kyoto Protocol), and for the first time, the fastest developing countries whose economic activities and demographic prospects constitute real challenges for the coming decades. This was a major issue for 2009, both for Europe and for all other countries that are resolutely committed to fighting climate change. For the long term, a noticeable convergence existed between the views expressed by the European Union and the Obama-Biden new energy plan for America. However, the deal on medium-term targets was far from sealed. On the one hand, the European Union pledged to reduce its carbon dioxide (CO2) emissions by 20%
compared to its 1990s level by 2020, and was prepared to commit to additional efforts ratified by international agreements. This would involve a 30% reduction in emissions by 2020. On the other hand, the current medium-term target for the USA was a 17% reduction on 2005 levels by 2020. While this represents a significant step, it roughly leads to a mere stabilization at 1990 levels by 2020. At the same time, the USA also stressed a need for mitigation efforts from fast-growing transition countries such as China and India. A crucial factor to finding global agreement in 2009 was whether industrialized countries would keep their promises of aiding developing countries so that they could adapt to the impacts of climate change. After many years of discussion, the Poznan conference in December 2008 finally allowed a better utilization of funds allocated to adaptation. Although still highly inadequate, consensus concerning their utilization had proved difficult to reach. This commitment had to be confirmed in 2009 to provide tools and resources for meeting arising challenges. Without these, developing countries, which are vulnerable and highly affected by the climate change, would not commit to reducing their own GHG emissions. It was imperative that such
mitigation policies be promptly considered by these countries, primarily China and India, which will represent a majority share of global emissions in the near future. For example, in 2008 China surpassed Germany in terms of economic wealth, and the United States in terms of CO2 emissions.
Naturally, such positions left ample room for negotiations and one rule of the Copenhagen game was: what involvement is acceptable from others to define our own commitment level? The European Union was thus waiting for signs from other developed countries and in particular the US, who were in turn waiting for positive signs from China.
What is at stake now and for the future? Even though negotiations during COP 15 failed to reach a global agreement on post-Kyoto greenhouse gas emission reductions, the stakes are no less crucial and the pledges announced at the beginning of 2010 consolidate this position. Now commitments for CO2 emissions mitigation pledged by lots of countries, developed and developing countries, and
covers 80% of 2005 global emissions. The major question is to determine what will happen after 2020. Decisions adopted at the Durban Conference, in 2011, highlight the emergency character of the situation and emphasize the need to radically increase the level of ambition of pledges beyond 2020 to cut GHG emissions in order to achieve the objective of limiting the increase global temperature to 2°C. Indeed, this agreement will aim to increase the overall effort to the extent that existing commitments will not allow containing the rise in temperature below 2°C. UN climate negotiations therefore continue in order to lead to the signing in 2015 of a new international framework from 2020 with commitments for all countries to better combat global warming. The principle of common but differentiated responsibilities played a major role in negotiating the post-2012 and will remain in structuring the post-2020 negotiations. However, an ambitious emission mitigation objective appears not to be realistically achieved without the contribution of developing countries, especially from the viewpoint of technological challenges. Considering the pledged targets by countries or regions under the framework of the Conferences of Parties, three groups of countries can be distinguished according to the level of their commitments2:
• The "industrialized countries" (IC), who are committed to absolute emission reduction targets (Europe, USA, etc.).
• The "fast-growing countries" (FDC), who are committed to relative targets (e.g. in relation to their level of growth as China and India).
• The "developing countries" (DC), which for some implement national actions, others support the establishment of a future agreement but do not initiate action, and generally are not committed not a target of mitigation, such as Africa, for example (excluded South Africa). Setting out from this premise, we analyze the environmental and economic impacts of long-term climate commitments by introducing climate pledges in the bottom-up optimization model TIAM-FR.
2 More precisely, considering the political ambitions of the parties, five groups of countries could be
distinguished : 1) Absolute commitments (industrialized countries: past, present and future responsibles for the high level of CO2 atmospheric concentration); 2) Relative commitments (generally fast developing countries: present and future responsibles); 3) Political actions and support to a global agreement (developing countries: essentially future responsibles); 4) Support without action (61 countries, essentially least advanced and supporting the highest climate change consequences); 5) No association or no communication (51 countries, a majority of oil-producing countries).
2.2. Scenarios for the future decarbonated regime
2.2.1. Modeling approach: The TIMES Integrated Assessment Model
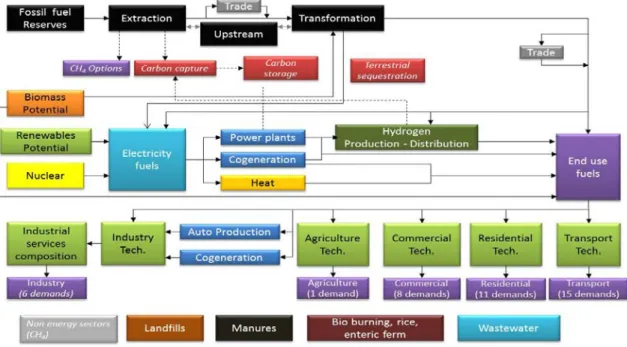
TIAM-FR is the French version of the TIMES Integrated Assessment Model, the global multiregional model from the TIMES family models developed by the Energy Technology Systems Analysis Program (ETSAP), under the aegis of the International Energy Agency (IEA). This linear programming model estimates an inter-temporal partial economic equilibrium on energy markets and, in other words, minimizes the total discounted cost of the world energy system over a long time period under environmental, technological and demand constraints. The model assumes perfect markets and unlimited foresight for the calculation period, the described economic sectors, and commodities. Cost of the energy system includes investment costs, operation and maintenance costs, costs of imported fuels, incomes of exported fuels, and the residual value of technologies at the end of the horizon. TIAM-FR aims to supply energy services at minimum global cost by simultaneously making decisions on equipment investment, equipment operation, primary energy supply, and energy trade. End-use demands (i.e. energy services) are based on socio-economic assumptions and on external projections of the growth of regional GDP as well as population and volume of various economic sectors (transport, residential, industry, etc.) over the planning horizon. These drivers and IEA statistics for a given base year, in this case 2005, are the basis for future projections of the consumption of different energy such as road passenger transportation, steel demand or residential heating. In order to satisfy the energy services demands, the system includes the extraction, transformation, distribution, end-uses, and trade of various energy forms and materials. Indeed, TIAM-FR is a technology-rich, bottom-up model which depicts the energy system with a detailed description of different energy forms, resources, processing technologies and end-uses, on a Reference Energy System (RES). Each economic sector is described by means of technologies, each characterized by its economic and technological parameters (Loulou and Labriet, 2008). Figure 1 gives a concise description of the RES covering the whole energy chain.
The main outputs of the model are future investments and activities of technologies for each time period. Furthermore, the structure of the energy system is given as an output, i.e. type and capacity of the energy technologies, energy consumption by fuel, emissions, energy trade flows between regions, transport capacities, a detailed energy system costs, and marginal costs of environmental measures as GHG reduction targets. The model calculates CO2, CH4, and N2O emissions from fuel
combustion and processes and integrates a climate module which allows calculating or constraining atmospheric GHG concentration, radiative forcing and temperature changes. Emission reduction is brought about by technology and fuel substitutions (leading to efficiency improvements and process changes in all sectors), carbon sequestration (including CO2 capture at the power plant and hydrogen
plant level, sequestration by forests, and storage in oil/gas fields, oceans, aquifers, etc.). An additional output of the model is the implicit price, or opportunity cost (shadow price), of each energy form, material and emission. TIAM-FR is geographically integrated and offers a representation of the world energy system under a disaggregation in 15 regions : Africa (AFR), Australia-New Zealand (AUS), Canada (CAN), China (includes Hong Kong, excludes Chinese Taipei; CHI), Central and South America (CSA), Eastern Europe (EEU), Former Soviet Union (includes the Baltic states, FSU), India (IND), Japan (JPN), Mexico (MEX), Middle-East (includes Turkey; MEA), Other Developing Asia (includes Chinese Taipei and Pacific Islands; ODA), South Korea (SKO), United States of America (USA) and Western Europe (EU-15, Iceland, Malta, Norway and Switzerland; WEU). In each region, TIAM-FR describes the entire energy system with the same level of technological disaggregation. The regions are linked by energy and material trades. Some results are discussed considering 3 groups of countries: Industrialized, Fast developing countries and developing countries. To analyze possible alternative development paths of the system and discuss the future climate regime, we investigated a variety of environmental target scenarios on different regions of the world over the period 2005-2050.
2.2.2. Scenario for an international climate cooperation
We considered the Post-Copenhagen pledges for 2020 and made assumptions on the 2050 targets based on each country’s announced political ambitions, expected ambitions or required contributions. We then compared these pledges to a global scenario compatible with the UNFCCC ultimate objective of limiting temperature change to 2°C, where all countries are constrained or not to contribute to this global mitigation target. The various scenarios we investigated include environmental targets for different world regions over the period 2005-2050. We analyze a combination of these scenarios in order to provide a framework for understanding the climate context of the future regime which is expected to be decided in 2015:
(1) UNFCCC: World climate scenario in line with limiting temperature change to 2°C in 2100, i.e. a 50% reduction of the world CO2 emissions by 2050 by comparison with 2000 (IPCC, AR4)
(2) Regional Post-Copenhagen pledges scenario by 2020 (Figure 2):
a. COP+: with the higher CO2 emission reduction targets by 2020 for countries that pledged
commitments in the Copenhagen Accord, without any CO2 emission reduction commitments
b. COP-: with the lower CO2 emission reduction targets by 2020 for countries that pledged
commitments in the Copenhagen Accord, without any CO2 emission reduction commitments
for developing countries.
c. COP+DEV30: with the higher CO2 emission reduction targets by 2020 for countries that
pledged commitments in the Copenhagen Accord, with a CO2 emission reduction
commitment of 30% to 2020 compared to a business as usual scenario for developing countries.
d. COP-DEV15: with the lower CO2 emission reduction targets by 2020 for countries that
pledged commitments in the Copenhagen Accord, with a CO2 emission reduction
commitment of 15% to 2020 compared to a business as usual scenario for developing countries.
Country or Area Region TIAM Reduction by 2020 Reference Year Reduction type
Australia AUS 5 to 25% 2000
Emissions reduction
Canada* CAN 17% 2005
European Union WEU-EEU 20 to 30% 1990
Japan JPN 25% 1990
United States* USA 17% 2005 China CHI 40 to 45% 2005
Carbon intensity India IND 20 to 25% 2005
Russian Federation FSU 15 to 25% 1990
Emissions reduction
Mexico MEX 30% BAU
South Korea SKO 30% BAU Brazil CSA 36,1 to 38,9% BAU
* Intermediate targets are also introduced for the USA and Canada regarding their pledges to UNFCCC: 30% for 2025 and 42% for 2030
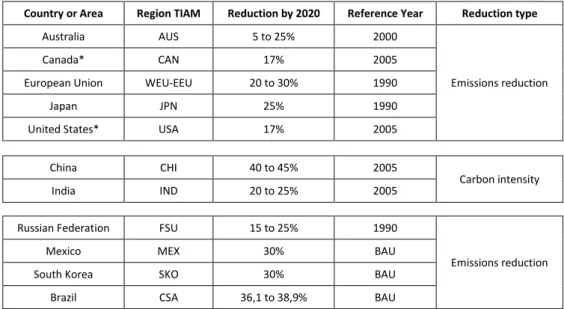
Figure 2: Post COP 15 commitments by 2020 implemented in TIAM-FR
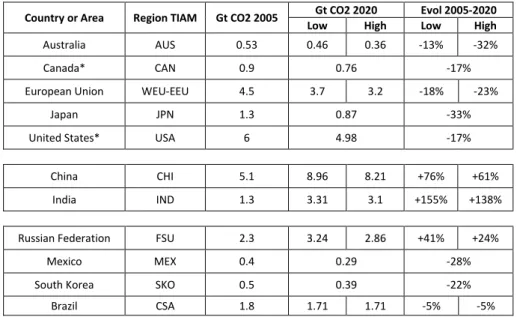
More precisely, what does it mean in terms of level of emissions? What happens if we translate these pledges to the same reference year (2005) and follow the same type of reduction, i.e. emission mitigation? The figure 3 highlights the CO2 emissions’ level that the regions undertake not exceed
(high or low) and the evolution from 2005 to 2020 that these pledges involve. The European Union, which before COP 15 was alone in committing to a Post-Kyoto international agreement, had pledged a 20% reduction in CO2 emissions by 2020 compared to 1990 levels, and was prepared to commit to
additional efforts in case of international agreements, i.e. to increase its pledge from 20% to 30%. These commitments represent a reduction by respectively 18 and 29% by 2020 compared to 2005, against 17% if we compare with the United States of America. Note the important target of Japan who should experience difficulties to achieve, considering the fact that Japan previously left the Kyoto Protocol. Another point concerns the commitment of fast growing transition countries and particularly China and India. Concretely, in terms of level of CO2 emission mitigation target, in the
case of China, by reducing carbon intensity by 40% by 2020 compared to 2005 is equivalent to limiting the increase of its CO2 emissions by 76% in 2020 compared to 2005. This is immediately clear
that we are not in the same context of commitment, whether for political, economic or technological reasons. For the high scenario, in which China pledges to reduce its carbon intensity by 45% by 2020 compared to 2005 levels, this is equal to limiting the increase of its CO2 emissions to 61% in 2020
compared to 2005 levels. Therefore, this is due to wide variations in GDP projections. Finally, note the important reduction that Mexican and South Korean commitments (based on business as usual level) represents, i.e. 28% and 22% of reduction respectively in 2020 by comparison with 2005. In a more global context, these commitments represent at the end a CO2 mitigation of 19% (low targets) and 23% (high targets) in 2020 by comparison with 2005 as regards industrialized countries and a limited increase of the CO2 emission level by 57% (low case) 45% (high case) between 2005 and 2020 for fast developing and developing countries. Globally, this represents a limited increase of the world CO2 emission level by 16% (low) and 9% (hight) between 2005 and 2020.
Country or Area Region TIAM Gt CO2 2005 Low Gt CO2 2020 High Evol 2005-2020 Low High
Australia AUS 0.53 0.46 0.36 -13% -32%
Canada* CAN 0.9 0.76 -17%
European Union WEU-EEU 4.5 3.7 3.2 -18% -23%
Japan JPN 1.3 0.87 -33%
United States* USA 6 4.98 -17% China CHI 5.1 8.96 8.21 +76% +61%
India IND 1.3 3.31 3.1 +155% +138% Russian Federation FSU 2.3 3.24 2.86 +41% +24%
Mexico MEX 0.4 0.29 -28%
South Korea SKO 0.5 0.39 -22% Brazil CSA 1.8 1.71 1.71 -5% -5%
Figure 3: Targeted level of emissions by 2020 implemented in Post COP 15 scenarios
(3) Regional long-term objectives scenario by 2050: according to international convergence and expressed ambitions:
a. IND80: with a pessimistic CO2 emission reduction commitment to 2050 for industrialized
countries, i.e. a 80% reduction of their CO2 emissions by 2050 by comparison with 2000,
without any CO2 emission reduction commitment for developing countries and fast
developing countries.
b. IND95: with an optimistic GHG emission reduction commitment to 2050 for industrialized countries, i.e. a 95% reduction of their CO2 emissions by 2050 by comparison with 2000,
without any CO2 emission reduction commitment for developing countries and fast
developing countries.
c. IND/FDC80: with a pessimistic CO2 emission reduction commitment to 2050 for
industrialized countries and fast developing countries, i.e. a 80% reduction of their CO2
emissions by 2050 by comparison with 2000, without any CO2 emission reduction
d. IND/FDC95: with an optimistic GHG emission reduction commitment to 2050 for industrialized countries and fast developing countries, i.e. a 95% reduction of their CO2
emissions by 2050 by comparison with 2000, without any CO2 emission reduction
commitment for developing countries.
c. IND/FDC80-DEV15: with a pessimistic CO2 emission reduction commitment to 2050 for
industrialized countries and fast developing countries, i.e. a 80% reduction of their CO2
emissions by 2050 by comparison with 2000, with a CO2 emission reduction commitment of
15% to 2050 compared to a business as usual scenario for developing countries.
d. IND/FDC95-DEV30: with an optimistic GHG emission reduction commitment to 2050 for industrialized countries and fast developing countries, i.e. a 95% reduction of their CO2
emissions by 2050 by comparison with 2000, with a CO2 emission reduction commitment of
30% to 2050 compared to a business as usual scenario for developing countries.
Drawing from these regional scenarios of carbon constraints, we discuss possible futures for the next climate regime according to the rule of “What might happen if…?” e.g.: Can we reach the 2°C target if developing countries do not contribute to reducing GHG emissions in the future? What could happen if developed countries do not contribute enough to reducing CO2 emissions in the future? What are
the induced regional energy systems of these climate scenarios if fast developing countries do not contribute early to reducing CO2 emissions in the future? and so on.
3.
What about the future energy-climate regime beyond 2020?
3.1. Is the future climate regime in line with the 2°C objective and the principles of equity and common but differentiated responsibilities?
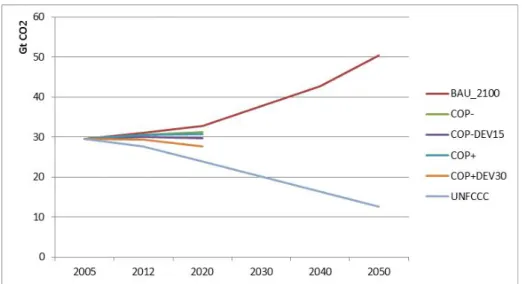
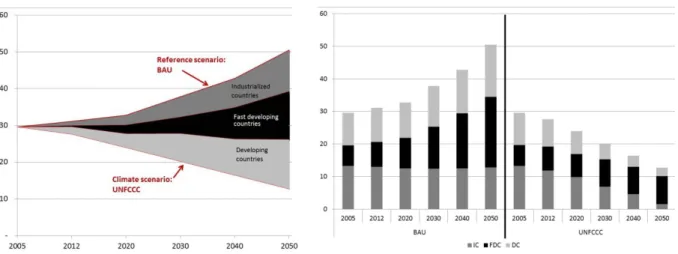
In 2005, industrialized countries represented 48% of the world GHG emissions against 25% for fast developing countries and 27% for developing countries. The latter are thus not constrained by a commitment to reduce emissions of greenhouse gas emissions but, given the commitments of developed countries and fast developing countries by 2020, the emissions trajectories do not appear in line with the consensus target. It is unlikely to achieve the ultimate objective of UNFCCC to limit the increase in global temperature to 2°C without their participation as highlights the figure 4. Indeed, while 30 Gt of CO2 were emitted in 2005, a climate safe pathway (in line with the 2°C
objective) implies a level of emissions to 24 Gt in 2020 (scenario UNFCCC) and so, a decrease of 9 Gt of CO2 if we consider the level of emissions in 2020 in the BAU scenario and, a decrease of 6 Gt of CO2 by comparison with 2005. However, if we consider the lowest commitments pledges by parties, CO2 emissions still increase and reach more than 31 Gt in 2020. The highest commitments pledges by
parties allow a relative stabilization in 2020 of the level of CO2 emission by comparison with 2005. Considering a contribution of developing countries as recommended by IPCCC, in other words a reduction between 15% and 30% by 2020 by comparison with BAU (IPCC, 2007; den Elzen and Höhne, 2008), the level of CO2 emission is not yet reduced enough. In the COP-DEV15 scenario, CO2
emissions are almost stabilized in 2020 at 2005 levels and they decrease by 2 Gt by comparison with 2005 in the COP+DEV30 scenario.
Figure 4: CO2 emissions in COP and UNFCCC scenarios (Gt CO2)
Compared with the BAU 2020 level of emissions, 2.9 Gt of CO2 are avoided in the world in COP-DEV15 and 5 Gt of CO2 in the COP+DEV30 scenario (Figure 5). It is interesting to note two major
facts. First, as previously stated, the commitments pledged by countries appear too low by comparison with the required level of decrease in order to stay in line with the 2°C target. Second, in the UNFCCC scenario, the main contributors, if we consider the less costly approach, are industrialized countries with a reduction of CO2 emission in 2020 by 3.4 Gt by comparison with 2005, followed by developing countries with a reduction of 2.9 Gt of CO2 in 2020 compared with the 2005 level. But considering the BAU level in 2020, developing countries become the main contributors to the CO2 mitigation effort with 3.8 Gt of avoided CO2 against 2.6 Gt from industrialized countries. The weight of the constraint on developing countries is even more important, compared to industrialized countries, in the COP+DEV30 scenario. The main contributors are also developing countries in the
COP-DEV15 scenario if we consider the level of CO2 in 2020 by comparison with the BAU level.
Scenario Industrialized Fast developing Developing World BAU 2005 BAU 2020 BAU 2005 BAU 2020 BAU 2005 BAU 2020 BAU 2005 BAU 2020 COP- -2.1 -1.3 +3 -0.002 +0.7 -0.3 +1.6 -1.6 COP-DEV15 -2.1 -1.3 +3 -0.01 -0.7 -1.6 +0.2 -2.9 COP+ -2.5 -1.8 +3 -0.05 +0.7 -0.3 +1.2 -2 COP+DEV30 -2.5 -1.8 +3 +0.06 -2.3 -3.3 -1.8 -5 UNFCCC -3.4 -2.6 +0.7 -2.4 -2.9 -3.8 -5.6 -8.8
Figure 5: CO2 emissions evolution in 2020 by climate scenario and by group of regions, compared
with the 2005 and 2020 CO2 emission level in the BAU scenario
This questions the fair determination of the contribution by developing countries. Their participation is essential to reach an ambitious target but industrialized and fast developing countries must assume their responsibility for CO2 emissions and contribute to the height of their ability. Especially,
considering the fact that in 2050, contributions to the fight against the climate change, in terms of CO2 mitigation, appear almost equally distributed by groups of countries in the UNFCCC scenario (Figure 6).
Figure 6: Contribution by group of countries to the CO2 mitigation effort in the UNFCCC and BAU
scenarios (Gt CO2)
What is the situation in the term? The international community appears to converge on long-term objectives. We also present environmental long-long-term targets devised for analysing more or less ambitious future developments for 2050. Consider the long-term scenarios of regional objectives by 2050, implemented according to these international convergence and expressed ambitions. The aim of the next negotiations between Parties until the Twenty-first Conference of Parties (COP 21) which will be held in Paris in 2015 is to reach an international agreement involving as many countries as possible, in order to reduce CO2 emissions sufficiently and stay in line with the ultimate 2°C objective
of the UNFCCC.
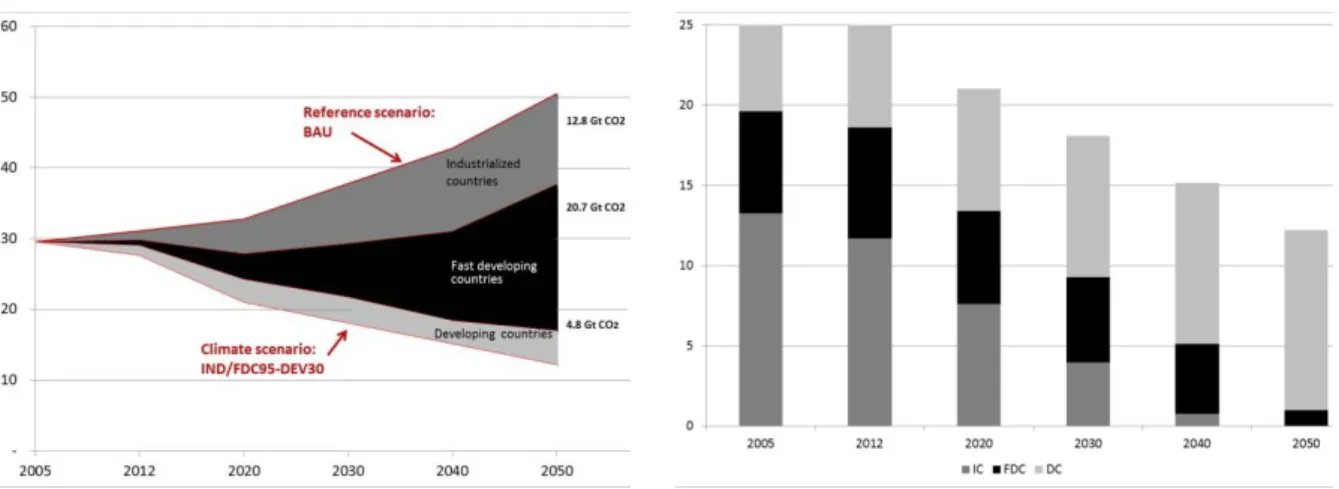
As highlights the Figure 7 and confirming the previous mid-term results, to be ambitious, the future climate regime cannot only be based on industrialized countries (IND80 and IND95), nor on the latter associated with the fast developing countries, even if their joint commitments are particularly strong as in the IND/FDC95 scenario with a 95% reduction of their CO2 emissions by 2050 compared with
2005 level. The UNFCCC objective is reached in the very constrained case implemented in the
IND/FDC95-DEV30 scenario where developing countries contribute to the climate policy of CO2
mitigation with a CO2 emission reduction commitment of 30% to 2050 compared to their business as usual 2050 level. It is interested to note that IND/FDC80-DEV15 and IND/FDC95 follow almost the
same trajectory of CO2 emission decrease. This induces the fact that the mitigation constraint of industrialized and fast developing countries can be released with the participation of developing countries. However, this should not encourage industrialized and fast developing countries to reduce their ambition and not assume their responsibility in climate change.
Figure 8: Contribution by group of countries to the CO2 mitigation effort in the
IND/FDC95-DEV30 scenario (Gt CO2)
Figure 8 clearly highlights that the contribution of CO2 reduction, in this case, is particularly
supported by fast developing countries, i.e. China and India. From 10 Gt of emitted CO2 in 2005,
developing countries should to limit the increase of their CO2 emissions in 2050 to 11 Gt in the IND/FDC95-DEV30 scenario, against 16 Gt in the BAU scenario. Even if the CO2 emission reduction
from fast developing countries is more important than the one from industrialized countries, 21 Gt of avoided reduction for FDC in 2050 by comparison with the 2050 BAU level against 13 Gt for IC, it is important to consider the fact that the energy system of the latter has to be completely carbon-free in 2050 in this climate scenario.
3.2. Technological reading to the mitigation effort
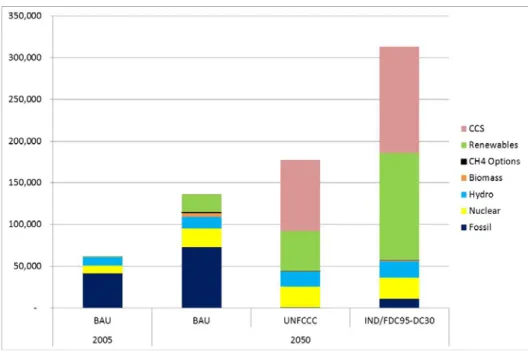
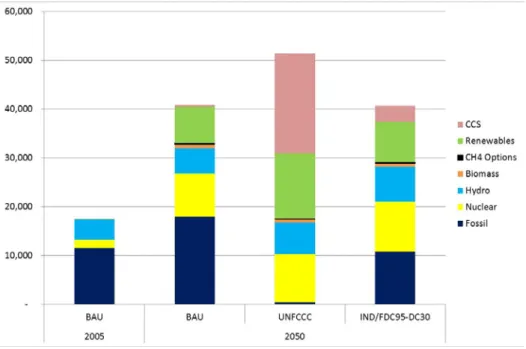
Emission reduction is achieved through technology and fuel substitutions. The optimization results are notably the structure of the energy system, i.e. type and capacity of the energy technologies for example. In 2005, in BAU scenario, the world power mix is dominated by fossil fuels, followed by nuclear and hydro, with respectively 66%, 16% and 11% of the electricity generation. Renewables represents less than 2% of the world production. Their share increases in 2050 to 20% in the BAU scenario to the detriment of fossil (54%) and hydro (10%), even if their level increases in 2050. The role of nuclear power remains stable on the time horizon (Figure 9).
Figure 9: World electricity production in 2005 and 2050 in BAU, UNFCCC and IND/FDC95-DEV30 scenarios (PJ)
In 2050, in climate scenarios, electricity based on fossil fuel drastically decrease in favor of renewables and CCS (carbon capture and storage). Renewables represent 28% and 41% of the power generation in UNFCCC and IND/FDC95-DEV30 scenarios respectively and CCS, 48% and 41% respectively. It is interesting to note the fact that, even if in 2050 the level of CO2 emission is the
same in UNFCCC and IND/FDC95-DEV30 scenarios, the electricity mix clearly appears different. This is due to, of course, the initial structure of the regional energy system and the distribution of the contribution to the CO2 emissions mitigation.
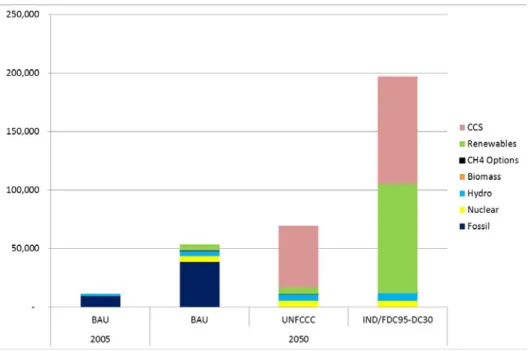
Figure 10: Electricity production in 2005 and 2050 in BAU, UNFCCC and IND/FDC95-DEV30 scenarios (PJ), in industrialized countries
In industrialized countries, fossil based electricity is replaced by CCS and renewables (Figure 10). Even if the hydro and nuclear electricity increases by 2050, their shares decreases in the power mix with, respectively in UNFCCC and IND/FDC95-DEV30, 17% and 13% for nuclear and 10% and 8% for hydroelectricity. The higher is the climate constraint, the higher is the development of CCS. In both case renewables are deployed. The competition between low-carbon options is then between renewables and CCS. In UNFCCC scenario, renewables represents 48% of the power generation of Industrialized countries, and in IND/FDC95-DEV30, 47% of the one of fast developing countries (Figure 11) including geothermal, wind and solar and then, intermittent solutions. This large penetration of intermittent options raises the question of the reliability of the network and of the needed large investment in storage technologies.
Figure 11: Electricity production in 2005 and 2050 in BAU, UNFCCC and IND/FDC95-DEV30 scenarios (PJ), in fast developing countries
The first considered option in fast developing countries, i.e. China and India in this study, is the CCS development. This can be explained by the importance of fossil power plants, and particularly coal plants in China. In IND/FDC95-DEV30 scenario where the contribution to carbon mitigation is particularly important, investment in the deployment of CCS is no longer sufficient and renewables are expected to be largely developed. In UNFCCC scenario, the power production by plants with carbon capture technology represents 75% of the total electricity generation. Note that these power plants are not only based on fossil fuel but also on biomass. This allows benefit from negative emissions, the biomass combustion being considered as neutral. In IND/FDC95-DEV30 scenario, the power production by plants with carbon capture technology represents 47% of the total electricity generation, the same as the renewables production of electricity.
Note that the higher level of electricity production in the climate scenarios can be explained by a substitution between fossil fuels and electricity in other sectors, like transport. In developing countries (Figure 12), the power mix is dominated by fossil, 66%, and hydro, 24%, in 2005 in the BAU scenario. In 2050, in UNFCCC scenarios where the weight of the climate constraint is high, electricity
based on fossil fuel drastically decrease (representing only 1% of the power mix) in favor of CCS (40%), renewables (26%). Nuclear represents 19% of the electricity production but this level is similar to that in BAU scenario in the same period.
Figure 12: Electricity production in 2005 and 2050 in BAU, UNFCCC and IND/FDC95-DEV30 scenarios (PJ), in developing countries
In IND/FDC95-DEV30 scenario, the power mix is similar to that of the BAU scenario. Fossil fuels still dominates the mix, although their share represents only 27% in IND/FDC95-DEV30 scenario (against 44% in BAU), followed by nuclear with respectively 25 and 22%. The climate constraint, less strong than in UNFCCC scenario, involves an increase of hydroelectricity, the use of CCS, but in a lesser extent than in UNFCCC with 8% of power generation, and a larger development of renewables. The portfolio of developed options to meet the climate challenge appears more diversified and in a more plausible extent in terms of achievement. But for that, the challenge is considerable for other regions as fast developing countries and the solutions needed to develop in order to reach an ambitious target staying in line with the 2°C objective are still in challenging state, especially in this extent of development.
4.
Concluding remarks
The previously cited scenarios are analyzed to explore the effects of a possible international coordination on main environmental and economic indicators. The impacts of different commitment levels under post-Copenhagen and/or global long-term climate policies can thereby be discussed and provide some understanding on the stakes and issues. The main focus is, in a first part, on the ambition of the various climate policies regarding CO2 emissions at global and regional level. In a second part, we discuss the impact of international climate change strategies to the energy system, and particularly on the electricity generation. In this context, discussions investigate long-term solutions, such as the development of CCS technologies or renewables, in response to a constraint that influences the energy mix. The aim is to assess the plausibility of its fulfillment and to highlight the challenges, as the storage question. A strong climate policy in line with the 2°C objective
(representing the UNFCCC consensus) requires a global contribution, whether countries are industrialized or developing, or especially fast developing or emerging. After many years of discussion, ambitious targets require commitment to meet the recommended 2°C limitation in temperature increases. However, it is primarily up to industrialized countries to keep their promise of helping countries develop a record of adapting to the impacts of climate change, and nothing is certain as regards the possible level of CO2 emission reduction that developing countries will be able to attain or, even, accept to reduce. In terms of cost, a larger contribution from developing countries is less expensive than strong emission mitigation in industrialized countries, as expressed by the decision to allow flexible mechanisms under the Kyoto Protocol (i.e. develop GHG emissions mitigation projects where the carbon abatement cost can be lower). But this is not sufficient. Could we reach an ambitious, and necessary, climate target without the participation of developing countries? The results highlights the fact that, no, this is not possible. However, do developing countries have the capacity to implement policies to reduce emissions given that their priority is development and energy supply? What are the technological possibilities considering the state of development of their energy systems and the evolution of their needs? CCS and renewables appears as low-carbon solutions but a strong climate constraint requires a high (too high) level of deployment. In addition, the carbon having to be sequestered, the question arises sites and more specifically their potential, location (onshore, offshore), transport (development of a network, strategy to pool resources, etc.), acceptability social due to possible risks of leaks, etc. So many questions that increase the list of challenges to solve. But with this, the climate challenge is also a political challenge to determine who and how high above, contribute to the reduction of CO2 emissions. A key feature of the Copenhagen agreement and of the future accord is the participation of the United States of America and non-Annex I countries, especially China, as they represent a large share of global CO2 emissions. China and the USA are the largest global emitters of CO2 and, as concerning developing countries, without their participation in a climate agreement the latter cannot really ensure achieving stabilized CO2 concentration and global temperatures. Industrialized countries must provide tools and resources to meet the challenges. If they do not, developing countries, which are the most affected by climate change and the most vulnerable, will not be able to commit to reducing their own GHG emissions. However, it is imperative that these countries promptly consider such mitigation policies, especially China, India and Brazil, because in the near future they will represent the biggest share of global emissions. For example, in 2008 China surpassed Germany in terms of economic wealth, and the United States in terms of emissions of carbon dioxide (CO2). Indeed the impact of these countries’ CO2 mitigation targets on global CO2 emissions is essentially long term. Finally, not only must countries act, but technological progress must also find an adequate response to countries’ ambitions to expand the pool of available (or not) technologies and their mitigation potential. This not only concerns CCS technologies, but also non-fossil energies, like wind, solar, biomass, etc. Thus the question of technological plausibility is also a critical factor for the future international climate regime.
As previously specified, the ultimate challenge of the 21st Conference of Parties of Paris in 2015 is to
get countries to converge towards a global and multilateral agreement on ambitious GHG emissions reductions targets. For this purpose; many countries have already submitted and published preliminary contributions to reduce GHG emissions, under the Intended Nationally Determined
Contributions mechanism (INDCs), as recommended during the COP 19 at Warsaw in 2013. Notably,
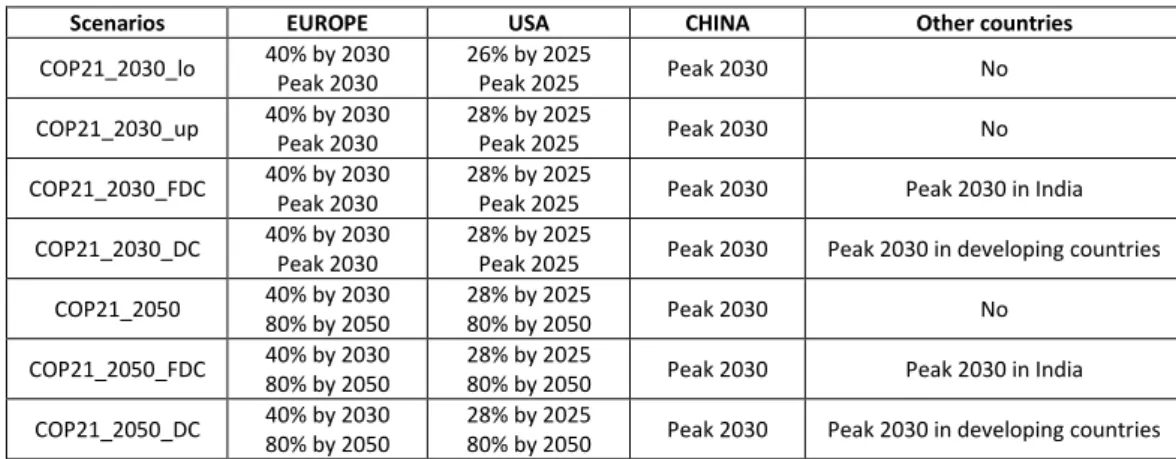
contribution, in other words China, USA, Europe. China has declared to peak their emissions by 2030 (and to reduce its carbon intensity by 65% to 2030 on 2005 levels), the USA have declared to contributing with 26-28% reduction by 2025 compared to 2005, and the European Union with at least 40% reduction by 2030 compared to 1990. As highlighted in this study, international cooperation is needed to tackle the energy-climate problem, including developed and developing countries. China, USA and Europe are particularly expected, notably as a signal of a major climate policy to implement. We then implement the first announcements of China, USA and Europe in new climate scenarios and investigate a combination of these targets including environmental targets for different world regions over the period 2005-2050. More precisely, we consider low and high targets from Europe and USA, and an emission peak for China, India and other developing countries (Figure 13).
Scenarios EUROPE USA CHINA Other countries
COP21_2030_lo 40% by 2030 Peak 2030 26% by 2025 Peak 2025 Peak 2030 No COP21_2030_up 40% by 2030 Peak 2030 28% by 2025 Peak 2025 Peak 2030 No COP21_2030_FDC 40% by 2030 Peak 2030 28% by 2025 Peak 2025 Peak 2030 Peak 2030 in India
COP21_2030_DC 40% by 2030 Peak 2030 28% by 2025 Peak 2025 Peak 2030 Peak 2030 in developing countries COP21_2050 40% by 2030 80% by 2050 28% by 2025 80% by 2050 Peak 2030 No
COP21_2050_FDC 40% by 2030 80% by 2050 28% by 2025 80% by 2050 Peak 2030 Peak 2030 in India COP21_2050_DC 40% by 2030 80% by 2050 28% by 2025 80% by 2050 Peak 2030 Peak 2030 in developing countries
Figure 13: GHG emissions scenarios
Figure 14: GHG emissions pathways
During COP 20 in Lima in 2014, Rajendra Pachauri, IPCC president from 2002 to 2015, declared his “hope to achieve the level of ambition and commitment to give this world a better, sustainable and
0 10 20 30 40 50 60 70 80 2005 2010 2015 2020 2025 2030 2035 2040 2045 2050 G t CO 2e q BAU UNFCCC COP21_2030_lo COP21_2030_up COP21_2030_FDC COP21_2030_DC COP21_2050 COP21_2050_FDC COP21_2050-DC
cleaner future” and Christiana Figueres, executive secretary at the United Nations Framework
Convention on Climate Change, his confidence to “have a productive COP21 in Lima, which lead to an
effective Paris 2015 agreement next year”. It has to be said, considering these scenarios, that if an
effective agreement is concluded during the Paris 2015 COP 21 (which will already be a success), an ambitious agreement is far from being achieve and, major effort will be done to reach an international future climate regime in line with the scale of the climate issue, as highlighted in the figure 14. A strong climate policy will then require a higher contribution, whether countries are industrialized or developing (DC), or especially fast developing or emerging (FDC).
5.
References
Assoumou E., Maïzi N. (2011), "Carbon value dynamics for France: A key driver to support mitigation pledges at country scale", Energy Policy, Vol. 39, No. 7, pp.4325-4336.
Bouckaert S., Selosse S., Dubreuil A., Assoumou E., Maïzi N. (2012), "Analyzing Water Supply in Future Energy Systems Using the TIMES Integrating Assessment Model (TIAM-FR)", Journal of
Systemics, Cybernetics and Informatics, Vol. 10, No. 1, pp 89-94.
den Elzen M. and Höhne N. (2008), “Reductions of greenhouse gas emissions in Annex I and non-Annex I countries for meeting concentration stabilisation targets. An editorial comment”, Climatic
Change, Vol. 91, pp.249-274.
den Elzen, M.G.J., Hof, A.F., Roelfsema, M. (2011), “The emissions gap between the Copenhagen pledges and the 2°C climate goal: Options for closing risks that could widen the gap”, Global
Environmental Change, 21, 733-743.
den Elzen, M.G.J., Hof, A.F., Roelfsema, M. (2013), “Analysing the greenhouse gas emission reductions of the mitigation action plans by non-Annex I countries by 2020”, Energy Policy, 56, pp. 633-643.
Dubreuil A., Assoumou E., Bouckaert S., Selosse S., Maïzi N. (2013), "Water modeling in an energy optimization framework - The water-scarce middle east context", Applied Energy, Vol. 101, No.33, pp. 268-279.
Hof, A.F., Den Elzen, M.G.J., Roelfsema, M. (2013), “The effect of updated pledges and business-as-usual projections, and new agreed rules on expected global greenhouse gas emissions in 2020”,
Environmental Science and Policy 33, 308-319.
IPCC (Intergovernmental Panel on Climate Change) (2014), Climate Change 2014, Fifth Assessment
Report (AR5) Cambridge University Press, Cambridge.
IPCC (Intergovernmental Panel on Climate Change) (2007), Climate Change 2007, Fourth Assessment
Report (AR4), Cambridge University Press, Cambridge.
Krey, V., Riahi, K. (2009), “Implications of delayed participation and technology failure for the feasibility, costs, and likelihood of staying below temperature targets—Greenhouse gas mitigation scenarios for the 21st century”, Energy Economics, 31: S94-S106.
Loulou, R. and Labriet, M. (2008), “ETSAP-TIAM: the TIMES integrated assessment model. Part I: Model structure”, CMS, 5, 7-40.
Peterson, E.B., Schleich, J., Duscha, V. (2011), “Environmental and economic effects of the Copenhagen pledges and more ambitious emission reduction targets”, Energy Policy, 39, 3697–3708. Remme U. and Blesl M. (2008), “A global perspective to achieve a low-carbon society (LCS): scenario analysis with the ETSAP-TIAM model”, Climate Policy; Vol. 8, pp.60-75.
Ricci O., Selosse S. (2013), "Global and regional potential for bioelectricity with carbon capture and storage", Energy Policy, Vol. 52, No 61, pp 689-698.
Ricci O., Selosse S. (2013), "Regional impacts of post Copenhagen emission reduction pledges: prospective analysis with TIAM-FR", Economics Bulletin, Vol. 33, No. 1, pp. 764-77.
Selosse S., Assoumou E., Maïzi N. and Mazauric V. (2010), “Post-Kyoto policy implications on the energy system: A TIAM-FR long term planning exercise”, 22nd World Energy Congress, Montreal,
Canada, proceeding n°366.
Selosse S., Ricci O., Maïzi N. (2013), "Fukushima’s impact on the European power sector: The key role of CCS technologies", Energy Economics, Vol. 39, September, pp. 305-312.
van Vliet, J., van den Berg M., Schaeffer M., van Vuuren D. P., den Elzen M., Hof A. F., Mendoza Beltran A. and Meinshausen M. (2012), “Copenhagen Accord Pledges imply higher costs for staying below 2°C warming”,‖ Climatic Change, 113, 551-561.