13532
Journal of Applied Biosciences 133: 13516 - 13531
ISSN 1997-5902
Effect of design and planting density on the
agrophysiological parameters of clone GT 1 Hevea
brasiliensis Muell Arg in southwestern Côte d'Ivoire
Kouadio Espérence BALLO(1)*, Francis Eric SOUMAHIN(1), Jean Lopez ESSEHI(2) Justin Yatty
KOUADIO (1), Samuel. OBOUAYEBA (3)
1University Jean Lorougnon Guédé, UFR (Faculty) of Agroforestry, Laboratory for improving agricultural production
BP 150 Daloa, Côte d’Ivoire
2University Félix Houphouët Boigny, UFR Sciences de la Terre et des Ressources Minières, 01 BP V34 Abidjan 01
Côte d’Ivoire
3National Center for Agronomic Research (CNRA), Research Station of Bimbresso, Laboratory of Agronomy and
Plant Physiology, 01 BP 1536 Abidjan 01, Côte d’Ivoire
*Corresponding author (e-mail: [email protected]; Tel: +225 49732364)
Original submitted in on 23rd November 2018. Published online at www.m.elewa.org on 31st January 2019
https://dx.doi.org/10.4314/jab.v133i1.5
ABSTRACT
The design and planting density can influence certain agronomic parameters. To enable Hevea brasiliensis clone GT1 to better express their agrophysiological potentialities and sensitivity to the tapping panel dryness a study, of the design and planting density was undertaken at the SCASO experimental site in southwestern of Ivory Coast. The experimental design applied, split-plot of three treatments (designs in lines separated from 6 or 7 m and staggered) and three sub-treatments (350; 510 and 650 trees/ha) with four repetitions, was installed on 12, 22 ha. Only one latex collection system was applied (S/2 d/4 6d/7 ET 2.5 % Pa 1 (1) 6/y). The parameters measured were rubber production, circumference increase, physiological profile and tapping panel dryness sensitivity. The rate of trees present in the plots was good (87.27 %) and have not varied with the design and planting density. Vegetative growth tapping (2.69 cm.year-1), and mean yield (1926 kg.ha-1.year-1) were influenced by density unlike design. Despite good
productivity, the physiological state of the rubber trees was good, characterized by a well-balanced physiological profile and a low tapping panel dryness rate (2.73 %), independently of design and planting density. The density and the suitable planting design were planting in separate rows of 6 m / 650 t/ha. Keywords: Hevea brasiliensis; density and planting design; Rubber production; GT 1; Vegetative growth tapping
INTRODUCTION
Since the beginning of the twentieth century, the yields of cultivated plants have steadily increased but, despite everything, the potential is far from being reached, so that the curves of increase of yield do not seem to bend in the short term (Ledent
and Girardin, 1995).There is no doubt that the part played by genetic improvement is considerable and can be estimated at around 50 % of the total (CIRAD, 2004). The expected progress can be achieved in a context of better follow-up of
13533 technical itineraries, that is to say, by the practice of an orderly and logical sequence of cultivation techniques applied to a cultivated plant species (Monnier et al., 1994). Taking into account the challenges of the rubber industry, one of the important questions posed the searchers is the intensification of latex production systems. The optimization of the designs and densities of plantation is one of the solutions of this intensification which is without destructive effects on the environment (Pathiratna and Perera, 2006; Rodrigo, 2007). Experiments on densities and planting designs have been described by many authors (Rodrigo et al., 1995; Obouayeba et al., 2005). High planting densities, induising to strong competition due to distance between trees, can lead to a reduction in biomass production, yield (Radtke et al., 2003; Obouayeba et al., 2005). In contrast, optimal planting densities can contribute to increased productivity (Pathiratna and Edirisinghe, 2003; Pathiratna and Perera, 2006), especially in rubber growing (Obouayeba, 2005; Obouayeba et al., 2005, Rodrigo, 2007). The major
problem encountered in rubber production in Côte d'Ivoire, is the lack of monitoring of technical routes, partly related to the lack of knowledge of these techniques by some non-industrial rubber growers (Toguila et al., 2016). To minimize the operating costs, some rubber growers are inclined to neglect the cultivation technical routes. This no to respect cultivation practices results in a steady fall in yields, which in turn leads to a clear lack of interest in the practice of rubber growing. To remedy this situation, it appeared necessary to evaluate the influence of the density and the planting design on productivity, isodiametric growth and physiological parameters of clone GT 1 of Hevea brasiliensis. In effect, it will allow rubber growers to make choices that leadind to optimal management of plantation potential. To this effect, a study of the effect of the design and the density of planting on the agrophysiological parameters of clone GT 1 of Hevea brasiliensis Muell Arg was carried out on the experimental site of the GO (Ex HEVEGO), today, Society South West Agricultural Civil (SCASO) in southwestern Côte d'Ivoire. MATERIALS AND METHODS
Plant Material: The plant material used consists of clone GT 1 of Hevea brasiliensis (Mueller Argoviensis Euphorbiaceae), belonging to the vegetative growth classes (Obouayeba et al., 2000; Obouayeba, 2005) and of moderate metabolic activity (Jacob et al., 1988). Its choice is motivated by its hardiness, which makes it the most planted clone in the country, giving it a good and stable stand of bled trees (Chapuset et al., 2000). METHODS
Study site: The works was carried out at Gô research station (Ex HEVEGO), today, South West Civil Agricultural Society (SCASO) in southwest of Côte d'Ivoire (West Africa). This zone is subject to a humid equatorial climate, characterized by abundant rainfall. The average annual temperature is 26.1° C. The average annual rainfall is 1900 mm. The heaviest rains fall from April to July (Figure 1). A relatively dry season starts in December and extended in March (Monnier, 1983; Keli et al., 1992; Brou et al., 2005). The predominantly ferralitic soils are, however, derived from migmatites and shale, sandy clayed, relatively richer in exchangeable bases. They also have gravel horizons and frequent lateritic cuirasses around 1.00 m deep (Keli et al., 1992).
Experimental design and treatments: The field experiment was set up, starting in June 1990 and the rubber trees were tapped in September 1996. The field experiment was conducted in descending bloodletting for nine years with clone GT 1, on the experimental site of the GO rubber company (Ex HEVEGO), today, South West Civil Agricultural Society (SCASO) in the South west of Côte d’Ivoire. The experimental set-up was split-plot of three treatments and three sub-treatments with four repetitions, on a surface of 12.22 ha, planted at the density corresponding to the three sub-treatments.
The different treatments studied were the following: 1: staggered planting;
2: planting in lines separated by 6 meters;
3: planting in lines separated by 7 meters (control). The different sub-treatments tested were:
A: 350 trees per hectare (7 meters between lines and 4.08 meters between plants, 6 meters between lines and 4.75 meters between plants).
B: 510 trees per hectare (7 meters between lines and 2.8 meters between plants, 6 meters between lines and 3.26 meters between plants) (control).
13534 C: 650 trees per hectare (7 meters between lines and 2.2 meters between plants, 6 meters between lines and 2.56 meters between plants).
Latex harvesting technology
Treatments or tapping systems: All treatments were tapped at the same time, that is, at 6 years 3 months after planting. Only one latex collection system was applied to all treatments; tapping half-spiral down every four days, with a day off (Sunday) in the week, with an application of 1 g of concentrated stimulating paste 2.5 % Ethephon and 1 cm wide on the panel; six applications per year (S/2 d/4 6d/7 and 2.5% Pa 1 (1) 6/y). The tapping takes place the first two years on panel A (BO-1) and the third year on panel B (BO-2), with subsequent alternating tapping, from the 4th year,
of the two panels up to at the ninth year of planting (Gohet et al., 1991).
Measurements and data processing
Rubber production: Each tree latex yield was measured by weighing the cumulative coagulated rubber every four weeks. Total solid content was measured from a bulk sample taken in each treatment in order to convert fresh weights into grams of dry rubber per tree. Latex yield was expressed in kilograms per hectare (kg.ha-1), grams per tree (g.t-1) and grams
per tapping per tree (g.t-1 t-1).
Radial vegetative growth: The annual growth in centimeter (cm) and girth increment in centimeter per year (cm.year-1) of the trees was assessed every year
at 1.70 m from the ground, during the nine years of the experiment.
Visual estimation of the tapping panel dryness: On certain trees, during tapping, the flow of latex is abnormally weak or even nonexistent; a more or less important part of the cut does not produce latex. It’s a symptom of tapping panel dryness (TPD). In addition, TPD was assessed by visual estimation of dry-cut length on each tree which enables to report on the evolution of the symptom. On that respect, the trees tapped were rated from 0 to 6 in proportion to the progress of the disease according to the code below. 0: healthy cut, normal flow all along the tapping cut 6: completely dry cut.
• For each treatment, the percentage of live trees (Live Trees %) was determined by the following relationships:
NAV: number of live trees; N total number of trees; NAS: number of dry trees.
Latex analysis
The latex diagnosis per treatment was carried out every year between September and November. The biochemical parameters such as dry rubber content (DRC), sucrose (Suc), inorganic phosphorus (Pi) and thiols contents (RSH) were evaluated. Sucrose (Suc), inorganic phosphorus (Pi) and thiols (RSH) contents were measured on the clear serum called TCA-serum (trichloroacetic acid) that obtained after latex acid coagulation, respectively, by the Ashwell anthrone method (1957), the Taussky and Shorr molybdate ammonium method (1953) and the Boyne and Ellman acid dinitro-dithio-dibenzoic method (1972). The results are stated in millimole per litre of latex (mmol.l-1). DRC
represented the percentage of dry rubber in latex, a latex sample was weighed before and after drying in oven at 80 °C for 24 h. Sucrose reflected the balance between sucrose consumption by the laticifer (for energy production and rubber biosynthesis) and sucrose loading from the apoplast into the laticifer. Pi indicated the level of availabled energy in the metabolic activity of the laticifer. RSH indicated the level of lutoids protection and the stability of latex. Sucrose, Pi and RSH contents were expressed in millimoles per litre of latex (mmol.l-1).
Statistically Analysis: Rubber production data, isodiametric growth of the trunk, micro-diagnosis latex, sick slot length were processed using statistical software STATISTICA 7.5. An analysis of variance was performed and the significance level of the differences between the means was estimated by the NEWMAN-KEULS test at the 5 % threshold.
NAV= N- NAS
13535
Figure 1: Ombrothermal diagram of the study area over the period 1990-2006 (Source: SODEXAM San Pedro Airport).
RESULTS
Effects of different devices and densities of planting on the GT 1 clone after nine years of experimentation
Live Tree Rate: The different designs and densities of planting were all equivalent to the rate of trees present on the plots at the beginning and at the end of the field experimentation (Table 1). The rate of trees present was satisfactory overall at the end of the experiment,
85.78 ± 0.88 %. The rate of trees present on the plots was largely unchanged from the beginning to the end of the field experiment (88.76 ± 0.86 %, 85.78 ± 0.74 %) regardless of the design and the density of planting. However, it was relatively low for the motive "7m / 650 t / ha" with a rate (76.63 ± 0.65 %) significantly lower than the other densities (Table 1).
Table 1: Density of clone GT 1 subjected to different designs and densities of plantation after nine years of experimentation
DESIGN DENSITY Live Trees (%)
Start (At tapping) End (After 15 years of experimentation)
staggered 350 88.25 ± 0.84 ab 85.85 ± 0.56 ab 510 (Co) 84.41 ± 0.79 b 81.91 ± 0.65 b 650 91.43 ± 0.95 a 89.92 ± 0.84 a lines 6 m 350 89.02 ± 0.91 ab 85.69 ± 0.81 ab 510 (Co) 89.21 ± 0.90 ab 86.62 ± 0.72 ab 650 91.22 ± 0.84 a 88.25 ± 0.92 a lines 7 m (Co) 350 92.51 ± 0.90 a 88,37 ± 0,91 a 510 (Co) 91.11 ± 0.56 a 88.51 ± 0.93 a 650 81.83 ± 0.84 b 76.63 ± 0.65 b Average staggered 88.01 ± 0.91 a 85.93 ± 0.83 a Average lines 6 m 89.81 ± 0.84 a 86.92 ± 0.69 a
Average lines 7 m (Co) 88.46 ± 0.78 a 84.51 ± 0.71 a
Average 350 a/ha 89.91 ± 0.81 a 86.71 ± 0.85 a
Average 510 a/ha (Co) 88.23 ± 0.93 a 85.71 ± 0.90 a
Average 650 a/ha 88.13 ± 0.85 a 84.85 ± 0.89 a
Overall average 88.76 ± 0.86 85.78 ± 0.88
In the same column, averages followed by the same letter are not significantly different (Newmann-Keuls test at 5%). Live Trees : Live trees expresses in percentage; Co: control.
13536 Rubber Yield
To the Tree and per Tapping (g.t-1.t -1): Average tree
and tapping production of the nine years of experimentation (61.03 ± 7 g, Table 2) was good for a moderate metabolism clone, notably GT1. She was statistically of the same order of regardless of the planting design. However, she was significantly influenced by planting density. In fact, the g.t-1.t-1 of the
planting density 350 t/ha was (70.6 ± 4.3) statistically higher than that of the planting densities 510 t / ha (control, 60.6 ± 4.9) and 650 t / ha (51.9 ± 7.6). The g.t -1.t-1 of the control (510 t/ha) was significantly higher
than that of the planting density 650 t/ha. At the Tree and per Year (g.t-1.y-1): After nine years of
experimentation, production average annual at tree and per year (4625 ± 388 g), all densities planting combined was good (Table 2). She did not vary according to the planting design. On the other hand, she was significantly dependent on planting density. Indeed, the highest production was obtained with the density 350 t/ha (5394 g.t-1.year-1), statistically superior to the
production of the under control treatment 510 t/ha (4625 g.t-1.year-1). ) and that of the under treatment 650
t/ha (3855 g.t-1.year-1).
Productivity per Hectare: The annual average yield, all designs and density of plantation combined, reached 1926 kg.ha-1.year-1 (Table 2). The annual average yield
was statistically equal in same order regardless of the planting design. Even though, the highest production was that of staggered planting treatment, all densities combined (1975 kg.ha-1.y-1), followed by treatment
where the lines were separated by 6 meters (1911 kg.ha -1.y-1) then control treatment where the lines were
separated by 7 meters (1891 kg.ha-1.y-1, Table 2). For
the under-treatment (density), the highest production, was obtained with the density 650 t/ha (2127 kg.ha-1.y -1), all devices combined. She was statistically
equivalent to that of the control sub-treatment 510 t/ha (2019 kg.ha-1.y-1), and higher than that of the
sub-treatment 350 t/ha (1631 kg.ha-1.y-1). The recorded
productions were not significantly influenced by the design, but rather by the planting density (Table 2).. In general, the design / planting density interaction showed that the combination "staggered planting / 650 t/ ha" favored a better expression of the specific production potential of the rubber clone GT 1.
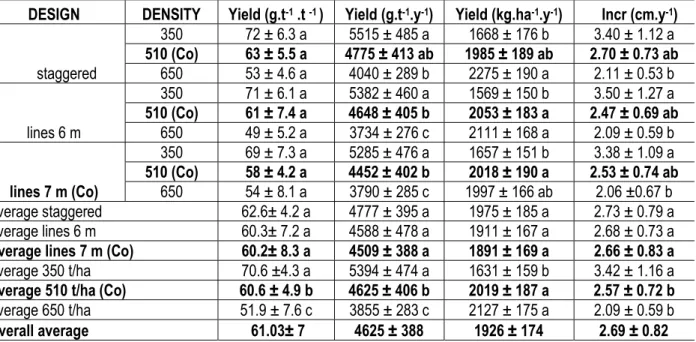
Table 2: Average rubber production and mean annual circumference growth of the GT 1 clone subjected to different designs and densities of plantation after nine year of experimentation
DESIGN DENSITY Yield (g.t-1 .t -1 ) Yield (g.t-1.y-1) Yield (kg.ha-1.y-1) Incr (cm.y-1)
staggered 350 72 ± 6.3 a 5515 ± 485 a 1668 ± 176 b 3.40 ± 1.12 a 510 (Co) 63 ± 5.5 a 4775 ± 413 ab 1985 ± 189 ab 2.70 ± 0.73 ab 650 53 ± 4.6 a 4040 ± 289 b 2275 ± 190 a 2.11 ± 0.53 b lines 6 m 350 71 ± 6.1 a 5382 ± 460 a 1569 ± 150 b 3.50 ± 1.27 a 510 (Co) 61 ± 7.4 a 4648 ± 405 b 2053 ± 183 a 2.47 ± 0.69 ab 650 49 ± 5.2 a 3734 ± 276 c 2111 ± 168 a 2.09 ± 0.59 b lines 7 m (Co) 350 69 ± 7.3 a 5285 ± 476 a 1657 ± 151 b 3.38 ± 1.09 a 510 (Co) 58 ± 4.2 a 4452 ± 402 b 2018 ± 190 a 2.53 ± 0.74 ab 650 54 ± 8.1 a 3790 ± 285 c 1997 ± 166 ab 2.06 ±0.67 b Average staggered 62.6± 4.2 a 4777 ± 395 a 1975 ± 185 a 2.73 ± 0.79 a Average lines 6 m 60.3± 7.2 a 4588 ± 478 a 1911 ± 167 a 2.68 ± 0.73 a
Average lines 7 m (Co) 60.2± 8.3 a 4509 ± 388 a 1891 ± 169 a 2.66 ± 0.83 a
Average 350 t/ha 70.6 ±4.3 a 5394 ± 474 a 1631 ± 159 b 3.42 ± 1.16 a
Average 510 t/ha (Co) 60.6 ± 4.9 b 4625 ± 406 b 2019 ± 187 a 2.57 ± 0.72 b
Average 650 t/ha 51.9 ± 7.6 c 3855 ± 283 c 2127 ± 175 a 2.09 ± 0.59 b
Overall average 61.03± 7 4625 ± 388 1926 ± 174 2.69 ± 0.82
In the same column, averages followed by the same letter are not significantly different (Newmann-Keuls test at 5%). (g.t-1 .t -1):
To the tree and per tapping; (g.t-1.y-1): at the tree and per year; (kg.ha-1.y-1): Productivity per hectare; Yield: Rubber yield; Incr:
Average annual increment (cm/year)
Radial Vegetative Growth: The results obtained showed that with an average annual circumference increase of 2.69 cm.year-1, all designs and densities
combined, the radial vegetative growth was good. Annual mean increment values for the highest trees were obtained with the low planting density of 350 t/ha
13537 (3.42 cm.year-1), all devices combined. Radial
vegetative growth in tapping was significantly influenced by planting density. In effect, the lowest mean annual increment was observed with the under treatment (density) 650 t/ ha (2.09 cm.year-1),
statistically identical to that (2.57 cm.year-1) of the
control density (510 t/ha) and lower than the low density under treatment of 350 t/ha (3.43 cm.year-1). As for the
devices, all the treatment not postpone significantly from the control treatment (2.66 cm.year-1) relative to
the average rates of circumference increase of the rubber trees (Table 2). Indeed, the highest mean annual increment was observed with staggered treatment (2.73 cm.year-1) followed by treatment where
the lines were separated by 6 meters (2.68 cm.year-1).
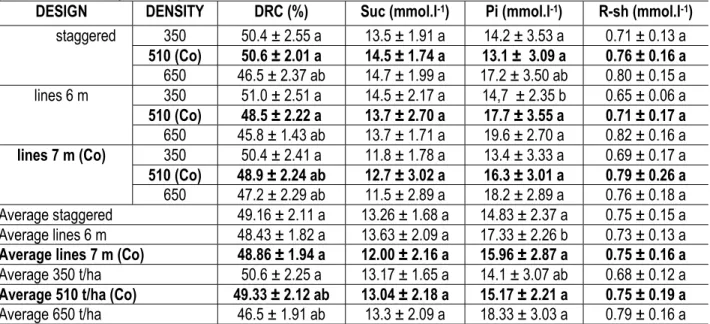
Physiological Parameters: The latex diagnosis of the first and ninth years of experimentation on the clone GT 1 gave results recorded in Tables 3 and 4. The physiological state of the rubber trees remained almost the same from the first to the ninth year of latex harvest, whatever the design and the density of planting. This is
illustrated by a well balanced physiological profile, good at the beginning and at the end of the experiment. Whatever the planting device (staggered, lines separated by 6 meters, lines separated by 7 meters), Dry rubber content and the thiols content were average, the concentration of inorganic phosphorus latex and sugar respectively were high to very high. Indeed, the average rate of dry rubber content of the latex is generally high (48.40 %) and was not influenced by the design and the density of planting. The average contents of sucrose (13.13 mmol.l-1), inorganic
phosphorus (20.88 mmol.l-1) and thiols group (0.72
mmol.l-1) of the latex were respectively good, very good
and good levels and conform to those of a moderate metabolism clone, especially of GT 1. They not did significantly vary according to the design and the density of planting. Overall, the results of the Micro Diagnostic Latex show that neither the design nor the density of planting influenced the physiological state of the trees of the experiment.
Table 3: Average values of physiological parameters of clone GT 1 subjected to different designs and densities of plantation after one year of experimentation
DESIGN DENSITY DRC (%) Suc (mmol.l-1) Pi (mmol.l-1) R-sh (mmol.l-1)
staggered 350 50.4 ± 2.55 a 13.5 ± 1.91 a 14.2 ± 3.53 a 0.71 ± 0.13 a 510 (Co) 50.6 ± 2.01 a 14.5 ± 1.74 a 13.1 ± 3.09 a 0.76 ± 0.16 a 650 46.5 ± 2.37 ab 14.7 ± 1.99 a 17.2 ± 3.50 ab 0.80 ± 0.15 a lines 6 m 350 51.0 ± 2.51 a 14.5 ± 2.17 a 14,7 ± 2.35 b 0.65 ± 0.06 a 510 (Co) 48.5 ± 2.22 a 13.7 ± 2.70 a 17.7 ± 3.55 a 0.71 ± 0.17 a 650 45.8 ± 1.43 ab 13.7 ± 1.71 a 19.6 ± 2.70 a 0.82 ± 0.16 a lines 7 m (Co) 350 50.4 ± 2.41 a 11.8 ± 1.78 a 13.4 ± 3.33 a 0.69 ± 0.17 a 510 (Co) 48.9 ± 2.24 ab 12.7 ± 3.02 a 16.3 ± 3.01 a 0.79 ± 0.26 a 650 47.2 ± 2.29 ab 11.5 ± 2.89 a 18.2 ± 2.89 a 0.76 ± 0.18 a Average staggered 49.16 ± 2.11 a 13.26 ± 1.68 a 14.83 ± 2.37 a 0.75 ± 0.15 a Average lines 6 m 48.43 ± 1.82 a 13.63 ± 2.09 a 17.33 ± 2.26 b 0.73 ± 0.13 a Average lines 7 m (Co) 48.86 ± 1.94 a 12.00 ± 2.16 a 15.96 ± 2.87 a 0.75 ± 0.16 a Average 350 t/ha 50.6 ± 2.25 a 13.17 ± 1.65 a 14.1 ± 3.07 ab 0.68 ± 0.12 a Average 510 t/ha (Co) 49.33 ± 2.12 ab 13.04 ± 2.18 a 15.17 ± 2.21 a 0.75 ± 0.19 a Average 650 t/ha 46.5 ± 1.91 ab 13.3 ± 2.09 a 18.33 ± 3.03 a 0.79 ± 0.16 a In the same column, averages followed by the same letter are not significantly different (Newmann-Keuls test at 5%). DRC %: Suc (mmol.l-1): average sucrose content of the latex expressed in millimoles per liter; Pi (mmol.l-1): average inorganic phosphorus
content of the latex expressed in millimoles per liter; R-sh (mmol.l-1): average content of thiol groups of latex expressed in
13538
Table 4: Average values of physiological parameters of clone GT 1 subjected to different designs and densities of plantation after nine year of experimentation
DESIGN DENSITY DRC (%) Suc (mmol.l-1) Pi (mmol.l-1) R-sh (mmol.l-1)
staggered 350 49.94 ± 2.95 a 13.92 ± 1.91 a 22.00 ± 3.53 a 0.71 ± 0.13 a 510 (Co) 48.40 ± 2.41 a 13.67 ± 1.74 a 21.81 ± 3.09 a 0.73 ± 0.16 a 650 48.05 ± 2.77 a 13.11 ± 1.99 a 20.99 ± 3.50 ab 0.70 ± 0.15 a lines 6 m 350 48.54 ± 2.91 a 12.17 ± 2.17 a 17.54 ± 2.35 b 0.69 ± 0.06 a 510 (Co) 48.55 ± 2.82 a 13.20 ± 2.70 a 21.20 ± 3.55 a 0.73 ± 0.17 a 650 47.89 ± 2.13 ab 13.86 ± 1.71 a 20.89 ± 2.70 a 0.74 ± 0.16 a lines 7 m (Co) 350 49.25 ± 3.01 a 13.44 ± 1.78 a 21.15 ± 3.33 a 0.72 ± 0.17 a 510 (Co) 47.01 ± 2.94 ab 12.25 ± 3.02 a 21.09 ± 3.01 a 0.77 ± 0.26 a 650 47.97 ± 2.89 ab 12.55 ± 2.89 a 21.39 ± 2.89 a 0.73 ± 0.18 a Average staggered 48.80 ± 2.71 a 13.57 ± 1.88 a 21.59 ± 3.37 a 0.71 ± 0.15 a Average lines 6 m 48.33 ± 2.62 a 13.08 ± 2.19 a 19.87 ± 2.86 b 0.72 ± 0.13 a Average lines 7 m (Co) 48.08 ± 2.94 a 12.75 ± 2.56 a 21.20 ± 3.07 a 0.74 ± 0.16 a Average 350 t/ha 49.24 ± 2.95 a 13.17 ± 1.95 a 20.22 ± 3.07 ab 0.71 ± 0.12 a Average 510 t/ha (Co) 47.99 ± 2.72 ab 13.04 ± 2.48 a 21.36 ± 3.21 a 0.74 ± 0.19 a Average 650 t/ha 47.97 ± 2.59 ab 13.18 ± 2.19 a 21.09 ± 3.03 a 0.72 ± 0.16 a In the same column, averages followed by the same letter are not significantly different (Newmann-Keuls test at 5%). DRC %: Suc (mmol.l-1): average sucrose content of the latex expressed in millimoles per liter; Pi (mmol.l-1): average inorganic phosphorus
content of the latex expressed in millimoles per liter; R-sh (mmol.l-1): average content of thiol groups of latex expressed in
millimole per liter.
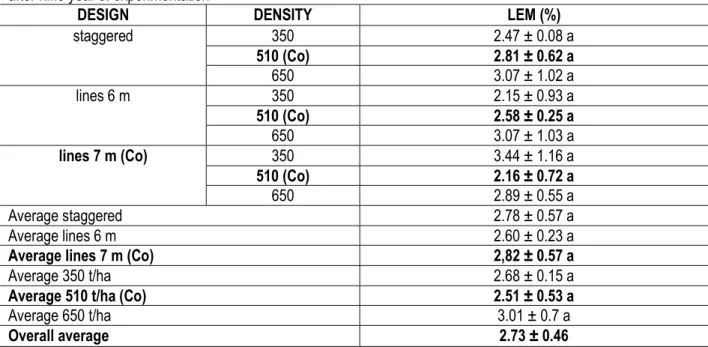
Tapping Panel Dryness: The different designs and planting densities did not have a significant impact on the GT 1 clone diseased notch length rates after nine
years of experimentation (Table 6). Rates were quite low, and varied slightly 2.73 ± 0.46 % for all devices, and planting densities.
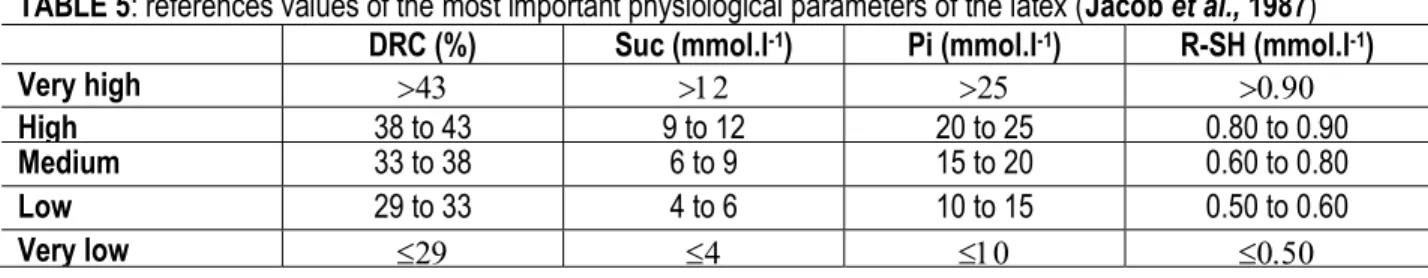
TABLE 5: references values of the most important physiological parameters of the latex (Jacob et al., 1987)
DRC (%) Suc (mmol.l-1) Pi (mmol.l-1) R-SH (mmol.l-1)
Very high
High 38 to 43 9 to 12 20 to 25 0.80 to 0.90
Medium 33 to 38 6 to 9 15 to 20 0.60 to 0.80
Low 29 to 33 4 to 6 10 to 15 0.50 to 0.60
13539
Table 6: Percentages of dry trees (tpd (%) of clone GT 1 subjected to different designs and densities of plantation after nine year of experimentation
DESIGN DENSITY LEM (%)
staggered 350 2.47 ± 0.08 a 510 (Co) 2.81 ± 0.62 a 650 3.07 ± 1.02 a lines 6 m 350 2.15 ± 0.93 a 510 (Co) 2.58 ± 0.25 a 650 3.07 ± 1.03 a lines 7 m (Co) 350 3.44 ± 1.16 a 510 (Co) 2.16 ± 0.72 a 650 2.89 ± 0.55 a Average staggered 2.78 ± 0.57 a Average lines 6 m 2.60 ± 0.23 a
Average lines 7 m (Co) 2,82 ± 0.57 a
Average 350 t/ha 2.68 ± 0.15 a
Average 510 t/ha (Co) 2.51 ± 0.53 a
Average 650 t/ha 3.01 ± 0.7 a
Overall average 2.73 ± 0.46
In the same column, averages followed by the same letter are not significantly different (Newmann-Keuls test at 5%). LEM: diseased notch length
DISCUSSION
The average annual productivity of all designs and planting densities of our works is 1926 kg.ha-1.year-1.
This yield is important and especially high since it is higher than the national average yield (1700 kg.ha -1.year-1; Obouayeba et al., 2016.) which is one of the
best in the world. The results of nine years of experimentation on the planting design show that the three designs are statistically equivalent for tree production, productivity per hectare and radial vegetative growth. These results indicate that irrespective of the planting density tested (350, 510 and 650 t / ha), the staggered and line arrangement of the plants, separated by 6 or 7 meters, does not affect the number of living trees, agrophysiological parameters, tree and hectare productivity, growth vegetative tapping and dryness. However, designs in lines (separated by 6 or 7 m) for a ease of execution of cleaning work with gear, phytosanitary treatments, presents advantage a certain over the design staggered. Similarly, the design in lines separated by 6 m, with 2.56 m against 2.20 m (7 m between lines) between two plants on a line, is preferable because of a greater distance giving a smaller footprint spatial between plants. The planting design in lines separated by 6 m is the one whose implementation seems more suitable and therefore the planting design to promote. With respect to the results on planting density, this parameter did not influence the
rate of live trees and that of diseased notch length (LEM), however, the productivity of the tree and per hectare are under his influence. These results indicate that the disposition of rubber trees in the field is of little importance in relation to these productivity performances, especially since this spatial arrangement has not influenced the live trees population. Indeed, there is, priori, a strong presumption that the rate of living trees depends on their spatial positioning since the spatial arrangement of the trees determines the space congestion that can condition the follow-up of these. Our results support the idea that it is not, especially concerning their productivity. This seems consistent with the acquired of many authors (Rodrigo et al., 2005; Rodrigo, 2007), whose work shows that the productivity of the rubber tree and its physiological state are related to the treatments applied to the tree and the number of trees per unit area (hectare) that are under these treatments rather than its spatial positioning vis-à-vis others. This is evidenced by the fact that overally planting density significantly determines the productivity of the tree and per hectare. Indeed, these results, like many others (Pathiratna and Edirisinghe, 2003), clearly show that with planting density, there is a decreasing gradient of average annual circumference growth and productivity tree and a growing productivity gradient at hectare. The physiological state is generally good,
13540 regardless of the design and the density of planting. These results allow us to suggest in the plantation establishment the planting density of 650 trees per hectare. This proposal comes from the fact that previous studies have shown that agronomically justifiable plantation density is between 400 ≤ t / ha
<700 (Obouayeba 2005; Obouayeba et al., 2005). Better still, the works of Abdullah 1979, Obouayeba 2005 and Obouayeba et al., 2005 have made it clear that the optimum technical density of planting, or the economically justifiable density, is 650 t / ha.
CONCLUSION
The purpose of the study is to study the influence of density and planting design on radial vegetative growth and the production of the most planted clone in Côte-d'Ivoire in particular, the clone GT1 in order to better orient the beneficiaries towards an optimal combination (design-density of planting). The results of this study show that the vegetative growth at tapping (2.69 ± 0.80 cm.year-1) and the average annual yield (1926 ± 174
kg.ha-1.year-1) were influenced by the planting density
unlike the design planting. Although the productivity is of a good level, the physiological state of the rubber trees remained good, characterized by a physiological profile well balanced independently of the design and the density of planting. The density and the suitable planting device are determined at the combination " separate line design 6m / 650 t / ha ".
REFERENCES
Abdullah B. S (1979). Economics of high planting density on rubber smallholdings: Revisited. Proceeding of RRIM Planters’ Conference Kuala Lumpur 1979: 82-90.
Ashwell G., (1957). Colorimetric analysis of sugar.Meth.Enzymol., vol. 3: 73-105
Boyne A. F. and Ellman G. L., (1972). A methodology for analysis of tissue sulphydryl components. Anal. Biochem., 46: 639-653.
Brou Y. T., Akindes F., and Bigot S., (2005). Climate variability in Côte d'Ivoire: between social perceptions and agricultural responses, Cahiers Agricultures vol. 14, No. 6, November-December 2005, pp. 533-540.
Chapuset T., Gnagne M., Legnate H., Koffi E. And Clement-Demange A., 2000. Fields of Large Scale clones in Côte d'Ivoire, situation in 1999. Sea Report No. 01/2000-A March 2000, 40-63 Cirad, (2004). Production of natural rubber threatened.
Report. Natural rubber, MASSON, M. www.cirad.fr/ publication / documents /product strop / 1999 / caoutchouc 99.html. November, 2004.
Gohet E., Lacrotte R., Obouayeba S. and Commere J. (1991). Tapping systems recommended in West Africa. In Proc. Rubb. Res. Inst. Malaya Rubber Growers' Conference 1991, pp. 235 – 254.
Jacob J.L., Serrès E., Prévôt J.C., Lacrotte R., Clément-Vidal A., Eschbach J.M. and D’auzac J., (1988). Development of the latex diagnosis. Agritrop, 12: 97-118.
Keli, J. Z., Obouayeba, S and Zehi, B (1992). Influence of some food systems on the behavior of young rubber trees in the lower Ivory Coast. Agricultural Systems in Africa, 2 (1): 41 - 48. Ledent J. F and Girardin P. (1995). Ecophysiology and
plant breeding, a useful relationship? What future for plant breeding? Ed. AUPELF-UREF. John Libbey Eurotext. Paris, pp. 23-30.
Monnier Y., (1983). Vegetation. In:atlases of young Africa Ivory Coast. J. A, pp. 16-18.
Monnier G., Thevenet G. and Lesaffre B. (1994). Simplification of tillage. Symposia, Paris (France) May 16, 1991. INRA - ITCF - CEMAGREF. INRA EDITIONS, 154 p.
Obouayeba S., Boa D and Keli Z.J., (1996). Adequacy between the quantity of stimulating dough and the rubber production of Hevea brasiliensis in south-eastern Côte d'Ivoire. Tropicultura, 14 (2), 54-58.
Obouayeba S., Boa D., Dian K., Ouattara N and Keli Z.J.,(2000). Dynamics of vegetative growth and productivity of hevea: brasiliensis. In determing tapping nprms. J. Rub. Res., 3 (1) : 53- 62.
Obouayeba S., (2005). Contribution to the determination of the physiological maturity of the bark for the tapping of Hevea brasiliensis Muell. Arg. (Euphorbiaceae): Opening standard. Thesis University of Cocody, UFR Biosciences, Ivory Coast, 225p.
Obouayeba S., Dian K., Boko A.M.C, Gnagne Y.M, And Ake S., (2005). Effect of planting density on growth and yield productivity of Hevea
13541 brasiliensis Muell. Arg. Clone 235. J Rubb. Res., 8(4), 257- 270.
Obouayeba S., Atsin G.J.O., Soumahin E.F., Iqbal S.M.M., Essehi J.P and Andobouayeba A.P., (2016). Efficient Latex Harvesting Technologies at the Opening of Hevea brasiliensis Moderate Metabolism Clone GT 1 in Côte d’Ivoire. J. Rubb. Res., Vol.19, N°1, 53 – 70.
Pathiratna, L.S.S. and Edirisinghe, J.C. (2003). Agronomic and economic viability of rubber (Hevea brasiliensis Muell. Arg.) Cinnamon (Cinnamomum verum J. Pres.) intercropping systems involving wider inter-row spacing in rubber plantations. Journal of the Rubber Research Institute of Sri Lanka 86, 46-57. Pathiratna, L. S. S. and Perera, M.K.P. (2006). Effect of
plant density on bark yield of Cinnamon intercropped under mature rubber. Agroforestry Systems 68, 123-131.
Prévôt J.C., Jacob J.N.L., Lacrotte, R., Vidal A., Serrès E., Eschbach J.M. and Gigaul T J., (1986). Physiological parameters of latex from Hevea brasiliensis. Their use in the study of the laticiferous system. Typology of functioning production mechanisms. Effects of stimulation. In: IRRDB physiology and Récolte de latex Meeting, Hainan, 1986, Pan Yanqing and Lhao Canwen Eds, South China Academy of Tropical Crops offunctioning (Hainan), 136- 157.
Rodrigo Vhl, Anugawela, Lss Pathiratna, Up De Waidyanatha, Aci Samaranayake, Pb Kodikara and Jlk Weeralal, (1995). Effect of planting density on growth, yield, related factors and profitability of rubber (Hevea brasiliensis Muell. Arg.), Jl. Rubb. Res. Inst. Sri Lanka, (1995), 76, 55-71.
Rodrigo, V.H.L., Stirling, C.M., Teklehaimanot, Z.K., Samarasekera, R.K. and Pathirana, P.A.D. (2005). Interplanting banana at high densities with immature rubber crop for improved water use. Agron. Suntain. Dev. 25, 45-54.
Rodrigo, V.H.L. (2007). Ecophysiological factors underpinning productivity of Hevea brasiliensis. Brazilian Journal of Plant Physiology 19 (4), 245-255.
Radtke P. J., Westfall J. A. and Burkhart H. E. (2003). Conditioning a distance – dependent competition index to indicate the onset of inter-tree competition. Forest Ecology and Management, 178 (1/3): 17-30.
Taussky H.H and Shorr E., (1953). A micro colorimetric method for the determination of inorganic phosphorus. J. Biol. Chem., 202: 675 – 685. Toguila T. B., N’diaye O and N Attobra A., (2016).
Technical assistance device for the transfer of technologies to rubber planters in Côte d'Ivoire. WORKSHOP IRRDB- 28-29-30 / 09/2016.