HD28
.M414
^3
*<«»*i^ 3fWORKING
PAPER
ALFRED
P.SLOAN
SCHOOL
OF
MANAGEMENT
ASSESSING
TECHNOLOGICAL
PROGRESS USING
HAZARD
RATE
MODELS
OF
R&D
COMMUNITIES
Michael
A.
Rappa
MassachusettsInstitute of Technology
30July1993 Sloan
WP#
3596-93MASSACHUSETTS
INSTITUTE
OF
TECHNOLOGY
50
MEMORIAL
DRIVE
!j\/lasstuhusettsInstituteofTechnology
ASSESSING
TECHNOLOGICAL
PROGRESS USING
HAZARD
RATE
MODELS
OF
R&D
COMMUNITIES
Michael A.
Rappa
MassachusettsInstitute ofTechnology
30July1993 Sloan
WP
# 3596-931993
MASSACHUSETTS
INSTITUTE OFTECHNOLOGY
Massachusetts
InstituteofTechnology
Alfred P. Sloan
School of
Management
50
Memorial
Drive,E52-538
1
1^.1.1.
ueRA^e
AUG
12
1993
Assessing
Technological
Progress
Using Hazard
Rate
Models
of
R&D
Communities*
MichaelA.
Rappa
MassachusettsInstituteof Technolo^
Abstract
This paperdescribes the useof hazard rate models for assessingemerging technologies. It suggests thaton a global scaJe thedecisions ofresearchers, in terms oftheir entrance, continuance, and exit from a field, can serveasan indicatorofthe rate ofprogress in theemergenceofanewtechnology.The approach is
demon-strated using the literature on magnetic bubble memory technology as a source ofdata to determine the contribution-spansofresearchers. Survival and hazard functionsare estimatedbased upon the experienceof
morethan seventeen-hundredresearchers contributingto theheld overtwodecades.
1. Introduction
In thehighly competitive battleground ofmemorytechnology, thebattlefield isstrewnwith
therelicsof conceptsanddevices whosepromiseswere neverfulfilledorhave failedtomeet
theultimatetestoftime (Bobeck, BonyhardandGeusic, 1975).
Around
theworld, eachand
everyday, scientists, engineers, and managersmake
choicesabout the direction to
employ
their timeand
resources in developing newly emerging tech-nologies. These areundoubtedly
difficult judgments to make.Although
the alternativesconfronting
them
may
be evident, theappropriate direction to pursue is seldom absolutelyclear.
Any
choice is likely to be contingenton
anumber
offactors thatmay
vary in theirclarityand significance over time. In pursuing the development ofa technology, managers
must
be confident in their answers to severalquestions, such as: Will researchersadequatelyresolve the technical problems? Will the development ofan alternative technology
prema-turelydiminishits usefulness? Will a sufficientlylarge market
come
about tomake
the costof developing the technology
worth
the time and effort?How
will competitors, suppliers,and customers react? Finding the answers to such questions is a major preoccupation for
management.
The
factors thatmay
influence the rate ofa technology'sdevelopment would
appear tobe
many
and diverse.New
technologies emerge within acomplex
socio-technical systemthat typically includes the interaction of
many
individualsand
organizations, eachmaking
their
own
decisions aboutwhat
todo
—
or not to do—
and
when
(Rappa
and Debackere,1992;
Van
deVen,
1993).Any
single actor (individual or organization) alonemay
haverelatively little effect
on
the overall process ofemergence. Moreover, factors that appear tohave a major influence
may
have far less actual significance, while factors that appear tohave
minor
consequences, or go relatively unnoticed,may
havea major effect. Indeed, thereAn earlier version of this paper was presented at the
R&D
Management Conference on TechnologyAssessment and Forecasting
hdd
atthe Swiss Federal InstituteofTechnology (Zurich, Switzerland), 5-7July, 1993.2 MichaelA.Rappa
may
be somany
factors involved that the influence of any single one,when
considered independently,may
be highly misleading.In the faceof such complexity, anyeffort to determineand predict the factors that affect
the rate ofa technology's emergence
may
very well be misplaced.What
is certain is that anew
technology emerges through the sustained efforts ofresearcherswho
seek thesolutionsthat
make
it viable.The
decisions of these researchers as awhole
—
in terms of theirentrance, continuance, and exit
from
a particular technological field—
may
providesome
indication oftheir perceptions ofthe rate ofprogress. Thiis, rather than search for specific factors affecting the rate ofa technology's emergence and to decipher their impact, a
differ-ent approach
would
be to ascertain the likelihood ofpersistenceamong
researchersworking
in the field.
Within
thedomain
of their educationand
training, researchers normally havesome
degree oflatitude inapplying their skills, and arelikely to pursue the direction they consider
to hold the
most
promise. Researchers are likely to shift their focusamong
differenttechnologies in accordance with their perceptions
—
aswell asthose oftheir colleaguesand
managers—
ofthe likelihoodofsuccess and the potential payoff.While
pursuingan agenda,researchers
must
periodically reassess theircommitments
basedupon
their senseofhow
wellthe
work
isproceeding. Ifthe paceofprogress is reasonablywell, theymay
bemore
inclinedto stickwith it. However, ifprogress is slower than they had anticipated, they
must
decideto redouble their effortsor ultimately to
move
ina different direction.It is precisely in this
manner
that the decisions ofresearchers as awhole
may
signalchanges in atechnology's rate of progress towardcommercialization.
The
aggregate measure of such decisionsmay
verywellembody
all ofthe information availableabout the likelihoodofsuccessfullydeveloping a technology.
That
is, itmay
represent the cumulative judgments ofall of thosewho
work
in the field andwho,
through their decisions to stay with ordis-continue their activities are signaling their
own
assessment of a technology.The
basicassumption is that thereis acorrespondence between the rateof progress in a technical field
and
the likelihoodofresearcherscontinuing in it.2.
Hazard
RateModels
ofEmerging
TechnologiesGiven
the duration ofactivity for individual researchers in a field, it is possible toesti-mate
for thispopulation (I) the probability that a researcherwill continue in a field a givennumber
ofyears, and (2) the probability that, having been in the field a givennumber
ofyears, a researcherwill exit the field. In actuarial statistics, these are
known
as the survivaland hazard functions ofa population (Lee, 1992).
The
same
statistics are used in sociology(Allison, 1984; Yamaguchi, 1992), economics (Lancaster, 1990), andorganizational ecology
(Hannan
and Freeman, 1989).The
method
wasdeveloped inorderto take into accounttheindeterminacy of duration fora
segment
ofthe populationwhich remains active at thetimeofanalysis bycensoring suchcases (see theappendix for theformal derivation ofthesurvival
and hazard functions).
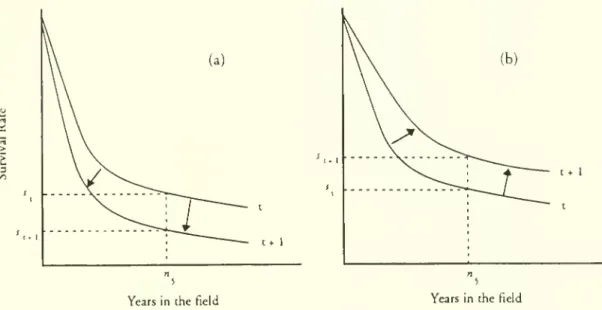
It is posited that shifts in the survival and hazard functions over time
may
serve as anindicator ofchanges in confidence
among
researchers in a field.The
survival curve,illus-trated in Figure 2.1, indicates the cumulative probability ofremaining in the field nyears.
The
implications ofadownward
shift in the survival function from time period t x.o t+\,shown
indiagram (a), suggests that the probabilityofremainingin the field nyears has de-creased over time. In the case of«=5
years, the survival rate declinesfrom
s^ to s^^y InAssessingTechrwioguaJProgress
t
Yearsin thefield Yearsinthefield
Figure 2.1: Survivalratecomparisonfromone periodtothenext.
diagram (b) the opposite
outcome
is shown, inwhich
the survival function shiftsupward
from one
time period to the next. This suggests an increase in the likelihood ofremaining inthefield nyears.
Although
the survival functionmay
provide a useful understandingofthe likelihood ofcontinuance in a field, the hazard fijnction can be
more
informative. It suggests the condi-tional probability ofexit from the field, given a researcher hasbeen in the field nyears.An
increase in the hazard rate
may
signal a lackofprogress in thefield, whileareduction in thehazard rate
may
suggest that researchers areconfident in thepresent rate ofprogress.The
hazard curve dynamics are illustrated in Figure 2.2. In diagram (a), the hazardcurveshifts
downward
from time period ^to ^+1. This suggests that the probability ofare-searcherleaving the field after oneyeardeclines
from
A, to At ^"'1 ^^"^ probability of leavingthe field afterhaving been init for fiveyears declines
from
h-^ to A4. In diagram (b) theop-posite result is demonstrated, in which the hazard curve shifts
upward
from one period tothe next. This suggestsan increasein the probability ofa researcher exitingafter one yearin
the field
from
A, to Ai. ^"'l ^'^ increase in the probability ofexiting the field after havingbeen in itforfiveyears from h-^ to ^4.
Notice that thehazard rate is higher and changes
more
substantiallyforresearcherswho
are in the field only a short time. This implies that as researchers accumulate intellectual
capital in a field they
become
less and less likely relinquish this investmentby switching toother fields. Thisis consistentwith empiricalstudiesofother fields (e.g.,
Rappa and
Garud,1992) that
show
that the longera researcher is in a field the less likely that he or she is to leave it. Thus,we
should expecta higher andmore
volatile hazard rate for researchers withless time in thefield.
Another
way
to view the change over time in the hazard rate is to plot the rate for researchers with a given duration (d) in the field for each year.The
hazard rate for d=\ isMichaelA. Rappa
Yearsin field Yearsinfield
Figure2.2:
Hazard
ratecomparisonfrom
one periodto thenext.interesting because itindicates the probabilityofstickingwith it
among
researcherswho
arenew
to the field.However,
it might also be interesting to seehow much
the hazard ratechangesforresearchers
who
have been inthe fieldsomewhat
longer (e.g., d='b). Thisformofanalysis is illustrated in Figure 2.3. In diagram (a) the hazard rate is generally decreasing
from year-to-year. This implies that, over time, researchers
who
have been in the field forboth one-year
and
five-years are increasinglymore
likely to remain in the field. In diagram(b) the hazard rate is increasing from year-to-year for researchers inboth categories,
imply-ing that over timeresearchers in both casesare increasingly
more
likely to leave thefield.3
Figure2.3:
Change
overtimein thehazardrateforresearchers with one-yearand
five-yearAssessing Tfchrwtogicai Progrtss 5
3.
The
CaseofMagnetic Bubble Technology
The
historicaldevelopment
ofmagnetic bubblememory
technologyserves to illustratethe use of hazard rateanalysis for the purpose oftechnology assessment. Magnetic bubbles
are a solid-state integrated circuit technologysimilar to that of metal-oxide semiconductors
in that they are fabricated in a thin epitaxial layer
grown
on a wafer substrate.The
devices storedata in the form of "bubbles"moving
in a thin film ofmagnetic material.The
bubblesare cylindrical magnetic
domains whose
polarization isoppositeto that ofthe magnetic filmin
which
they areembedded. Bobeck
and Scovil (1971) found the bubbles to be stable across awide range of conditions and movable from point-to-point athigh speed.The
initial patents for a magnetic bubblememory
devicewere filedby
Bell Laboratoriesbetween
May
and September, 1966. Evidence that interest in thenew
technology grewrapidlycan be seen in the flurry ofpatents and papersin the late 196C)s
and
early 1970s.An
extensive bibliography
on
magnetic bubble technology compiledby
Chang
(1975) ofIBM,
identifies 201 U.S. patents issued (see Figure 3.1) and 1132 papers published between 1969
and mid-1974.
Although
anumber
ofindustrial laboratoriesbecame
active in thedevelop-ment
ofmagnetic bubbles during this period, the two firmsmost
intensively involved fromthebeginning were
AT&T
and
IBM.
1
%z
2Figure
3-1
: Cumulative
number
ofU.S. patents issuedfor magneticbubbletechnology.Magnetic bubbles were considered to be an important mid-range storage technology
that could fill the niche between high-speed, but high-priced semiconductor
memories
andlow-priced, butlow-speed tapeand disk
memory
devices (Feth, 1976).Along
with magneticbubbles, there were a
number
ofother "gap-filler"memory
storage technologies under development during the 1970s, such as charged-couple devicesand
fixed-head disks (seeFigure3.2). Magnetic bubble technology wasconsidered an attractive alternativeto existing
magnetic disk and tape systems, in part, because it gready reduced mechanical
movement
(Mees, 1976).MichaelA. Rappa
100
)L
accesstime(seconds)
high-speedsemiconductortechnologies
W//////^ gapfillertechnologies
WMJMMA
low speeddiskandtapetechnologiesFigure3.2: Price/performance comparison
of
storagetechnologies (Feth, 1976).In the span of a few years,
magnetic
bubbles hadbecome
touted in the technicalliterature zs an emerging technology withsignificant commercial potential. Predictions for
magnetic bubbles in the early 1970s were uniformly optimistic.
Bobeck
and Scovil (1971)believed that magnetic-bubble
memories would
be "substantially cheaper than corememo-riesand up to 10 timesfaster than magnetic-disk
memory
systemsnow
widely used for high capacity storage."The
expectations within the researchcommunity
for magnetic bubbletechnologywere echoed in a report by the (U.S.) National
Academy
of Sciences in 1972:Magnetic bubbletechnologyoffers a radical new waytostoreinformation in thin, transpar-entmagneticcrystaJs and to perform logical operationsby thecontrolled motion of
AssessingTechnologicalProgrfs! 7
diskfilememoriesincomputers andelearoniccentral officesand interface directlywith fast semiconductor memories. They mayproveto beaveryfast,compact,and inexpensiveway
tostoreandprocessdata.
By
1976, it was reported thatsome
firms had initiated or expanded pilot productionlines
and
that experts were confident that several commercial deviceswould
be introducedwithin a year (Torreno, 1976).
The
enthusiasm for magnetic bubble technologywas
attributed to a
number
of factors, including: a decline in the cost of wafer substrates,making
it competitive with the cost ofsiliconmemory
devices; the discovery ofnew
bubble films that could bemore
readilygrown on
wafers; newly developed circuit designs thatenabled the use ofstandard semiconductor manufacturing
equipment
as well as higher storage densities;and
the development of standard packages similar to those used withsemiconductor
devices.A
group of leading magnetic bubble researchersfrom
AT&T
assessed the future prospects ofthetechnology in the followingmanner:One
questionthatcanbe askedis "Willbubblessurvive thetestandjointheselectwinner's circle in memory technology?"The present authors,although admittedly stronglybiased, believe they will because they have developed within a relatively short time into an inte-gratedmemorytechnology ofelegant simplicitywhich is nowreadytofillanexistinggapinthe memory cost versus access time spectrum. Most importantly, however, is the future
growth capabilityofthistechnologywhich...will, webelieve, lead to the ultimate
replace-ment for those marvelous mechanical whirling dervishes, the moving head disk and tape
memories. Deeds not words will be the ultimate proof (Bobeck, Bonyhard and Geusic, 1975).
This
optimism
was sharedby
industryexpertswho
anticipated magnetic bubblestoragedensities to increase even
more
rapidlythan semiconductormemory
technology. At a timewhen
semiconductormemory
deviceswere being produced withdensities in the range of4-to l6-kilobits, it was reported in
1976
thatone
company
would
begin shipment of100-kilobitbubble
memory
devices byearly1977
(Torreno, 1976). It wasalso predicted thatby
1980, there
would
be magnetic bubble devices with 128-kilobitdensities and a 40-percent decline in prices. In comparison, predictionswere
made
for l6-kilobit semiconductor random-accessmemories
and similar price decreases over thesame
time period (Feth,1976).
Although
the future ofmagnetic bubbles certainly appeared bright, by themid-1970s
therewere
still anumber
ofissues to resolve before the technologycould gain widespreadacceptance.
As
Cohen
andChang
(1975) stated:Greatprogresshasbeen made inthedevelopmentof magnetic bubbledevicesinthe period
from 1967.... However, thequestion ofwhether bubble memories willeventually be used for largecapacity(>10"bits)computermemorystorage(e.g.,as areplacementformagnetic
diskfiles) isstillopen,and depends onfuture technical progress.
The
cautious tone of their remarkswas
well-founded.The
high expectationsmost
experts held for the commercialization ofmagnetic bubble technology never fully
material-ized.
Numerous
technical problems that researchers sought to resolveprovedmore
difficultthan initially estimated.
The
slowing pace of progress in magnetic bubblesmade them
increasingly less attractive than other
memory
storage technologies.By
the early 1980s,8 MichaelA. Rappa
advanced at such a rapid pace chat the once perceived "gap" in the storage technology spectrum had closed.
4.
Data
At present, data that could be readily used in the hazard rate analysis of a newly emerging technologyare rarely collected in a comprehensive and systematic fashion. This is understandable, since data on the duration of
commitment
by
individual researchers to thedevelopment ofa technology
would
require a fairamount
ofeffort to collect and maintainon a continuous basis over a large
number
ofyears.Although
datamay
exist in thearchivesof
government
funding agencies and industrial firms, the population ofresearchers activelyworking
on
a given technology is typicallysufficiently largeand
widely dispersed tomake
country-by-country,
and
firm-by-firm datacollection impractical.In thefuture, duration data
may
become
part of thenormal
data collection activities ofgovernment
scienceand
technology agencies. Until then,we
can use a proxy for individualdurationdata: namely, data
on
the span of author contributions to thescientific andtechni-cal literature. Publications in a field represent a fairly well detailed, self-reported archival
record generated
by
researchers in their efixjrt to solve the scientificand
technical problemsconfronting them.
As
a source ofdata, clearly itwould
be very difFicult tomatch
thecom-prehensive scope
and
longitudinal nature of the literature using other data collection techniques.When
taken together, theliteraturecan be viewedasa unique chronologyofthe globalefforts ofresearchers toestablish anew
field, and can be used todetermine thepersis-tence ofresearchers through an examination of their "contribution-spans": i.e., the time spanbetween a researcher's first and last
known
contribution to theliterature in a field.Although
data extractedfrom
the literature will reflect the idiosyncrasies of publication behavior tosome
degree, themeasurement
ofcontribution-spans is relatively unaffected bypublication frequency. Researchers simply
must
publish at least periodically in order toestablish aspan oftheir activity. In this
manner
contribution-span data can provideuswithan approximation ofresearchers' persistence in a field. Clearly, in the absence of
more
precise data, the literature is avaluable source ofinformation about thelevel ofactivityand
rateof progress in a field. Indeed, it is not unusual for researchers themselves to see a
con-nection
between
the literature and progress in their field. For example, early in theemergence of magnetic bubble technology, Bobeck, et al. (1971) state: "It is evident
from
thenumber
of papers concerning all aspects of magnetic bubbles technology that have appeared in the last year that the rate of progress in this comparativelynew
field hasremainedata highlevel."
A
commercially available electronic database (INSPEC) covering the science andengi-neeringliterature
was
used to identify publications in the field ofmagnetic bubblememory
devices.
The
database was searched on-line using aset of key terms thatwereknown
to becommonly
used in the lexicon ofmagnetic bubbles researchersand
might be either in thetide, abstract, or classification terms ofa document.
The
computer
search identified overtwo-thousand
documents.
The
documents
were retrieved electronically and temporarilyplaced in a bibliographic database operating on a personal computer. Each
document
wascarefully inspected in order to ensure the accuracy
and
integrity ofthe search procedure.Documents
that did not pertain to magnetic bubbles orwere
not research-oriented contributions were discarded. After inspection, the database consisted ofa total of2025
documents.AssessingTechnologicalProgress 9
The
documents were
first edited to ensure consistencyamong
author and affiliationnames.
The
edited databasewas
then used to identify 1734 individualswho
contributed tothe field over two decades,
from
1969 to 1988.A
statistical databasewas
created consistingof each researcher, the years they
were
active in the field,and
the length of theircontribution-span.
The
contribution-span is calculated as thenumber
of years that haveelapsed from the first to the last
known
publication for each author. Authorswho
publishinonlyoneyear aregiven a contribution-span ofoneyear.
The
calculation of contribution-spans is fairly straightforward. Nonetheless, sinceauthors do not always publish in consecutive years,
some judgment
is necessary todeter-mine
when
an individual is likely to have ceased active research in the field. Previousanalysisofthe frequency ofyearlygaps between publications for authorswith contribution-spans of
more
thanone
year indicates that the time elapsed without publication is usuallyno
more
than three years(Rappa and
Garud, 1992). Thus, for analytical purposes, allcontribution-spans with gaps of
no
more
than three-years are treated as a contiguous span. In caseswhere therewas a publication gap longer than three-years, theauthoris consideredto have exited and then subsequently re-entered thefield.
5. Results
An
analysis ofauthor contribution spans in thedevelopment ofmagnetic bubblesshowsthe rapid growth and decline ofactivityin the field. Figure 5.1 indicates the risein
partici-pation between
1969 and
1976,when
the field peaked with426
individuals active.Subsequent to 1976, the level of participation began to decline
—
remarkably so after1979
—
such thatby 1988 therewerejusta few dozenauthorsstill contributing to the field.500
400
300
200
100
Figure 51:
Growth of
themagnetic bubbleresearchcommunity, 1969-88.About
two-thirds of the authors in the databaseare industrial researchers. Authorsaffil-iated with U.S. organizations constitute slightly
more
than halfoftotal population.The
other
most
represented countries are Japan (19.7%), Great Britain (8.0%), the formercontribu-10 MichaelA. Rappa
cion-spans ofonly one year.
About
10%
have contribution-spans ofmore
than five yearsand
2.5%
havespans ofmore
than ten years.The
longest contribution-span is seventeenyears.
The mean number
of authorships in a single year is 1.1 (s.d.= 1.0),and
the largestnumber
is 12.The mean number
ofpublications over an entire contribution span is 3.9(s.d.=5.4), though
57%
ofall authors havingjust one publication in the field.The
largestnumber
of authorshipsby asingle individual is 57.The
largestnumber
ofauthorsaffiliatedwith an organization is 117.
The
first step in the analysis was tomake
a non-parametric estimate of the survivalfunction for each year from
1974
to 1985.The
calculations weremade
using the lifetableapproach.
The
results are illustrated in Figure 5.2.To
simplify the graphics, theyears1974
and1978
were selected as representative of the situation before and after the peak year,1976.
The
survival functions areshown
in diagram (a).A
clear shiftupward
of the survivalcurve occurred between
1974 and
1978, indicating an increase in the probability ofresearcherssuying in thefield. In
1974
the probability ofstaying in the field for five yearswas approximately .50. This
compares
with a probability ofabout .75 in 1978. Thiscon-trasts with the change in the survival curve after 1978 is illiistrated in
diagram
(b).The
survival curve shifted
downward
such that the likelihood of contributing to the field for fiveyearsdeclined from .75 in 1978 to about .53 in 1982.
1 5
ContributionSpan (Years)
5 10
Contribution Span(Years)
Figure 5-2: Changesinthesurvivalfunctionofthemagnetic bubble
community
fi'om (a)1974
and 1978 and
(b)1978
and
1982.Non-parametricestimatesofthe hazard functions werealso calculated using the lifetable
approach.
The
results areillustrated in Figure 53.The
hazard functions for1974 and
1978are
shown
in diagram (a).Over
the five-year period the hazard function generally shifteddownward.
The
probability of authors ceasing to contribute to the field in 1974, afterhaving been in the field for five years, was approximately.36. This compares with a
condi-tional probability ofabout .1 1 in 1978.
The
hazard rate for authors with one-yearAssessingTechnologicalProgress 11
The
change in the hazard rate between1978
and 1982 is illustrated in diagram (b) of Figure 5.3. In the five years subsequent to 1978, the hazard function shiftedupward
forauthorswith one-year contribution-spans, but generally shifted
downward
for authorswithspans longer than five years.
The
likelihood ofexiting after a one-year contribution-spanmore
than doubled from .19 in 1978 to .41 in 1982. However, thehazard ratefor authors with five-year spans is unchanged.What
is curious are the high hazard rates in1982
forauthorswith contribution spans of 12-13 years. This
may
be caused the retirement ofmore
senior researchers in the field, but this is not necessarily the case. Priorhazard ratestudiesof other fieldsdo
not support this explanation (e.g.,Rappa
and
Garud, 1992; Rappa, Debackereand Garud, 1992).ConcributionSpan (Years)
5 10
Contribution Span (Years)
Figure 5.3: Changesinthehazardfunctionofthemagnetic bubblecommunity
from
(a)1974
and
1978 and
(b) 1978
and
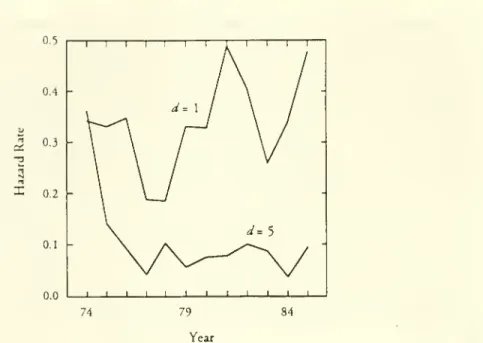
1982.The
changem
the hazard rate over time for one-year and five-year contribution-spans {d=\ and d=5) were calculated for the periodfrom 1974
to 1985 (see Figure 5.4). In the case of authors with one-year contribution spans, the hazard rate varies greatly over time.Initially it declines from about .35 in
1974-76
to about .20 in 1977-78. After1977
thehazard rate increases dramatically from .20 to .50 in 1981. Interestingly, the rate decreases
again to a low of about .25 in 1983, before rising again to near .50 in 1985. Generally speaking, the hazard rate is higher in the post-1978 period. In the case of authors with
five-year contribution-spans, the hazard ratedeclined rapidly from over.35 in
1974
to about .15in 1975, to a low ofabout .04 in 1977. After 1977, the hazard rate remained fairly stable
from .04 to .1 through 1985.
6.
D
iscussionToday, the assessment ofemerging technologies is frequentlya matter of sorting-out expert judgment. Technical
and
market experts are asked to provide their best sense of12 MichaelA. Rappa
Year
Figure 5-4:
Hazard
ratechangesfrom1974
and
1985
for authors with one-yearand
five-year contribution-spans.judgment
isno
simple matter.A
number
of problems can arise in the interactionbetween
experts
and
managers,and
among
experts themselves, that can affect the accuracy ofthejudgments they make.
Several techniques have been developed to mitigate the element ofbias inherent in the
solicitation ofexpert opinion
(Kahneman,
Slovicand
Tversky, 1982; Armstrong, 1985;Cooke,
1991; Porter, et al., 1992). Nonetheless, adilemma
remains in the expert appraisalof
emerging
technologies. Expertswho
are themost
knowledgeable about a technology—
because they are involved in its development
—
aremore
likely tomake
optimisticpredic-tions about its progresstoward commercialization. This isdue, in part, to the difficultysuch
experts have inseparating
what
theywant
tohappen from what
theythinkwill happen.However,
to resort to expertswho
are less knowledgeable about the technology—
because they have little actual experience with its
development
—
does little to resolve theproblem.
Not
only might theysimply notknow
enough
tomake
accurate judgments, theymay
also have theirown
commitments
to alternative technologies that blindthem from
seeing the benefits ofthe technology they are asked to appraise.
Much
ofthe technical de-bate thatsurrounds an emergingtechnologyisembedded
in the conflictwhich arisesamong
those experts
who
have a vested interest in seeing it develop, and those expertswho
have avested interest thatisdiametricallyopposed.
Theoretically speaking, theemergence ofa
new
technology should not be as difTicult tocomprehend
asitsometimes appears.The
technologies thatwill be ofthe mostsignificance five-to-ten years fromnow
alreadyexist in research laboratories, albeit in a primitive form.Technologies
do
not emerge instantaneouslyfrom
idea tocommercial application—
regard-less ofthe impression publicists
may
create. Typically, several years, ifnot several decades,may
intervene prior to widespreadcommercial
use. Technological development is a slowtech-Assessing TfchnologicaiProgress \3
nologies will be increasing in their
momentum
toward commercial application, while other (perhaps once very promising) technologies are decreasing in theirmomentum.
One
ofthe principlechallenges in assessingemerging technologies is to accuratelyascertain, on aglobalscale, changes in a technology's rate ofprogress toward commercial application.
We
will neverdo away
with experts and their judgments about technology.Beyond
how
we
select expertsand
solicit their opinions, the critical question is whether or notwe
canimprove
upon
the information available to managers (and experts)when
formulatingjudg-ments in technologyassessment. In this regard, hazard models
may
shedadditional light onthe relative rate of global progress in the emergence of
new
technologies. In essence, thesurvival
and
hazard functions for a fieldrepresent theaggregatejudgmentsofall the experts, researchers, managers, and otherswho may
havea stake in thetechnology's development.The
results ofthe present empirical analysis,which
uses contribution-spans as asurro-gate
measure
for researcher durations in the field of magnetic bubble technology, are suggestive. In the case ofthe survival function, there appears to be a general concurrence with theoretical expectationsofhow
it shouldshift over time.The
survival function shiftedupward
as the fieldexpanded
and enthusiasm grew. After 1978, however, the functionshifted
downward,
reflecting thediminished interest in the field.The
evidencefrom
the hazard rate analysis is less clear. Although the hazard rate diddecline substantially for authors with one-year
and
five-year contribution-spans prior to1978, after
1978
itwas
only in the case of authors with one-year contribution-spans that the hazard ratesubsequently increased. This finding issuggestiveofthe significant influence that accumulated experience in field can haveon
individuals in reducing the likelihood oftheir exit
from
a field.The
empirical findingsmust
be interpreted in light ofthe inadequacies ofscientific andtechnical literature.
The
omission ofresearcherswho
are either unwilling, uninterested orunable to publish or present their research is clearly
one
limitation.While
the analysis isrelatively insensitive to a researcher's publicauon frequency
beyond
some
minimal level toestablish the contribution span, it cannot account for only those individuals
who
do
not contribute to the literature. Ideally, duration data collectedon
a regular and comprehensivebasis
would
be themost
useful for such an analysis.Government
and industryshouldseri-ously
examine
the potential usefulness of hazard rate models,and
the possibility ofcollecting duration data for critical pre-commercial technologies as part of the on-going
activitiesto construct
and
disseminatescienceand technologyindicators.Acknowledgments
The
author isindebted to ProfessorRaghu
Garud
(New
York
University) and Dr. Koenraad Debackere(Gent
University) for their help in developing this avenue of research, andProfessors
Thomas
AJlenand Edward
Roberts(MIT)
for theirsupport and encouragement.References
Allison, P.
D.
(1984) Event History Analysis: Regression for Longitudinal Data, SageUniversity Paper Series
on
Quantitative Applications in the Social Sciences, 07-046,Newbury
Park: Sage Publications.14 MichaelA. Rappa
Bobeck, A. H., Bonyhard, P. I. and Geusic,
J. E. (1975) "Magnetic bubbles
—
an emergingnew
memory
technology," Proceedings oftheIEEE, vol. 63, 1 176-1 195.Bobeck, A. H., Fischer, R. F. and Smith, J. L. (1971)
"An
overview of magnetic bubbledomains: material-device interface". Proceedings
oftheAIP
17th Conference on Magnetismand
MagneticMaterials, 45-45 (Reprinted inChang, op cit, 250-260).Bobeck, A. H., Scovil,
H.
E. D. (1971) "Magnetic bubbles". ScientificAmerican, vol. 224,78-90 (Reprinted in
Chang,
opctt,119-1A\).Chang,
H. (1975) Magnetic Bubble Technology: Integrated Circuit Magneticsfor DigitalStorage
and
Processing,New
York:IEEE
Press.Cohen,
M.
S. andChang, H.
(1975)"The
frontiers of magneticbubble
technology", ProceedingoftheIEEE, vol. 63, 1 196-1 206.Cooke, R.
M.
(1991) Experts in Uncertainty: Opinionand
Subjective Probability in Science,New
York:Oxford
UniversityPress.Feth, G. (1976) "Memories: smaller, faster, and cheaper"
IEEE
Spectrum, vol. 13.37-43-Garud, R. and Rappa,
M.
A. (1992)"On
the persistence ofresearchers in technological de-velopment,"Academy
ofManagement
BestPapersProceedings, iG'^-yi'i.Hannan,
M.
T.and
Freeman, J. (1989) OrganizationalEcology,Cambridge,
Mass.: HarvardUniversity Press.
Kahneman,
D., Slovic, P. and Tversky, A. (1982)Judgment Under
Uncertainty: Heuristicsand
Biases, Cambridge:Cambridge
University Press.Lancaster, T. (1990) The EconometricAnalysis ofTransition Data,
Cambridge:
Cambridge
UniversityPress.
Lee, E. T. (1992) StatisticalMethodsfor Survival
Data
Analysis,New
York:John
Wiley&
Sons.
2nd
Edition.Mees, C. D. (1976)
"A
comparison
of bubble and disk storage technologies,"IEEE
TransactionsonMagnetics, vol.
MAG-
12, 1-6.National
Academy
ofSciences, National Research Council (1972) Physics inPerspective, vol. 2, part A:"The
coresubfields ofphysics", Washington,DC,
475-481. (Reprinted inChang, ^/)«>., 221-226).
Porter, A. L, Roper, A. T.,
Mason,
T.W.,
Rossini, F. A., Banks. J.and
Wiederholt, B. J.(1992) Forecasting
and Management
ofTechnology,New
York:John Wiley
&
Sons.Rappa,
M.
A. and Debackere, K. (1992) "Technologicalcommunities
and
thediffusion ofknowledge",
R&D
Management,
vol. 22, 209-220.Rappa,
M.
A., Debackere, K. and Garud, R. (1992) "Technological progress and thedura-tion of contribution spans", TechnologicalForecasting
and
Social Change, vol. 42,133-145.
Rappa,
M.
A. and Garud, R. (1992) "Modeling Contribution Spans ofScientists in a Field:The
CaseofCochlear Implants",R&D
Management,vol. 22, 337-348.AssessingTechnologicalProgress 15
Van
de Ven, A. H. (1993) "Acommuniry
perspective on the etnergence of innovations,"Journal ofEngineering
and
Technolo^Management,
vol. 10, 23-51.Yamaguchi, K. (1991) EventHistoryAnalysis, Applied Social Research
Methods
Series, vol.28,
Newbury
Park: SagePublications.Appendix
Formally, the survival and hazard functions,and the associated probability distribution, are derived as follows (Yamaguchi, 1991): Let 7" be a
random
variable for the duration of the riskperiod foran event(e.g., exitfrom
thefield).Then
the hazardrateh(f) isgivenash(r)
=
limP([
+
M>T>t
IT>t)_
f(0It
~S(0
where
P{t+
At>
T
>
t \T
>
t) indicates the probability that the event occurs during thetime(t, t
+
Af)given chatthe eventdid notoccur prior totime t.The
survivorfunctionS(0
isgivenas:
S(0
= ?{T
>t)=
exp
[
h(«)
du
The
unconditional instantaneous probabilityof havingan event at time t, f(t),which
isalsocalled the probability density functionofT, isgiven as:
P(f
+
Ar
>
7">
t)
fit)
=
lim—
=
hit)exp
'-0
At
I
JAN.
A
lytf^Date
Due
MIT LIBRARIES OUPl
I I lllll III lllllllllllllllll'11'ffi