Reconstructing export production at the NE Atlantic margin: potential and
limits of the Ba proxy
Nathalie Fagela, Frank Dehairsb, Rolf Peinertc, Avan Antiac, Luc Andréd a
Clay and Paleoclimate, Geology Department, Université de Liège, B18 Sart-Tilman, Allée du 6 Août, B-4000 Liège, Belgium
b Analytical Chemistry Department, Vrije Universiteit Brussel, B-1050 Brussels, Belgium c Institut für Meereskunde, D-24105 Kiel, Germany
d Mineralogy and Geochemistry Department, Royal Museum for Central Africa, B-3080 Tervuren, Belgium
Abstract
Barium (Ba), aluminium (Al), and zirconium (Zr) were measured in sediment trap material deployed at two margin settings of the NE Atlantic : the Bay of Biscaye at Goban Spur and the NW Iberian Margin. The Particulate Organic Carbon (POC)/Ba ratios of the trapped material in both margin environments are clearly higher compared to the open ocean. Although lateral advection of POC may partly explain these higher POC/Ba ratios for margin systems, it is clear that the yield of authigenic particulate Ba during organic matter degradation in the water column is lower in margin environments. In order to assess export production in margin settings we optimised transfer functions based on trapped Ba fluxes that were originally elaborated for open ocean settings. Calculations of export production based on trapped Ba flux and POC/Ba ratio were compared with calculations based on trapped POC flux only. Export production based on Ba flux show greater internal consistency amongst traps along the same mooring, suggesting that this approach has advantages over the one based on POC flux only. Estimated export productions are of the same order of magnitude as estimates of new production, but systematically fall short of the latter. This systematic discrepancy needs further investigation.
Keywords: Atlantic Margin ; sediment traps ; geochemistry ; barium ; export production
1. Introduction
The water column flux of particulate excess Ba (Baxs = authigenic barite and other biogenic Ba phases) has been used to compute export production via the application of different algorithms (Dymond et al., 1992; François et al., 1995, Nürnberg, 1995). These algorithms rely on the vertical evolution of the Particulate Organic Carbon (POC)/Baxs ratio in sediment trap samples. For the open ocean environment, the approaches based on the Baxs flux as predictor variable produce results similar to those based on the POC flux. However, it has been argued that under conditions of potential POC advection, such as existing in the vicinity of margin systems, Baxs rather than POC would be the appropriate predictor for export production (François et al., 1995).
In the present study, selected geochemical data (Al, Ba, and Zr) for sediment trap material collected along the Iberian Margin are discussed and compared with results for the Goban Spur area (northern Gulf of Biscay) published earlier (Fagel et al., 1999; Dehairs et al., 2000). By comparing these areas of the NE Atlantic Margin, which contrast in terms of shelf and slope morphologies, we aim at evaluating: (1) the regional variability of the impact of lateral advection on trap fluxes, and (2) the feasibility of export production calculation in close-to-margin settings, as based on trapped Baxs fluxes. The latter objective requires verifying whether the higher POC to Ba flux ratios we reported earlier for the Goban Spur Margin as compared to the open ocean (Dehairs et al., 2000) are local features, or to the contrary, are characteristic for the broader region, therefore justifying the development of a transfer function specific for the margin environment.
1.1. Site description
Between July 1997 and December 1998, sediment traps were deployed at 600 m and 1100 m depth at two sites off the Iberian Margin (OMEX II programme): site IM2 at the upper slope and site IM3 at the lower slope (Fig. 1 ; Table 1). Prior to this study sediment trap work had been conducted off the Goban Spur Margin, in the northern Gulf of Biscay (OMEX I programme). For the Goban Spur area three mooring sites were studied between July 1993 and September 1995 (Fig. 1; Table 1): site OM2 at the upper slope; site OM3 at the base of the continental slope, and site OM4 in the abyssal plain (Antia et al., 1999).
The Iberian Margin is characterised by a narrow shelf adjacent to a steep slope cut by deep canyons. During summer, the area is characterised by intense wind-induced upwelling at the shelf edge, enhancing primary production and carbon export to the sediments (van Weering et al., 2002). During the OMEX II investigation period, the yearly new production was estimated at 100-120 gC m-2 y-1 (Brion et al., 2003). The maximum tidal
particles throughout an important part of the tidal cycle and keep larger particles in suspension. Such tidal currents, together with internal waves, generate significant turbidity at the shelf edge and the upper slope (Thomsen et al., 2002). Seasonal hydrodynamic conditions control the development of nepheloid layers on the shelf. During summer, any transport of fine particles in nepheloid layers is confined to the shelf edge. In winter, intense downwelling and resuspension during storms induce enhanced transport of resuspended shelf-derived particles over the shelf edge. The extension of intermediate nepheloid layers over the upper slope is evidenced by the high mass fluxes recorded by the IM2 and IM3 traps in winter, especially during March 1998 (Antia et al., 1999).
Fig. 1. Location of the sediment trap mooring sites at northern Iberian Margin (sites IM2 and IM3, OMEX II,
1997-2000) and at Goban Spur in the northern Gulf of Biscaye (sites OM2, OM3 and OM4; OMEX I, 1993-1996). Water depth in metres.
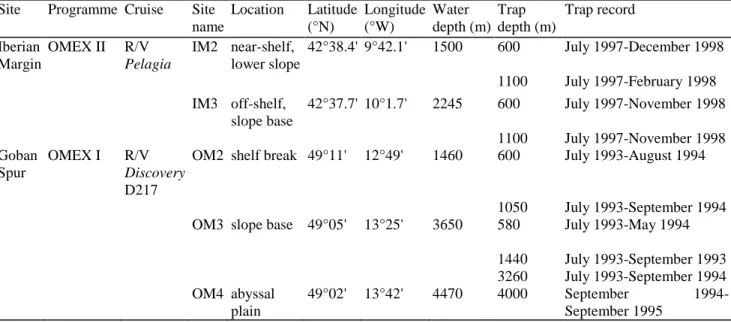
Table 1 Location and operation period of the sediment trap moorings during the OMEX I (1993-1996, Goban
Spur) and OMEX II (1997-2000, Iberian Margin) programmes
Site Programme Cruise Site name Location Latitude (°N) Longitude (°W) Water depth (m) Trap depth (m) Trap record Iberian Margin OMEX II R/V Pelagia IM2 near-shelf, lower slope 42°38.4' 9°42.1' 1500 600 July 1997-December 1998 1100 July 1997-February 1998 IM3 off-shelf, slope base 42°37.7' 10°1.7' 2245 600 July 1997-November 1998 1100 July 1997-November 1998 Goban Spur OMEX I R/V Discovery D217
OM2 shelf break 49°11' 12°49' 1460 600 July 1993-August 1994
1050 July 1993-September 1994
OM3 slope base 49°05' 13°25' 3650 580 July 1993-May 1994
1440 July 1993-September 1993 3260 July 1993-September 1994 OM4 abyssal plain 49°02' 13°42' 4470 4000 September 1994-September 1995
Sediment accumulation along the sediment trap transect varies from 315 to 2296 g m-2 y-1 on the shelf to 31-98 g m-2 y-1 on the middle and upper slope. On the steep upper slope, however, sediment accumulation is close to zero (van Weering et al., 2002). Epping et al. (2002) report that sedimentary carbon oxidation rates are low compared to other upwelling areas (e.g. the Chilean and Peruvian upwelling). Organic carbon oxidation rates in the sediments decrease with water depth, from 11 on the shelf to 2 gC m-2 y-1 at 5000 m (Epping et al., 2002). Anaerobic oxidation ranges from 10 to 40% on the shelf and decreases to <10% below 2000 m, with 5-9% due to sulphate reduction.
In comparison, the Goban Spur Shelf extends as a broad gently sloping platform with a sudden upper slope break at 1400 m (van Weering et al., 1998). An important cross-shelf transport of fine particles occurs permanently within a bottom nepheloid layer (Thomsen and van Weering, 1998). Sediment mass accumulation rates are lower compared to the Iberian Margin (van Weering et al., 1998): from >58 g m-2 y-1 on the shelf to 26-30 g m-2 y-1 on the slope. The upper slope break is characterised by a minimum value of 16.5 g m-2 y-1, reflecting the occurrence of winnowing at that location (van Weering et al., 1998). This part of the slope acts as a source for off- and along-slope transport of fine particles in intermediate and bottom nepheloid layers (Thomsen and van Weering, 1998; van Weering et al., 1998). Input of resuspended and laterally adverted material induced an increase of mass flux with depth (Antia et al., 1999).
New production, estimated to range between 50-80 gC m-2 y-1 (Joint et al., 2000), was up to a factor 2 lower than
reported for the Iberian Margin studied here. For Goban Spur sediments between 200 and 1500 m, Lohse et al. (1998) report sedimentary carbon oxidation rates ranging between 6.6 and 18.8 gC m-2 y-1. Such rates are larger than those measured at the Iberian Margin (see above). Oxic degradation accounts for 68-90% of the total organic carbon oxidation on the upper slope, reaching more than 90% on the lower slope, while sulphate reduction accounts for 7-21% in shelf and upper slope sediments, and less than 5% deeper on the lower slope (Lohse et al., 1998).
1.2. Materials and methods 1.2.1. Sampling and analysis
Sediment trap sampling conditions are described in von Bodungen et al. (1991). For the Goban Spur trap samples, analytical techniques have been detailed elsewhere (Fagel et al., 1999; Dehairs et al., 2000). We have followed a similar procedure for the Iberian Margin samples. Briefly, aliquots of cup suspensions (1/16th of total amount) were filtered under pressure of filtered air on Nuclepore polycarbonate membranes with a pore size of 0.4 µm. The aliquots represented between 50 and 100 mg of dry matter, what is 3-100 times more than for the Goban Spur samples. Filters were digested in a tri-acid mix (HCl/ HNO3/HF) at 80°C.
Major elements were analysed by Inductively Coupled Plasma Atomic Emission Spectrometry (ICP-AES, ARL, IRIS, 35000C). Trace element contents were determined by Inductively Coupled Plasma Mass Spectrometry (ICP-MS, VG Elemental, PlasmaQuad, PQ2 Plus). With a mean dilution factor of 1650, the qualitative (3 standard deviations of the blanks) and quantitative detection limits (defined as 9 standard deviations of the blanks) range between 50 and 500 µg g-1. For Ba and Zr, concentrations in solution exceed 20-300 times the quantitative detection level. Besides the data for Ba, Al and Zr reported here, additional data for major elements (Iberian Margin) and trace elements (both Goban Spur and Iberian Margin) were provided to the BODC database (http://www.pol.ac.uk/bodc/omex) or are available from the authors upon request.
Biogenic, or excess Ba (Baxs), was calculated as bulk Ba content minus lithogenic Ba. The Baxs phase in suspended matter is mainly associated with barite (Dehairs et al., 1980) but also with calcium carbonate, strontium sulphate, biogenic silica and organic matter (Dymond et al., 1992; Schroeder et al., 1997). Lithogenic Ba is calculated using a reference crustal Ba/X ratio with the element X assumed to be exclusively of lithogenic origin (e.g. Dymond et al., 1992). Al is usually taken as the reference element but since Al data were not available for all samples from Goban Spur, Zr was used as the lithogenic reference (Fagel et al., 1999). In the present study we also used Zr as the lithogenic reference element. We considered a Ba/Zr (wt/wt) ratio for shale = 3.095, which is the value for Post-Archean Australian Shales (Ba = 650 ppm and Zr = 210 ppm; Taylor and McLennan, 1985). The concentrations of Baxs calculated using either Al or Zr as lithogenic references differ only by a few percent (Fagel et al., 1999).
2. Results
2.1. Trace element contents and fluxes
For the Iberian Margin the Al, Zr and Ba contents of the individual cup samples vary by a factor of 27-60 (1600<Al<94000 ppm; 2.7<Zr<72 ppm; 28<Ba<1190 ppm) (Table 1). This range of variation is higher than that observed for the Goban Spur traps (Fagel et al., 1999). On average, at the Iberian Margin, Baxs represents <90% of total Ba (IM2: av. 76 and 62% at 600 and 1000 m, respectively; IM3: av. 83 and 80% at 600 and 1100 m,
respectively). The Baxs fraction varies widely over the year and decreases to below 50% in January and March 1998 (Fig. 2). Events with decreased relative Baxs contribution also occur in summer (see July 1997, Fig. 2) but the depletion is less pronounced. At Goban Spur Baxs fractions accounted, in general, for >90% of total Ba (Fagel et al., 1999).
Monthly averaged Baxs fluxes for the Iberian Margin vary between 16 and 2490 nmol m -2
d-1 (Table 2). The highest Baxs fluxes are generally recorded during summer (Table 2; Fig. 3A). Zr fluxes usually range between less than 2 and 523 nmol m-2d-1, but they can reach higher values, with a maximum of 1364 nmol m-2d-1 (IM3, 1100 m, January 1998). A slight difference is observed between sites IM2 and IM3 with, in general, higher Zr fluxes for the upper slope IM2 site. Three samples lay off the main regression trend, with up to 10 times higher Zr fluxes (600 and 1000 m for January 1998 and 600 m for March 98). They coincide with major decreases of the Baxs fraction during winter (Fig. 2).
Zr fluxes at Goban Spur are distinctly lower and less variable compared to the Iberian Margin (usually around 50 nmol m-2d-1 and exceptionally up to 120 nmol m-2d-1 ; Fagel et al., 1999). As a result, the Goban Spur sites are
characterised by larger and also less variable Baxs fractions than those at the Iberian Margin. The cases of sites IM2 and OM2 are compared in Fig. 2.
Fig. 2. Iberian Margin and Goban Spur; monthly-averaged evolution of the relative contribution of Baxs to total
Ba for the 600-m and 1100-m traps at site IM2 (black squares) and site OM2 (open squares; data from Fagel et al., 1999). Note that the sampling intervals are different at both margin sites (see Table 1). The size of the symbols is indicative of the water depth. The horizontal lines represent the monthly averaged Baxs value for each
trap. The arrows point to major detrital dilution events related to winter storms.
2.2. POC/Baxs ratio
Monthly averaged POC/Baxs ratios (Table 2) at IM3 600 m show a clear seasonal evolution with higher ratios during summer-autumn (Fig. 4). Extremely high POC/Baxs values were reached in August, September and November 1997 (ratios of 1705, 1777 and 2552, respectively), but such high values were not observed in 1998 (Table 2; Fig. 4). For both sites this seasonality has largely disappeared at 1100 m (Table 2). POC/Baxs ratios, averaged over the whole sampling period, decrease with depth, but at site IM3 this decrease is small.
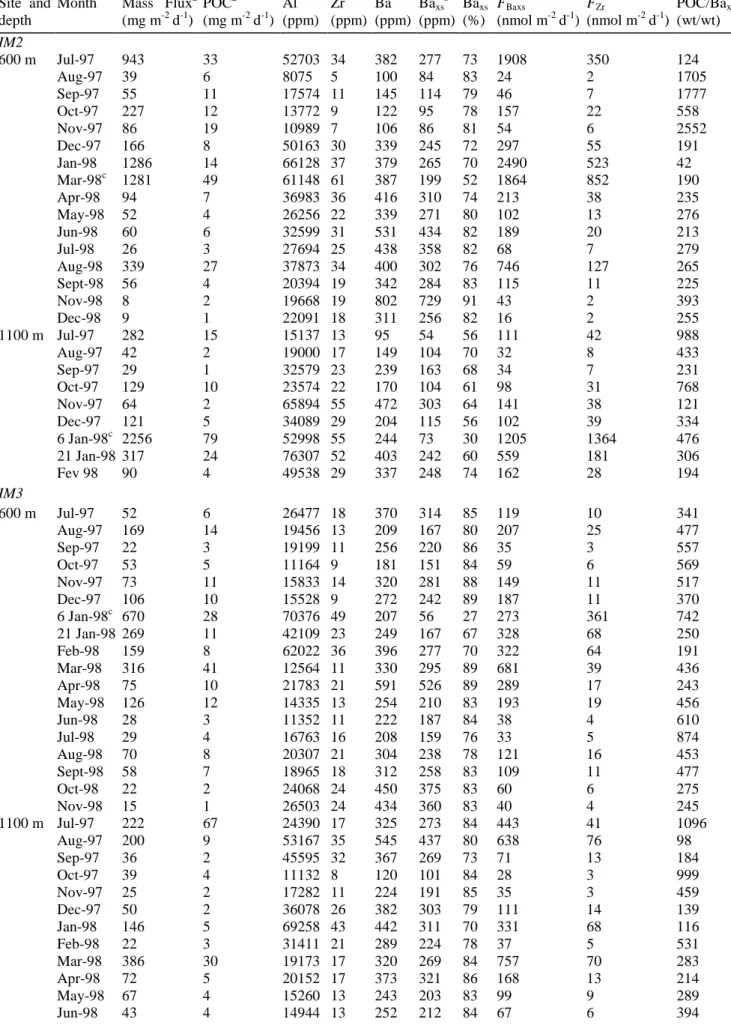
Table 2 Data for IM2 and IM3 mooring sites at the Iberian Margin (OMEX II)
Site and depth
Month Mass Fluxa (mg m-2d-1) POCa (mg m-2d-1) Al (ppm) Zr (ppm) Ba (ppm) Baxsb (ppm) Baxs (%) FBaxs (nmol m-2d-1) FZr (nmol m-2d-1) POC/Baxs (wt/wt) IM2 600 m Jul-97 943 33 52703 34 382 277 73 1908 350 124 Aug-97 39 6 8075 5 100 84 83 24 2 1705 Sep-97 55 11 17574 11 145 114 79 46 7 1777 Oct-97 227 12 13772 9 122 95 78 157 22 558 Nov-97 86 19 10989 7 106 86 81 54 6 2552 Dec-97 166 8 50163 30 339 245 72 297 55 191 Jan-98 1286 14 66128 37 379 265 70 2490 523 42 Mar-98c 1281 49 61148 61 387 199 52 1864 852 190 Apr-98 94 7 36983 36 416 310 74 213 38 235 May-98 52 4 26256 22 339 271 80 102 13 276 Jun-98 60 6 32599 31 531 434 82 189 20 213 Jul-98 26 3 27694 25 438 358 82 68 7 279 Aug-98 339 27 37873 34 400 302 76 746 127 265 Sept-98 56 4 20394 19 342 284 83 115 11 225 Nov-98 8 2 19668 19 802 729 91 43 2 393 Dec-98 9 1 22091 18 311 256 82 16 2 255 1100 m Jul-97 282 15 15137 13 95 54 56 111 42 988 Aug-97 42 2 19000 17 149 104 70 32 8 433 Sep-97 29 1 32579 23 239 163 68 34 7 231 Oct-97 129 10 23574 22 170 104 61 98 31 768 Nov-97 64 2 65894 55 472 303 64 141 38 121 Dec-97 121 5 34089 29 204 115 56 102 39 334 6 Jan-98c 2256 79 52998 55 244 73 30 1205 1364 476 21 Jan-98 317 24 76307 52 403 242 60 559 181 306 Fev 98 90 4 49538 29 337 248 74 162 28 194 IM3 600 m Jul-97 52 6 26477 18 370 314 85 119 10 341 Aug-97 169 14 19456 13 209 167 80 207 25 477 Sep-97 22 3 19199 11 256 220 86 35 3 557 Oct-97 53 5 11164 9 181 151 84 59 6 569 Nov-97 73 11 15833 14 320 281 88 149 11 517 Dec-97 106 10 15528 9 272 242 89 187 11 370 6 Jan-98c 670 28 70376 49 207 56 27 273 361 742 21 Jan-98 269 11 42109 23 249 167 67 328 68 250 Feb-98 159 8 62022 36 396 277 70 322 64 191 Mar-98 316 41 12564 11 330 295 89 681 39 436 Apr-98 75 10 21783 21 591 526 89 289 17 243 May-98 126 12 14335 13 254 210 83 193 19 456 Jun-98 28 3 11352 11 222 187 84 38 4 610 Jul-98 29 4 16763 16 208 159 76 33 5 874 Aug-98 70 8 20307 21 304 238 78 121 16 453 Sept-98 58 7 18965 18 312 258 83 109 11 477 Oct-98 22 2 24068 24 450 375 83 60 6 275 Nov-98 15 1 26503 24 434 360 83 40 4 245 1100 m Jul-97 222 67 24390 17 325 273 84 443 41 1096 Aug-97 200 9 53167 35 545 437 80 638 76 98 Sep-97 36 2 45595 32 367 269 73 71 13 184 Oct-97 39 4 11132 8 120 101 84 28 3 999 Nov-97 25 2 17282 11 224 191 85 35 3 459 Dec-97 50 2 36078 26 382 303 79 111 14 139 Jan-98 146 5 69258 43 442 311 70 331 68 116 Feb-98 22 3 31411 21 289 224 78 37 5 531 Mar-98 386 30 19173 17 320 269 84 757 70 283 Apr-98 72 5 20152 17 373 321 86 168 13 214 May-98 67 4 15260 13 243 203 83 99 9 289 Jun-98 43 4 14944 13 252 212 84 67 6 394
Jul-98 112 8 34793 33 378 276 73 225 41 251
Aug-98 83 6 21530 19 254 192 76 116 17 353
Sept-98 61 4 21045 19 232 174 75 77 12 421
Oct-98 20 2 32993 28 399 314 79 45 6 299
Nov-98 31 2 15844 15 210 164 78 37 5 345
Monthly-averaged Al, Zr, Ba, Baxs concentrations in ppm; Baxs in %; mass and POC fluxes in mg m-2 d-1 (data from Antia et al., 1999); Ba
and Zr fluxes in nmol m-2 d-1; weight ratio of POC vs. Ba
xs. For IM2 1100 m and IM3 600 m, we report the values for the two individual cups
(6/01/1998 and 21/01/1998). For those two mooring sites, the January 1998's estimate is only based on the cup collected the 21st January.
a Data from Antia et al. (1999). b
Excess-Ba calculated using Zr as the lithogenic reference element (Fagel et al., 1999).
c Cup not taken into account in the mean calculation.
Fig. 3. Iberian Margin and Goban Spur; monthly-averaged Zr fluxes vs. Baxs fluxes in sediment trap material
along the NW European continental margin. Enhanced Baxs fluxes related to higher productivity during summer
are circled. The size of the data point increases with trap depth. Note all the individual cup data are plotted. (A) For the Iberian Margin, shaded squares (January, March 1998) highlight unusually high Zr fluxes, reflecting lithogenic material input. Squares: IM2; circles: IM3. The heavy line represents the linear regression trend for site IM3. (B) For the Goban Spur, shaded squares (December 1993; January, February 1994) highlight unusually high Zr fluxes, reflecting lithogenic material input. Squares: OM2; circles: OM3; triangles: OM4. The dashed arrows emphasise the general seasonal evolution of the fluxes for OM3.
Fig. 4. Iberian Margin; seasonal evolution of monthly-averaged POC/Baxs ratio (wt/wt) in sediment trap
material for the 600-m traps at sites IM2 and IM3 (data from Table 2).
3. Discussion
3.1. Importance of lateral advection
At Goban Spur, input of advected material into the traps below 1000 m was clearly evidenced (Antia et al., 1999; Wollast and Chou, 1998). This advection was sustained by nepheloid layers fed by sediment resuspension at the shelf break during occasional winter storms (McCave et al., 2001 ; van Weering et al., 1998). Advection had a strong impact on fluxes of POC and lithogenic matter. For the 1440 m trap at site OM3, Antia et al. (1999) estimated that about 40% of the POC was advected, and Fagel et al. (1999) report highest lithogenic fluxes for the same OM3 site at 1440 and 3260 m. Furthermore, the co-variation of Baxs and Zr fluxes (i.e. increasing fluxes with water depth and enhanced winter fluxes) indicates that part of the trapped Baxs was also advected (Fagel et al., 1999; Dehairs et al., 2000). To avoid erroneous export production estimations in margin systems, the advective input of POC and Baxs to the traps must be corrected.
For the Iberian Margin, we observe larger contributions of lithogenic Ba in the trapped material (Fig. 2) than at Goban Spur. The fact that these larger lithogenic Ba fractions, in general, go along with enhanced Zr fluxes (i.e. enhanced lithogenic fluxes) emphasises the general occurrence of stronger advective transport at the Iberian Margin, as compared to Goban Spur. Furthermore, discrete events of large reductions of the Baxs fraction during winter are more salient at the Iberian Margin than at Goban Spur. This is particularly true for the January and March 1998 events (Fig. 2) which could be traced back to storm action (Antia and Peinert, 1999). From Fig. 3A, it clearly appears that these reduced Baxs fractions during winter at the Iberian Margin are associated with unusually high Zr fluxes that were not observed at Goban Spur. This increased contribution of advected material to the trapped material at the Iberian Margin probably results from the narrowness of the shelf and the proximity of the mooring sites to the shelf break, where storm-induced resuspension of sediments is particularly important in winter (van Weering et al., 2002; Vitorino et al., 2002). From the relationship between Baxs and Zr fluxes at the Iberian Margin (Fig. 3A), it is not clear whether lateral supply of Baxs occurred also outside the peak advection events in January and March 1998.
3.2. Evolution of POC/Baxs ratios with depth and season
Decreasing POC/Baxs flux ratios with depth (Fig. 5) have been reported for various parts of the world ocean, e.g. the North Atlantic (François et al., 1995; Dymond et al., 1992), the Equatorial Pacific (Dymond et al., 1992; Dymond and Collier, 1996), the South Pacific (Klump, 1999). A decrease of POC/Ba ratio essentially reflects decreasing POC fluxes with depth due to mineralisation, but can also result from increasing Baxs fluxes with depth, as is frequently observed. In the latter case ongoing formation of barite in micro-aggregates sinking through the water column might be the mechanism involved. Klump (1999) suggests that the evolution of POC/Baxs ratios mainly reflects an increase of Baxs with depth, based on the fact that Baxs enrichment in margin sediments (Namibia and Chile) increases with water column depth.
The POC/Baxs ratios for the Iberian and Goban Spur Margin systems studied here are systematically higher than the ratios for the open ocean (Fig. 5). For stations close to margins, François et al. (1995) attribute higher POC/Baxs ratios to advection of refractory detrital POC from nearby shelf and slope and argue that advection of
detrital carbon would go without significant advection of Baxs. Therefore, the trapped Baxs flux in margin systems would still be associated with degradation of organic matter produced in local surface waters and thus the Baxs flux rather than the POC flux would allow for proper estimation of export production in regions where strong advection of POC can be expected. The higher POC/Baxs ratios for the 1100-m traps at IM2 and IM3 (Fig. 5) as compared to other margin sites including Goban Spur, are likely to reflect larger advection of POC, possibly due to shelf morphology.
More recently Dehairs et al. (2000) and McManus et al. (2002) reported that higher POC/Baxs ratios in margin systems are probably not solely due to POC advection, but also to a different POC to Ba stoichiometry in these high flux environments. This may be related to the type of biogenic aggregates in which authigenic Ba accumulates and which are controlled by the compositions of the phytoplankton and the grazer communities. It is likely that differences in morphology and size of aggregates exist between margin sites. Indeed, Thomsen et al. (2002) report larger sizes of biogenic aggregates at the Iberian Margin compared to Goban Spur. For margin areas in general and for the Iberian Margin in particular, the water column transit time of such aggregates must thus be shorter and, as a consequence of shorter maturation times, the yield of Baxs in these aggregates would be smaller for the Iberian Margin than for Goban Spur. Furthermore, we observe a clear seasonal evolution of the POC/Baxs ratios at both 600-m traps of the Iberian Margin sites, probably reflecting the seasonal variability of biological factors responsible for barite formation, as suggested also by Dymond and Collier (1996).
Fig. 5. Depth distribution of POC/Baxs ratios; comparison between Iberian Margin data (open circles) with
other areas reported in literature. Closed circles: margin data from François et al. (1995); Dehairs et al., 2000. Squares: Southeast Pacific Margin data from Klump (1999); diamonds: open ocean sites from François et al. (1995); Dymond et al. (1992).
3.3. Calculation of export production
Several authors have proposed algorithms relating POC fluxes recorded by sediment traps with primary production and also new or export production (see e.g. Suess, 1980; Betzer et al., 1984; Berger et al., 1987; Pace et al., 1987; Martin et al., 1987; Sarnthein et al., 1988; Christian et al., 1997) and such models have been applied widely (e.g. Bishop, 1989; Bender et al., 1992; Boyd and Newton, 1995; Jickells et al., 1996). However, it was recognised that because of the labile character of POC, reflected by the strongly decreasing POC signal with depth, a more refractory substitute for POC, such as Baxs would render algorithms for export production more robust (Dymond et al., 1992 and François et al., 1995).
All attempts to use the water column Baxs flux to estimate export of carbon rely on the vertical evolution of the POC/Baxs flux or weight ratio in sediment trap material (Dymond et al., 1992; François et al., 1995; Nürnberg, 1995; Nürnberg et al., 1997):
with F= sediment trap flux of POC or Baxs at depth Z.
function of the deep sea dissolved Ba content. However, François et al. (1995) refute this dependency on deep ocean dissolved Ba content, based on their observation that POC/Baxs ratios are variable even within single oceanic basins having relatively homogenous deep water dissolved Ba concentrations. François et al. (1995) ascribe variable POC/Baxs ratios within single basins rather to advection of POC from shelf and slope and proximity of mooring sites to the margin (see discussion in Section 3.1). For the global open ocean, not affected by margin effects, they noticed that a single set of a,b coefficients describes quite reliably the depth evolution of POC and Baxs fluxes. Optimised coefficients a and b in Eq. 1 (using Gaussian non-linear least-squares computation ; Sigma Plot) using sediment trap data earmarked as open ocean sites by François et al. (1995) are:
a = 4820; b = -0.614 (the POC and Baxs fluxes in Eq. 1 in µg cm-2 yr-1 units). These values are similar to those reported originally by François et al. (1995).
But, as discussed above, it appears that for high flux environments at margins less Baxs is synthesised per unit POC exported. Therefore, we optimised the Eq. 1 coefficients specifically for margin areas using the earmarked margin trap data from François et al. (1995) and also the Dymond et al. (1992) Atlantic Ocean data which, according to François et al. (1995), are characteristic of margin systems. From a Gaussian non-linear least square fitting, we obtain quite different regression coefficient values compared to open oceans: a = 73770; b = -0.85. These values differ from those we published earlier for the same data set and that were obtained from simple trend line plotting (see Dehairs et al., 2000).
A subsequent step to access export production consists in substituting FPOC for FBaxsin transfer functions relating FPOC at depth z with export production via Eq. 1. We will compare the FPOC-export production relationships proposed by Sarnthein et al. (1988) and Martin et al. (1987):
with FPOC = the sediment trap POC flux at depth Z; EP = export production; FPOC100 = the POC flux exiting the upper mixed layer, which is equivalent to export production; Z100 = the lower boundary (100 m) of the upper mixed layer.
Regression coefficients (c, d, e, f) in Eqs. 2 and 3 were optimised via least-square fitting (Gaussian non-linear least-squares computation) using the original Sarnthein et al. (1988) data set for sediment trap POC fluxes and export production: c = 5.58; d = 0.974; e = -0.516; ƒ= -0.886. This approach is similar to the one we discussed in a previous paper (Dehairs et al., 2000), but for which we used original (i.e. non-optimised) regression coefficients, as given by Sarnthein et al. (1988) and François et al. (1995).
For Goban Spur, the observed POC fluxes were corrected for advective input and trapping efficiency, as detailed in Dehairs et al. (2000). For the Iberian Margin, the possible effect of advective input on export production calculations was minimised by not taking into account cups with unusual high Zr fluxes and low Baxs fractions (i.e. see the three high Zr flux cases in Fig. 3A). Trapping efficiencies (as based on 230Th measurements) were assessed for Goban Spur but not for the Iberian Margin. Since shallow traps (<1000 m) tend to under-sample the vertical particle flux (Yu et al., 2001), it is likely that fluxes for the 600-m traps represent minimal values, but we expect data for the 1000-m traps to reflect true fluxes (Antia et al., 1999). We then substituted FPOC in Eqs. 2 or 3 by its expression in Eq. 1. Optimisation of regression coefficients in Eqs. 1-3 via Gaussian non-linear least-squares computation has resulted in export production estimates for the Goban Spur that are no greater than a factor of 2 compared to the values we published earlier (see Section 3.4 and Dehairs et al., 2000).
3.4. Export production at the two margin systems: discrepancies relative to new production
We calculated export productions using both POC and Baxs fluxes (Table 3 ; Fig. 6). For Goban Spur, export production based on FPOC (Eqs. 2 and 3) varied between 8.5 and 28.1 gC m-2 y-1, showing large discrepancies
between estimates based on shallow and deep traps (Table 3). Export production at OM2 appears lower than at OM3. For the Iberian Margin, export production based on FPOC varied between 16.1 and 26 gC m-2 y-1. Discrepancies between estimates based on POC flux data for successive traps on the same mooring reach a factor of 3.3 (OM3, 600 m; Eq. 2). Estimates obtained via Eqs. 2 and 3 compare well, but Eq. 3 results are larger, on average, by 13%.
For the calculations based on FBaxs, we use Eq. 1 regression coefficients characteristic of margin sites. Export productions at the Iberian Margin sites (range 11.2-27.2 gC m-2 y-1; Table 3) are similar to values for Goban
Spur (range 9.0-28.4 gC m-2 y-1; Table 3). Internal consistency of FBaxs-based export productions between traps of the same mooring is better compared to the values based on FPOC. This is not the case for the IM2 site. However, we remind that the 1100-m trap at IM2 was only operational over a restricted period (July 1997 to February 1998; Table 1) compared to all other Iberian Margin traps, rendering comparison of fluxes and
calculated export productions with this trap risky. For the deepest traps (OM2, 3260 m; OM4, 4000 m), export production based on FBaxs are higher by up to a factor 1.9 (OM4, 4000 m) and more consistent with values derived from shallower traps. From our results it appears clearly that calculating export production from FBaxsis to be preferred. This probably reflects the more refractory character of Baxs relative to POC with increasing depth in the water column.
Our calculated export productions represent a significant fraction of new production (≤ 50%), but fall short, in general, of accounting for the new production estimates based on 15N uptake experiments. Possible explanations could be, for instance: (1) the utilised algorithms based on trap fluxes are not appropriate because of their inherent large error on predicted fluxes from the surface mixed layer; (2) overestimation of new production because of utilisation of nutrients mineralised on the shelf, which cannot be considered as new nutrients (Chen, 2003); (3) part of the new production is dissolved organic matter that possibly leaves the upper mixed layer by subduction.
Table 3 Calculated export production along the NE Atlantic Margin, based on POC or Baxs trap fluxes
Site and
depth
Trapping efficiency
FPOC FBaxs ExP via FPOC ExP via FBaxs
(gC m-2 y-1)a (µg cm-2 y-1)b (gC m-2 y-1)c (gC m-2 y-1)d (gC m-2 y-1)e (gC m-2 y-1)f Goban Spur OM2 600 0.38 1.95 0.8 10.1 9.5 14.0 13.2 1050 0.85 2.10 0.7 14.6 16.9 9.0 10.5 OM3 580 0.34 1.79 1.7 9.0 8.5 28.4 25.9 1440 0.98 2.12 1.6 17.4 22.5 20.3 26.1 3260 1.05 1.28 1.2 16.0 28.1 11.3 20.0 OM4 4000 0.7 - 1.4 - - 12.0 22.8 Iberian Margin IM 2 600 n.m. 3.8 1.6 19.9 18.6 27.2 25.1 1000 n.m. 2.9 0.8 19.8 22.3 11.2 12.8 IM 3 600 n.m. 3.3 0.9 17.2 16.1 14.3 13.4 1000 n.m. 3.4 1.0 23.2 26.0 14.0 15.9
Calculations based on POC fluxes used Eq. 2 (Sarnthein et al., 1988) or Eq. 3 (Martin et al., 1987). Calculations based on Baxs fluxes used
Eq. 1, with a and b coefficients characteristic of margin systems (see text) and Eqs. 2 or 3. The trap at the 1100-m site was operational only from July 1997 until February 1998. All other traps were operational from July 1997 until November or December 1998 (see Table 1). Trapping effciency: as given in Antia et al. (1999).
n.m., not measured.
a -Fpoc corrected for trapping efficiency (Goban Spur only) and advection. b Ba
xs flux corrected for trapping efficiency (Goban Spur only) and advection of Baxs. c Export production obtained using F
POC and Eq. 2. d Export production obtained using F
POC and Eq. 3. e
Export production obtained using FBaxs and Eqs. 1 and 2. f Export production obtained using FBaxs and Eqs. 1 and 3.
Fig. 6. Comparison of calculated export production at the Iberian Margin and Goban Spur, based on trap POC
or Baxs fluxes. Export productions based on the trapped POC flux were calculated using Eq. 2 (Sarnthein et al.,
1988) or Eq.3 (Martin et al., 1987). For export production calculations based on Baxs flux, we used Eq. 1 fitted
with regression coefficients characteristic of margin systems and Eqs. 2 or 3.
4. Conclusions
Export productions at Goban Spur and the NW Iberian Margin were estimated using both particulate organic carbon (POC) and Baxs fluxes corrected for advection from the shelf break. The main conclusions can be summarised as follows.
(1) Advection appears to consist of pulsed events occurring mainly during winter. For the Iberian Margin, it is possible that advective transport affected only the POC flux and not the Baxs flux, contrary to the situation at Goban Spur. This possibly reflects the differences in morphology of the two margin systems.
(2) The larger POC/Baxs ratios for both investigated margin systems are systematically larger than for open ocean systems. This is possibly related with reduced Baxs formation per POC unit mineralised as a result of faster particle settling in these margin systems. Furthermore, the strong seasonality of the POC/Baxs ratios implies that export production should be calculated based on yearly averaged fluxes, as stated earlier by François et al. (1995).
(3) This study emphasises the necessity to apply a depth-dependent relationship between POC and Baxs fluxes using regression coefficients specific for margin systems.
(4) Our results for two NE Atlantic Margin environments show quite similar carbon export fluxes. However, for the same mooring site, estimations based on Baxs fluxes at different depths show better internal consistency than estimations based on POC fluxes.
(5) It remains unexplained why estimated export production in all cases falls significantly short of new production.
Acknowledgements
The present study was conducted within the framework of the OMEX II (Ocean Margin Exchange) project, supported by the European Union MAST Programme (contract MAS 2-CT93-0069). We are grateful to J. Navez for his skilful assistance during ICP-MS and ICP-AES analyses.
References
Antia, A., Peinert, R., 1999. Particle flux at the Iberian margin. OMEX II - Annual Science Report 2, pp. 249-255.
Antia, A.N., von Bodungen, B., Peinert, R., 1999. Particle flux across the mid-European continental margin. Deep-Sea Res. 46, 1999-2024. Bender, M., Ducklow, H., Kiddon, J., Marra, J., Martin, J., 1992. The carbon balance during the 1989 spring bloom in the North Atlantic Ocean, 47°N, 20°W. Deep-Sea Res. A, 1707-1725.
Berger, W.H., Fischer, K., Lai, C., Wu, G., 1987. Ocean carbon flux: Global maps of primary production and export production. In: Agegian, C.R. (Ed.), Biogeochemical Cycling and Fluxes between the Deep Euphoric Zone and other Oceanic Realms. NOAA Symp. Ser. For Undersea Research, NOAA Undersea Research Program 3(2), pp. 87-30.
Betzer, P.R., Showers, W.J., Laws, E.A., Winn, C.D., Ditullio, G.R., Kroopnick, P.M., 1984. Primary productivity and particle fluxes on a transect of the equator at 153°W in the Pacific Ocean. Deep-Sea Res. 31, 1-11.
Bishop, J.K.B., 1989. Regional extremes in particulate matter composition and flux: Effects on the chemistry of the ocean interior. In: Berger, W.H., Smetacek, V.W., Weferm, G. (Eds.), Productivity of the Ocean: Present and Past. Willey, New York, pp. 117-137.
Boyd, P., Newton, P., 1995. Evidence of the potential influence of planktonic community structure on the interannual variability of particulate organic carbon flux. Deep-Sea Res. I 42, 619-639.
Brion, N., Elskens, M., Dehairs, F., Baeuens, W., 2003. Kinetics of N-utilization by natural phytoplankton assemblages during upwelling events at the NW Iberian shelf. EGS-AGU-EUG Joint Assembly, 6-11 April 2003, Nice (abstract).
Chen, C.-T.A., 2003. New vs. export production on the continental shelf. Deep-Sea Res. II 50, 1327-1333.
Christian, J.R., Lewis, M.R., Karl, D.M., 1997. Vertical fluxes of carbon, nitrogen and phosphorus in the North Pacific Subtropical Gyre near Hawaii. J. Geophys. Res. 102, 15667-15677.
Dehairs, F., Chesselet, R., Jedwab, J., 1980. Discrete suspended particles of barite and the barium cycle in the open ocean. Earth Planet. Sci. Lett. 49, 40-42.
Dehairs, F., Fagel, N., Antiam, A.N., Peinert, R., Elskens, M., Goeyens, L., 2000. Export production in the Gulf of Biscay as estimated from barium-barite in settling material: A comparison with new production. Deep-Sea Res. I 47, 583-601.
Dymond, J., Suess, E., Lyle, M., 1992. Barium in deep-sea sediment: A geochemical proxy for paleoproductivity. Pale-oceanography 7, 163-181.
Dymond, J., Collier, R., 1996. Particulate barium fluxes and their relationships to biological productivity. Deep-Sea Res. II 43, 1283-1308. Epping, E.H.G., van der Zee, C, Soetaert, K., Helder, W., 2002. On the oxidation and burial of organic carbon in sediments of the Iberian margin and nazaré canyon (NE Atlantic). Progr. Oceanogr. 52, 399-431.
Fagel, N., André, L., Dehairs, F., 1999. Excess Ba advective transport evidenced from trap and sediment geochemical signatures. Geochim. Cosmochim. Acta 63, 2353-2367.
François, R., Honjo, S., Manganini, S., Ravizza, G.E., 1995. Biogenic barium fluxes to the deep sea: Implications for paleoproductivity reconstruction. Glob. Biogeochem. Cycles 9, 289-303.
Jickells, T.D., Newton, P.P., King, P., Lampitt, R.S., Bouttle, C, 1996. A comparison of sediment trap records of particle fluxes from 19 to 48°N in the Northeast Atlantic and their relation to surface water productivity. Deep-Sea Res. I 43, 971-986.
Joint, I., Figueiras, F., Chou, L., Wollast, R., Elskens, M., Fernandez, E., Alvarez Salgado, X., Groom, S., 2000. The response of phytoplankton production to periodic upwelling and relaxation events at the Iberian shelf break. OMEX II, Final workshop, 8-13 May, University of Liège.
Klump, J., 1999. Biogenic Barite as a Proxy of Paleoproductivity Variations in the Southern Peru-Chile Current. Ph.D. Thesis, Bremen, Geomar Report 139, 107 pp.
Lohse, L., Helder, W., Epping, E.H.G., Balzer, W., 1998. Recycling of organic matter along a shelf-slope transect across the N.W. European Continental Margin (Goban Spur). Progr. Oceanogr. 42, 77-110.
Martin, J.H., Knauer, G.A., Karl, D.M., Broenkow, W.W., 1987. VERTEX: carbon cycling in the northeast Pacific. Deep-Sea Res. 34, 267-285.
McCave, I.N., Hall, I.R., Antia, A., Chou, L., Dehairs, F., Hall, I.R., Lampitt, R.S., Thomsen, L., van Weering, T.C.E., Wollast, R., 2001. Distribution, composition and flux of suspended particulate material over the European margin at 47-50°N. Deep-Sea Res. II 48, 3107-3139. McManus, J., Dymond, J., Dunbar, R.B., Collier, R.W., 2002. Particulate barium fluxes in the Ross Sea. Mar. Geol. 184, 1-15.
Nürnberg, C.C., 1995. Bariumfluss und sedimentation im Südlichen Südatlantik - Hinweise auf Proüktivitätsänderungen im Quartär. Ph.D. Thesis, Geomar Report 38, 105 pp.
Nürnberg, C.C., Bohrmann, G., Schluter, M., Frank, M., 1997. Barium accumulation in the Atlantic sector of the Southern Ocean: Results from 190,000-year records. Pale-oceanography 12, 594-603.
Pace, M.L., Knauer, G.A., Karl, D.M., Martin, J.H., 1987. Primary production, new production and vertical flux in the eastern Pacific Ocean. Nature 325, 803-804.
Pfeifer, K., Kasten, S., Hensen, C, Schultz, H.D., 2001. Reconstruction of primary productivity from the barium contents in the surface sediments of the South Atlantic Ocean. Mar. Geol. 177, 13-24.
Sarnthein, M., Winn, K., Duplessy, J.C., Fontugne, M.R., 1988. Global variations of surface ocean productivity in low and mid latitudes : Influence on CO2 reservoirs of the deep ocean and the atmosphere during the last 21,000 years. Paleoceanogaphy 3, 361-399.
Schroeder, J.O., Murray, R.W., Leinen, M., Pflaum, R.C., Jenecek, T.R., 1997. Barium in equatorial Pacific carbonate sediment: Terrigenous, oxide, and biogenic associations. Pa-leoceanography 12, 125-146.
Suess, E., 1980. Particulate organic carbon flux in the ocean -Surface productivity and oxygen utilization. Nature 288, 260-263. Taylor, S.R., McLennan, S.M., 1985. The Continental Crust: Its Composition and Evolution, Blackwell, Oxford, 312 pp.
Thomsen, L., van Weering, T., 1998. Spatial and temporal variability of particulate matter in the benthic boundary layer at the N.W. European Continental Margin (Goban Spur). Prog. Oceanogr. 42, 61-76.
Thomsen, L., van Weering, T., Gust, G., 2002. Benthic boundary layer characteristics at the Iberian continental margin. Prog. Oceanogr. 52, 315-329.
van Weering, T.C.E., Hall, I.R., de Stigter, H.C., McCave, I.N., Thomsen, L., 1998. Recent sediments, sediment accumulation and carbon burial at Goban Spur, N.W. European Continental Margin (47°-50°N). Prog. Oceanogr. 42, 5-36.
van Weering, T.C.E., de Stigter, H.C., Boer, W., de Haas, H., 2002. Recent sediment transport and accumulation on the NW Iberian margin. Prog. Oceanogr. 52, 349-371.
Vitorino, J., Oliveira, A., Jouanneau, J.M., Drago, T., 2002. Winter dynamics on the northen Portugese shelf, Part I. Physical processes. Prog. Oceanogr. 52, 315-329.
von Bodungen, B., Wunsch, M., Füderer, H., 1991. Sampling and analysis of suspended and sinking particles in the North Atlantic. In: Hurd, D.C., Spencer, D.W. (Eds.), Marine Particles: Analysis and Characterization. Am. Geophys. Monogr. 63, pp. 47-56.
Wollast, R., Chou, L., 1998. Distribution and fluxes of calcium carbonate along the continental margin in the Gulf of Biscay. Aq. Geochem. 4, 369-393.
Yu, E.-F., François, R., Bacon, M.P., Honjo, S., Fleer, A.P., Manganini, S.J., Rutgers van der Loeff, M.M., Ittekot, V., 2001. Trapping efficiency of bottom-tethered sediment traps estimated from the intercepted fluxes of 230Th and 231Pa. Deep-Sea Res. I 48, 865-889.