Development of Microfluidic Pipette Tips for Automated
Electroporation
By
Rameech Nashana McCormack B.S. Mechanical Engineering
B.S. Aerospace Engineering University of Central Florida, 2015
Submitted to the Department of Mechanical Engineering in Partial Fulfillment of the Requirements for the Degree
of
Masters of Science in Mechanical Engineering at the
Massachusetts Institute of Technology June 2018
0 2018 Massachusetts Institute of Technology. All rights reserved
Signature of Author...Signature
redacted
Certified by...
A ccepted by...
Signature redacted
Rameech McCormack Department of Mechanical Engineering May 25, 2018
Cullen Buie Associate Professor of Mechanical Engineering
Thesis Supervisor
tiignature
reaactea
MASSACHUSETTS INSTiTUTE OF TECHNOLOGYJUN 2 5
2018
LIBRARIES
ARCHIVES
i Rohan Abeyaratne Professor of Mechanical Engineering Quentin Berg Professor of Mechanics; Graduate OfficerDevelopment of Microfluidic Pipette Tips for Automated Electroporation
by
Rameech Nashana McCormack
Submitted to the Department of Mechanical Engineering On May 25, 2018, in partial fulfillment of the
requirements for the degree of Master of Science in Mechanical Engineering
Abstract
Genetic engineering and synthetic biology are often used to create microorganism that can produce novel pharmaceuticals, biofuels, and other high value compounds. One of the biggest challenges to advancing the field is the difficulty at which exogenous material is transferred to the cells. Flow-through microfluidic technology has been shown to improve the transformation efficiency and the potential to increase the rate of cell transfection approximately 10,OOOX the current state of the art. The next step in engineering the process is to scale the microfluidic technology to one that can be incorporated into a high volume genetic engineering environment similar to those used in industry. In this thesis, the development of a high throughput, scalable design is undertaken. Various iterations of the design scheme are taken into account, such as a continuous-flow design for high volume genetic engineering and a microfluidic pipette that interfaces with preexisting liquid handling systems. The design efficacy is also confirmed with experimental tests. The microfluidic pipette tips out-perform the current state of the art (cuvettes) technology. The maximum output transformation efficiency of Escherichia coli DH 103, for the fabricated microfluidic pipette tips, is 6.4x10 colony forming units per micro-gram of DNA (CFU/ptgDNA).The maximum output performance of the cuvette electroporation process was 2.5x}O CFU/(ptgDNA). The performance of the microfluidic tips is 2.5X the output efficiency of the cuvettes at the same applied potential difference and DNA concentration. Further experiments studied the effects of polarity and applied waveform on the transformation efficiency of Escherichia coli DH10. Results of this work indicate that a unipolar waveform and negative polarities increase the transformation efficiency.
Thesis Supervisor: Dr. Cullen R. Buie Title: Assistant Professor
Acknowledgements
I would like express the greatest gratitude towards my advisor, Professor Cullen Buie, for practicing the highest degree of patience and encouragement. Also, thanks to the entire LEMI research group for their support in all aspects. Thanks to Dr. Paulo A. Garcia and Mahnoor Mirza for their support and collaborative mindset throughout the completion of this work. My sincere appreciation will also be expressed to Leslie Regan for her undying will to help me to succeed.
I will take this time to show my appreciation for my kin and future kin. Your presence and future presence are what motivates me. May you strive to do better, be better, challenge all those that will define you. I hope you will never subscribe to opinions of others. I hope you take steps much bolder than mine and redefine your name.... our name! To Herma, Castel, Shaka, Ricardo, Andre, Demarri, and many, many more!
Contents
Acknow ledgem ents...5
Chapter 1 Introduction ... 14
1.1: Genetic Engineering Overview ... 14
1.2: M ethods to Genetically Transform Cells ... 15
1.3: Genetic Engineering with M icrofluidic Devices ... 17
1.4: Overall Scope of the Thesis... 18
Chapter 2 Prototyped M icrofluidic Devices ... 21
2 . 1: In tro d u ctio n ... 2 1 2.2: Continuous-Flow Device Designs ... 22
2.3: Variation of the M icrofluidic Pipette Tips ... 24
2.4: Fabricated Prototypes... 28
Chapter 3 Flow-Through Electroporation in M icrofluidics... 33
3 .1: In tro d u ctio n ... 3 3 3.2: M icrofluidic Chip Electric Field Distribution in Bilateral Constriction... 34
3.3: Electric Field Distribution in Prototypes... 36
Chapter 4 Electroporation Experiments ... 41
4 . 1: In tro d u ctio n : ... 4 1 4.2: Cell Culture Preparation... 41
4.4: Electropration in Microfluidic Pipette Tips ... 44
4.5: Waveform and Polarity's Impact on Flow-Through Electroporation in Straight Channel M icrofluidic Device at 2.5kV ... 47
4.6: Electroporation of E.coli with Waveform, Polarity, and Applied Voltage Variation ... 58
Chapter 5 Unexpected Phenom ena that Affected Electroporation... 66
5. 1: Introduction ... 66
5.2: Electrode Placem ent and it effect on Transform ation Efficiency ... 66
5.3: Cum ulative Energy Delivered to Cells... 67
Chapter 6 Conclusion ... 70 B ib lio g ra p h y ... 7 2
List of Figures
Figure 1-1 Som e of the lim ited throughtput technologies. ... 15
Figure 1-2: Selection of techniques that have incorporated microfluidic technology for cell manipulation.
... 1 7
Figure 2-1: Flow-through designs for the electroporation process with the geometric constriction that enhances the electric field microorganisms will experience during the electroporation process. .23
Figure 2-2: A depiction of the of the microfluidic pipette tips for use in an automated electroporation process for m icroo rgan ism ... 24
Figure 2-3: Imbedded electrode design for the M FP tips. ... 26 Figure 2-4: Microfluidic pipette tips that utilize a modular approach in its construction...27
Figure 2-5: 3D rendered model of the MFPs that were used in the pipette electroporation experiments... 28
Figure 2-6: Stereolithographic printed microfluidic devices. ... 29
Figure 2-7: Section A shows an experimentalist conducting an electroporation experiment by applying an external potentials difference with the use of a power supply... 30
Figure 3-1: The electric distribution field inside the microfluidic devices that were design by Garcia, P. A. e t al9. ... ... .. . ... 3 5 Figure 3-2: Spatial electric field distribution along the longitudinal axis of the constriction within the MFP tips at variety of voltage ranging from 0.5 to 2.5 kV... 36
Figure 3-3: Sim ulated electric field as a function of time... 37
Figure 3-4: Cumulative electric field versus the normalized residence time and the volumetric flowrate of the suspended cells as they move throughout the MFP tips... 38
Figure 4-1: Petri s froM the electroporation flow-through iL %,I %, I %_J LLLII1 11 VL11 "Ur, i " x m CU~iIL Z.,) I . kA M V aIIU I IUVV 1aLk- Ul -Ad -flw rate _f A.25- V..-4 m /m nin of . coli D H IO P ... 45
Figure 4-2: Plot of the applied voltages and flowrate versus transformation efficiency for E. coli DH I Op in
the M F P tip dev ices...4 6
Figure 4-3: Waveforms used in the experiment to observe the effects of asymmetric pulses on electroporation efficiency ... 48
Figure 4-4: Output waveforms that are created by the function generator at the designed
a-P
values. ... 50 Figure 4-5: The transformation efficiency versus sequence and run in the experiment.. ... 51Figure 4-6: Bar plot of the transformation efficiency indexed to the waveform parameters a and
P
and the devices used during the specific experim ent. ... 52Figure 4-7: The configuration of the electrodes during the positive and negative polarity experiments using the geom etrically constricted m icrofluidic chips... 54
Figure 4-8: Effects of the positive polarity has on the transformation efficiency at the specific waveforms in the PDM S straight channel m icrofluidic chips.. ... 55
Figure 4-9: Effect of applying the negative polarity in the straight channel microfluidic devices for the electroporation experiments against the specific waveforms.. ... 56
Figure 4-10: The transformation efficiency for all
a-P
time spans for the flow-through straight channel microfluidic chips versus polarity with referenced to the cuvettes performance... 57Figure 4-11: Projected response surface created for the a-p time span of the waveform and its effect on the transform ation efficiency.. ... 57
Figure 4-12: Transformation efficiency versus the sequence of the experiment...60
Figure 4-13: The transformation efficiency indexed to the waveform parameters a and
P
applied to the m icro flu id ic ch ip ... 6 1Figure 4-14: Transformation efficiency indexed by the applied voltage, w1aveform parameters, and the
device used during the experim ent... 62
Figure 4-15: Transformation efficiency as a surface response...63
Figure 4-16: The transformation efficiency of negative polarity vs. the cuvette devices...64
List of Tables
Table 1: B enefits of M odel V ariations ... 31
Table 2: Parameter for the flow-through experiment using the geometrically configured 3D printed m icroflu id ic p ipette tips. ... 44
Table 3: The list of parameters introduced in the experiment in order to investigate the impact of polarity and waveform parameters' impact on the transformation efficiency of the E. coli... 48
Table 4: The list of parameter introduced in the experiment in order to investigate the impact of polarity and waveform parameters in addition to voltages' effect on the transformation efficiency of the . c o
li.
... 5 8Chapter
1
Introduction
1.1: Genetic Engineering Overview
Transformation is the process by which exogenous material is introduced into prokaryotic cells. Transformation of bacteria by use of foreign molecules, compounds, deoxyribonucleic acid (DNA) and or proteins into prokaryotic cells is accomplished through various mechanisms. Transformation can occur through naturally occurring phenomena such as transduction and conjugation. Transduction is the transformation of bacteria by means viruses or viral vectors, where the virus have specialized mechanism to transfer genetic material through the cytoplasmic membrane. Conjugation is the transformation of bacteria by means of cell-to-cell contact between a donor cell and a recipient cell. In addition to these two method of horizontal gene transfer, electroporation is a genetic engineering technique that creates an artificially induced environment that enable the permeabilization of the cell's membrane using electrostatic or electrodynamic pulses. The understanding of a very complex reaction such as electroporation is still not fully understood but researcher have theorized as to how bacterial transformation occurs. It is believed that the application of a sufficiently high electric field induces the molecular diffusion of the membrane's lipid bilayer, which allows the formation of pores in the surface of the cell. Diffusion, electrophoresis, electroosmosis, or a combination of these mechanisms then helps the transportation of the exogenous material through the accessible pores of the cell. Additional techniques have been explored for genetic engineering but for application in high throughput environments, current technologies are faced with some limitations in terms of applicability.
1.2: Methods to Genetically Transform Cells
A
Chemical method
;-
isViral Vectors
C Vfus MechanicalB
Electroporation elDttrsI pule-Figure 1-1 Some of the limited throughtput technologies such as chemical transformation (A)', mechanical induced transformation of cells (B)2
, the use of viral vectors (C)3, and conventional cuvette electroporation (D)4.
Figure 1-1 shows a diagram of some of the method used to transform cells. What is characteristic of these technologies is the fact that they are not currently high volume transformation techniques due a variety of factors, which will be discussed. Figure 1-lA shows chemical methodology of transformation of bacteria'. Chemical transformation or chemo-transformation is the process by which the addition of chemical compounds (most prominently divalent cation like magnesium, Mg+2 or calcium, Ca+2
) are added to chemo-competent cells. The addition of the chemicals/ions help to induce transformation of cells and allow for the insertion of exogenous material. Some type of shock mechanism, like a heat pulse, is also used to enhance transformation. The issue with chemo-transformation is that it is applicable to limit variety of specimens. In addition, in order to increase the efficiency some special processing steps maybe needed which can make the process strenuous, hence not adaptable for a high volume transformation environment.
Figure 1-1B shows mechanically induced method of transforming cells2
.In the mechaiial process, it hypothesized that a rapid deformation of the cell membrane induces pore formation and allow exogenous materials to be delivered to the cells. This methodology has been proven applicable to a variety of mammalian cell types such as immune cells and human fibroblast. The limitation of the technology comes about when the desired cell types are significantly smaller, in addition to hard to transform, as in the case of bacteria. Under the conditions to transform bacteria, it is required to have significantly smaller constrictions, which make the technique less practical because of the required dimensions. In addition, the technology has to be translated to a scalable platform in order to transform high volumes of cells. Therefore, the requirements for microfabrication must be removed in the construction of the device if the desire is to mass-produce the devices efficiently.
Figure 1-C shows the use of viral vectors for transformation of cells3
. Viral mediated transformation is the process of using a host viral vector to insert exogenous DNA in to cells. Viral mediated transformation is highly specific and extremely efficient. The issue with the methodology is the unforeseen reactions like cytotoxicity or immunogenicity, due to the presence of the vector used to transfer the exogenous material. In addition, viral vectors have a low packing capacity that limits the size of the base pair that can be inserted in vector, hence also the cells.
Figure 1-D shows a schematic of electroporation in which an applied electric field distorts the cytoplasmic membrane4. The strand of DNA is inserted through the ephemeral pores in the cell's membrane, which is induced by the electrical pulse. The standard for industry and academia is the use of cuvettes in the electroporation process. In this situation, the current state of the art technology, the cuvettes, operate with volume of 50-200 ptL. These minute volumes inhibit the rate transformation of cells, especially under condition when applied to low efficiency cells that are much harder to transform. The additional factors that makes the cuvette electroporation not suitable for high volume transformation is the fact that the technology has not yet been automated. Therefore, cuvettes electroporation has to be completed manually for every specimen. To enhance the efficiency, there has been numerous efforts to incorporate electroporation with microfluidics. Some of the prior technological achievements by other
scientists/engineers that have coupled microfluidic and electroporation are seen in Figure 1-2. This will be further discussed in detail in the next section.
1.3: Genetic Engineering with Microfluidic Devices
A
ROwvMNO C i movement *: L, L2 Li IB
Top dod. Botm~oochmbhr
*hctrP" D a1uOSM
ht; p
Im O I ousf chan, J4 MOM~Figure 1-2: Selection of techniques that have incorporated microfluidic technology for cell manipulation. Image A shows a device used for lysis of bacterial cells by application of an electric field, which could also be used for electroporation to enhance their performance'. Image B shows a flow-through electroporation microfluidic device.6 Image C is a microfluidic cell-lysing device that uses an applied electric field. Image D shows a mechanism that can sequentially insert DNA in a continuous manner by locally trapping cells with vortices7.
Figure 1-2 is a list of various technology that have introduced a microfluidic platform to induce genetic transformation/transfection by application of a potential difference across a microfluidic channel. Figure 1-2A shows a device developed by Wand et al. that enables the amplification of an electric field due to the reduction of the cross sectional area of a microfluidic channel'. The device was used to investigate the regime at which lysis of bacterial cells can occur without the use of lytic agents. An alternative application of the device, as suggested by the authors, is electroporation of bacteria. Figure 1-2B show an excerpt from Huang et al. of a device fabricated to induce flow-through electroporation and single cell manipulation6. (I C SaW6.100th eWcUode Eledrical contea
Figure 1-2C is an excerpt from research published by Lu et al . The microfluidic device constructcd by this group enabled researchers to determine the domain at which lysis of bacterial cells would occur. The authors used high frequency (1-100 kHz) alternating electrical potential differences across electrodes in a microfluidic channel. The electrodes were designed in a saw tooth manner to amplify the electric field at precise regions of the device. Figure 1-2D is an excerpt from Yun et al that used microfluidics to induce electroporation'. The device developed on the microfluidic platform allowed multiple molecules to electroporated in a sequential manner, in the same cell. The technology used a vortex assisted trapping mechanism within the electroporation regions. This enable Yun et al to sequential administer a variety of molecule to the cells in a precise manner. In addition to these, technology developed by Garcia et al, which incorporated geometric constraints in a microfluidic channel that creates a linearly increasing electric field exposure for bacteria'. All these technologies have advanced the genetic engineering microfluidic platforms. The technology developed by Garcia et al is the fundamental basis for the technological achievements discussed further in this thesis9.
1.4: Overall Scope of the Thesis
The aim of this thesis is to introduce a scalable platform for electroporation that can be automated in order to increase the efficiency and rate of genetic engineering. The thesis focuses specifically on the application of microfluidics electroporation to enhance genetic transformation. The thesis also couples the microfluidic technology to 3D printing, which eases manufacturing requirements and removes the need for lithography. The chapters are partitioned in sequential manner to convey the design iteration, theoretical confirmation, and application of the device in the transformation of bacterial cells. The thesis then discusses some interesting and unforeseen correlation between the electrodes configuration and the possibility of optimizing the genetic engineering process in a microfluidic platform.
Chapter 2 introduces the design variations of both the microfluidic pipette tips and the flow through devices. Chapter 3 correlates the prior developed microfluidic chip technology and its connection to the
new devices that enable automated electroporation. Chapter 4 explores the perfom111ance of the microfluidic pipette tip as electroporation device. In addition, Chapter 4 also explores the application of variety of electrical waveforms, polarity and flow rate effects on the electroporation efficiency in the flow through devices and compares them to the current state of the art technology. Chapter 5 explores some unforeseen correlations that have significant impact on the electroporation efficiency. Parameters such as the electrode placement in the flow-through design and the total energy delivered per unit volume are explored. Chapter 6 is the culmination of the work completed. The chapter conveys the best conditions for the flow-through experiment (within the experimental domain). Chapter 6 elaborates on future work that might be completed in order to comprehend the impact of parameters in Chapter 5 and their correlation to the transformation efficiency.
Chapter 2
Prototyped Microfluidic Devices
2.1: Introduction
The prior chapter was short introduction to genetic transformation for prokaryotic cells (or transfection in the case of eukaryotes). The prior chapter's aim was to introduce current technologies that have potential for genetically engineer cells in industry and academia. Chapter I elaborates on the technical drawback/benefits of specific techniques and discusses why electroporation was undertaken in this thesis. Our group's currently technological advancement, the introduction of a flow-through microfluidic electroporation platform that applies a linearly increasing electric field, is introduced as a prominent technology that has significant applicability to enhancing genetic engineering at high volumes.
Chapter 2 focuses on the translation of the microfluidic chip platform to one that is more manufacturable. The term translation is used to describe the process of taking the polydimethylsiloxane (PDMS) microfluidic chip technology that was previously developed and applying it to a more scalable and manufacturable platform that relies less on clean room techniques. The difficulty that arises is the fact that the dimensions of the part are extremely hard to achieve if one chooses to circumvent the lithography process to manufacture the devices. Therefore, some adaptations to the design are introduced. The cross -sectional area of the constrictions are enlarged to approximately 400 ptm diameter and the cross--sectional area is changed to a circular region, which will alters fluid dynamics. The goal of this chapter is elaborate on the design variations for continuous flow genetic engineering and the design of a discrete volume pipette tips that can be used for electroporation in a high volume genetic engineering environment. The term
'continuous flow genetic engineering' is used to describe an environment where biologist or engineers seek to transform large volumes (e.g. milliliters or more) of suspended cells in a continuous fashion. This is contrary to an environment, where genetic engineering is usually completed based on 100 pL, or less, which is more adaptable for the microfluidic pipette tips.
The chapter is structured in order to introduce the design variations of the prototypes by starting with the continuous flow devices and its benefits. Then chapter 2 introduces the translation of the technology to microfluidic pipette tips and discusses the benefits of the various designs. The end of the chapter shows the successful fabrication of working prototypes of both continuous flow and the microfluidic pipette tips fabricated with the use of stereolithographic 3D printing. The chapter ends with a summary of design variations to help the reader quickly assess the design benefits.
2.2:
Continuous-Flow Device Designs
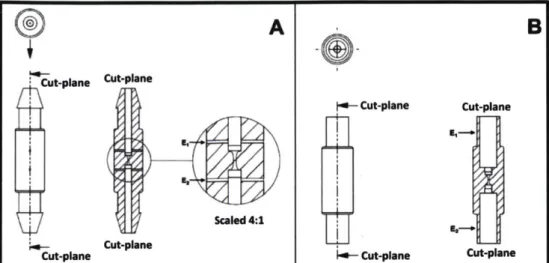
Rapid prototyping by 3D printing was used to manufacture the devices for application in the laboratory experiments. The translation of the technology was initiated by the development of continuous flow devices that obtained the predefined geometric constrictions within themselves. Then the design is extended to variations in the microfluidic pipette (MFP) tips that are compatible with conventional hand held pipettes. The first design iteration proceeds with the schematic depicted in Figure 2-1.
@
A
B
Cut-plane Cut-planeCut-plane Cut-plane
Scaled 4:1
Cut-plane I - Cut-plane Cut-plane
Figure 2-1: Flow-through designs for the electroporation process with the geometric constriction that enhances the electric field microorganisms will experience during the electroporation process. Image A shows a device with a barbed fitting at the tips and cylindrical electrodes perpendicular to the suspension's flow. The cut plane's surface exposes the electrode's (El and E2) placement and the constricted region. Image B depicted the design that relies on insertion of a dispensing needle in to the cavity of the device. The dispensing needles act as the electrodes when inserted in to the device (El and E2). The geometric constriction can also be observed along the cut plane of image B.
Figure 2-1 shows the flow-through devices that are used in some of the experiments conducted in this study. These devices were designed for electroporation of prokaryotic microorganisms in a continuously flowing manner. In addition, the devices were designed in order to transform significantly large volumes of suspended microorganisms. With these devices, the ability to transform numerous liters of suspended cells is now easily achieved in comparison to doing single experiments at with cuvettes. Continuous transformation could be achieved with the use of a peristaltic pump, which removes the volume restrictions. The device with barbed fittings, Figure 2-1 A, is designed to be used with tubing that are biologically compactible with the particular cells being transformed. In our experiment, we have used Tygon Tubing®, which has minimal chemical reactivity with Escherichia coli. Figure 2-1 A has a transverse circular electrodes (El and E2) made of stainless steel or platinum as seen in the 4:1 scaled inset image. The constriction designed in the flow-through devices has the same cross-sectional area variation along the rotational axis as those seen in the assay devices developed by Garcia et.a19. Figure 2- 1B, shows the flow-through device with an insertion region for the dispensing needles. These flow-flow-through devices were designed to accommodate dispensing needles that seal by a compression fitting between the polymer of the device and the stainless steel dispensing tips. The devices allow the dispensing needles' tip to act as
electrodes in the electroporation process. The configuration seen in Figure 2-1B changes the electrodes design to one that is axially symmetric (El and E2 Figure 2-1B.) which provide a more uniform electric field over the cells.
2.3: Variation of the Microfluidic Pipette Tips
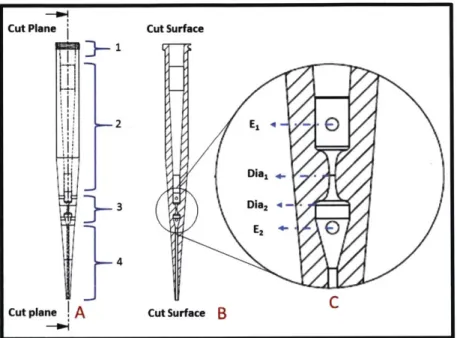
Figure 2-2: A depiction of the of the microfluidic pipette tips for use in an automated electroporation process for microorganism. The device has regions to insert cylindrical wire electrodes. The device is designed to aspirate and dispense precise volumes of suspensions. Region 1 is designed with a luer lock fitting in order to connect the device to a syringe. Region 2 acts as a flow channel and temporary reservoir. Region 3 is the geometrically designed constriction of the device. Region 4 is the liquid interface area. Schematic A is the full depiction of the device, schematic B is the cut plane, and Schematic C is the magnified illustration of region 3. Schematic C shows more detail of the constriction parameters such as the minimum diameter
Dial, maximum diameter Dia2, and electrode placement.
Figure 2-2, is an illustration of the device created to enable the automatic transformation of microorganisms by electroporation. This configuration enables the individual pipettes to aspirate and dispense precise volumes of the microorganism suspension for the electroporation process with use of a connection to the female luer lock (region 1). Alternative design configurations of the microfluidic pipette tips enable the use of different designs at region 1 that allow for quick-connects, interference-fittings, luer slips, and other connectors. The ability to connect the microfluidic pipette tips to a variety of connections enables more method of controlling the fluid flow with various apparatuses. In region 2 of the MFP tip, the
Cut Plane P2
3
u p4 Cut planeA
Cut Surface Dial 4.-E2 Cut SurfaceB
tip act as a reservoir for the suspended cells. First, the cell are aspirated above both electrode before the electric pulse is applied in region 2. The suspension is then dispensed at a precise rate that is designed for the particular microorganism. The pulse is triggered when the flow front of the suspension makes contact with the bottom electrodes (when both electrodes are immersed in the fluid) which reduces the dielectric break down and arcing in the cavity of MFP tip. Region 3 contains the geometrically design constriction that varies along the fluids path. Region 3 also contains the electrodes of the device. The electrodes are cylindrical wires that are placed transverse to the fluid flow during electroporation. Region 4 is a tapered design that allows for minimal surface interaction with the suspension. This enable better aspiration, dispensing, and more precise control over the quantities of fluids that are used during electroporation. Figure 2-2A, show the full design with designated regions of the device. Figure 2-2B shows the cross-section along the symmetric axis of the device. Figure 2-2C, shows the magnified image of the cross-cross-section with depiction of the electrodes (El and E2) and Diameters (Dial and Dia2).
B B Cut plane C Ix D
A
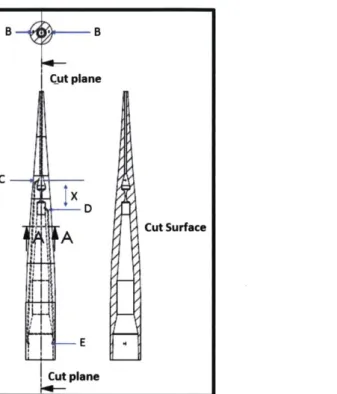
Cut Surface E Cut planeFigure 2-3: Imbedded electrode design for the MFP tips. Line A is plane that show the projection of the cross section above at section B. Section B, the electrode are incase in the polymer or the walls of the MFP tips. The electrodes in this design are separated across the axis of the device. C and D are the locations at which the negative and positive electrodes interact with the flowing suspension of microorganism. E is the location of the electrodes contacts. X is the distance between electrodes.
Figure 2-3 introduces an alternative design of the MFP tip where the electrodes are embedded in the polymer that forms the device during an injection molding process. Figure 2-3 show the labeled schematic with specific areas of interest. Region A in Figure 2-3 is the region where the cross-section can be observed. Region B in the schematic indicates the part of the electrodes encapsulated in the particular polymer chosen for the design. Designated regions C and D are the part of electrode that are in direct contact with the suspension during the electroporation process. Electrodes are supplied with the potential difference at region E when the device is connected to a manifold connected to a control system. The schematic also shows the cut surface or cross-section of the device, which is similar to previous designs.
Cut Plane
Cut Surface
Cut Plane
Plane Cut Plane
Cut Surface
Cut Plane
Cut Surface
Cut Plane
Figure 2-4: Microfluidic pipette tips that utilize a modular approach in its construction. The device is defined in a modular manner in order to increase the feasibility of injection molding by production. Section A shows the reservior of the device and it crossectional area which include the constriction region. Section B is the cap and it crossectional area. Section C shows the method by which the parts intereference.
Figure 2-4 introduces the modular design of the MFP tips. The design portrayed within this figure introduces a more easily manufactured part for a high volume-manufacturing environment. The design follows injection-molding rules: corrected draft angles for easy release, uniform thickness to reduced deformation and warping. The design is split into two regions, section A and section B. These regions can be easily injection molded due to the lack of the designed constriction that leads to encapsulation of the insertion pin in the injection molding process. Section A is the reservoir cavity that contain the specified constriction region of the device that induces the electric field amplification for a particular species of cells. Section A also contains the region of insertion for the manifold in order to introduce a compression or interference fit for a vacuum seal. This upper-region/reservoir of the modular design is energized with wire electrodes that are introduced after production of the part. Section A also shows the cross section of the reservoir region of the modular design. In Figure 2-4B, the cap can be observed for the modular design. This region does not induce any cross sectional modification that amplify the electric field. This region
B
enables precise aspiration of the 100 microliters of suspension. Figure 2-4C show the connection of the modular design during operation. The cap and reservoir are secured by compression/interference fitting. This design is specifically introduced because it could be undertaken without the need for prior additional construction at a manufacturing facility, which reduce the overall cost.
A ~ ~m~% -a
A:
I I / ~1 B C\\
~\W~W
Figure 2-5: 3D rendered model of the MFPs that were used in the pipette electroporation experiments. Section A is the enhanced view of the constriction, which can be observed through the polymer. Section B show shows the entire device with the interference or compression fitting at the base of the MFP. Section C, shows the prospective view of 96 MFP tips being used simultaneously with a liquid handling manifold and a 96 well plate, which would significantly enhance the rate of genetic engineering microorganisms.
Figure 2-5 shows the rendered model of the prototype devices and its incorporation into a scalable liquid handling system. Figure 2-5A and Figure 2-5B show depictions of the prototyped models used for both hand held pipettes and the liquid handling manifolds. Figure 2-5C shows the future perspective a of a high throughput platform for genetic engineering. The use of the tips and liquid handling manifold enable 96 electroporation experiments simultaneously.
2.4: Fabricated Prototypes
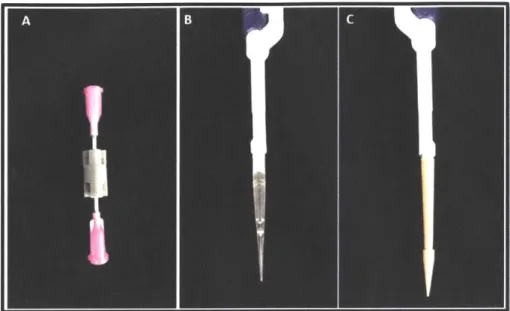
Figure 2-6: Stereolithographic printed microfluidic devices. Section A is a depiction of the flow-through devices, similar to the schematics shown in Figure 2-1A. Section B, shows the 3D printed version of the seen in Figure 2-5. Section C shows the depiction of the modular design of the MFP tip connect to a manual pipette tip. This design is similar to the schematic shown in Figure 2-4.
Figure 2-6 show a variety of 3D printed models and their final configuration. Figure 2-6A shows one of the variations of the continuous flow devices with luer lock dispensing needles inserted into the 3D printed device. Figure 2-6A is similar to that depicted in Figure 2-1B. In this variation of the flow-through device, the external power supply contacts the top and bottom stainless steel metals of the dispensing needles and they act as electrodes. In Figure 2-6B, the device shows the MFP tip's variation for the flow-through designs. The design variation in Figure 2-5B is similar to that in Figure 2-6B. The MFP tip is inserted on to a Rainin 200 ptL single channel manual pipette for illustrations. Figure 2-6C shows the 3D printed modular design that is similar to Figure 2-4. The reservoir of the design is connected to both the cap and a Rainin 200 ptL single channel manual pipette. The method of 3D printing the MFP pipette tips and the continuous flow-through devices has shown to be successful. The major parameters of the critical dimension (the constricted region) and concerns about interference fitting have been solved through repeated design variations and testing during the manufacturing.
Figure 2-7: Section A shows an experimentalist conducting an electroporation experiment by applying an external potentials difference with the use of a power supply. Section B show the scalable production of the variation of the microfluidic devices. (Note: section B's design schematic are not listed in the design variations.)
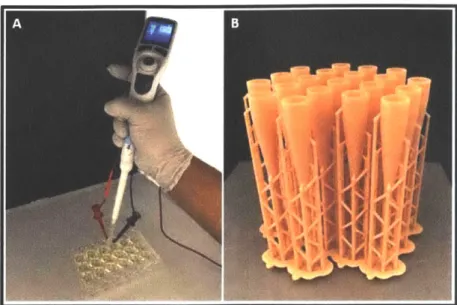
Figure 2-7A shows the use of the MFP tips in operation during the electroporation experiment. Wire stainless steel electrodes are inserted into the MFP tips. The wires connect to the external power supply in order to deliver the pulse during the electroporation process. The electrodes, red and black attachment on the MFP tip in section A, supply an external potential difference. The MFP tip is connects to an automatic dispensing pipette, which controls the flow rates precisely in the experiments. Figure 2-7B shows a cluster of MFP tips printed from biocompatible dental resin using a Formlabs Form 2 desktop 3D printer that uses stereo lithography (SLA) technology. Rapid prototyping of the microfluidic device enhances the flexibility of the design at low cost. The designs are usually constrained by the desired critical dimension (constriction size) versus those that the system is capable of producing. Some aspect of the critical dimensions in the MFP tips, such as the cross sectional area of the constriction, have increased in order to prevent clogging of the constriction.
Overall, successful translation of the PDMS microfluidic chips has been demonstrated concerning manufacturability. Proceeding chapters will elaborate on their capability to genetically engineer bacteria and test the device functionality. To investigate the performance of the design iterations, simulations have been completed to confirm the design variation are still capable of replicating the same electric fields as in
the microfluidic chips. The next section will elaborate on the findings. To assess the device variations and
their overall benefits, Table 1 is added as a quick reference to distinguish between the devices.
Table 1: Benefits of Model Variations
Device Figure
Figure 2-1A
Figure 2-1B
Figure 2-2
Figure 2-3
Figure 2-4
Model Type
Continuous-flow
Continuous-flow
MFP tips
MFP tips
MFP tips
Benefits
" Continuous electroporation of large volumes
" Electrode inserts for material specific interaction
" Continuous electroporation of large volumes
" Dispensing needle used as electrode
" Injection moldable
" paL volume control
" Adaptable to syringes
" Electrode insert
" Adaptable to liquid handling platform
" pL volume control
" Embedded electrodes-compact design
" Adaptable to liquid handling platform
* pL volume control
Chapter 3
Flow-Through Electroporation in
Microfluidics
3.1: Introduction
The prior chapter illustrates the designs of the microfluidic devices that were developed to for flow-through electroporation in a continuous manner. Chapter 2 also introduced the MFP tips that enable electroporation in an automated liquid handling platform. The (MFP tips and Continuous flow) devices all contain the same geometric constrictions, which affect the electric fields experienced by the specimens as
it flows through the device.
Chapter 3 focuses on confirming the translation of the constriction that was previously developed for use with the microfluidic chips. The chapter also compares them to the newly developed prototypes. In the past, the microfluidic chips' constricted regions were prismatic in form. The MFP tips and continuous flow devices have a circular constriction. This chapter seeks to confirmation the designed electric field distribution along the dimension of the prototyped device. In addition, the need to understand the flow rates versus exposure to the amplified electric field needs to be understood.
In Chapter 3, simulation of both the microfluidic chips and the MFP tips/continuous flow through devices are presented. The prototypes developed have similar electric field distribution even though the geometric configu'ration between the microfluidic chip and MFP tips are different within the constricted
region. Simulation of the electric field distribution in crrnhinatinn tn thp fAiid velocity also gives insight
into the impulse experience by the cell as a function of the flow velocity.
3.2: Microfluidic Chip Electric Field Distribution in
Bilateral Constriction
Electroporation of . coli DhlO beta was completed with the use of microfluidic pipette tips in order to investigate the efficacy of the technological translation from laboratory PDMS microfluidic chips. To begin the investigation and compare the microfluidic chips versus the performance of the microfluidic pipette tips, COMSOL Multiphysics@ simulations were completed to ensure that the linear electric fields that were designed in the microfluidic chips could be replicated in the MFP tips. An excerpt of prior work describing the electric field along the microfluidic chips can be seen in Figure 3-1'.
.
r20.0
-V-3.OkV -0.5 0 j17.5 -0.5 -- 1.5kV -1.0 -0 2 12.5 -M 10.0-(a)
Distance from Center [mml
-
-is
'__________________ 7.5-0.2 12 Electric Field IkV/cul 2 .9 5.0 ....- ..
0.0
-1.5 -1.0 -0.5 0.0 0.5 1.0 1.5
S---.--- (c) Distance from Center Immi -1.0 -0.5 0 0.5 1.0
(b)
Distance from Center [mm!
Figure 3-1: The electric distribution field inside the microfluidic devices that were design by Garcia, P. A. et a19. Section (a) shows the distribution of the electric field along the microfluidic device and also the inlet and outlet for the suspension. Section (b) shows a magnified image of the constriction's amplification of the electric field in the microfluidic device. Section (c) shows a plot of the constriction's electric field distribution along the centerline of the channel. By changing the applied voltage or the cross sectional area's dimension, one can control the maximum electric field and the rate at which the microorganism experiences
the applied electric field.
Figure 3-1 is an excerpt from previously published article within the Laboratory for Energy and Microsystems Innovation (LEMI) at MIT, which is the predecessor of this work. In Figure 3-1, the linearly increasing electric field designed in the microfluidic chips can be observed. Figure 3-1 (a) show the electric field distribution along the centerline or the longitudinal axis of symmetric in the microfluidic chip. Figure 3-1(b) shows the magnification of the constricted region to illustrate the spatially incremental increase in electric field along the device. Figure 3-1(c) shows the electric field distribution along the longitudinal axis of the microfluidic chip as a function of various potentials at the electrodes. Figure 3-1(c) shows the linear increase in the electric field potential as a function of distance. In addition, Figure 3-1(c) also shows the amplification of the electric field and the maximum electric field that the flow suspension experience at particular potential difference ranging from 1 kV to 3 kV. For example with an applied voltage of 3 kV, the maximum electric field is approximately 17.5 kV/cm experienced by the suspended microorganism during the electroporation process. The amplification of the electric field reduces the needed potential difference and increases the electroporation efficiency. We extended this theoretical analysis with COMSOL
Multiphysics@ to investigate our new circular design of the constriction region in the microfluidic pipette tips.
3.3: Electric Field Distribution in Prototypes
15.0 - (a) 2.5 kV -- (b)2.OkV
E
12.5 - (c)1.5 kV ---(d)1.0kV 10.0 -(e) 0.5 kV 7.5 U.0 0.0 0.5 1.0 1.5 2.0 2.5 3.0Distance Along Pipette Constriction [mm]
Figure 3-2: Spatial electric field distribution along the longitudinal axis of the constriction within the MFP tips at variety of voltage ranging from 0.5 to 2.5 kV. This confirms the spatial distribution similarity to that of the microfluidic devices build by Garcia, P. A. et al9. The inset image is a 3D spatial distribution of the simulated electric field within the constricted geometry of the MFP tips, which was completed in COMSOL Multiphysics@.
Figure 3-2 shows the spatial distribution of the electrified in kV/cm along the center of the constricted region of the MFP tip. Figure 3-2 also shows an inset image of the spatial distribution in the investigated design of the constricted region within the microfluidic device. The COMSOL Multiphysics@ simulation shows that the design of the MFP tip's constriction successfully translates the microfluidic PDMS chip's constriction to provide a similar configuration of a linearly increasing electric field along the central axis of the device. Figure 3-2 shows the simulated electric field vs. the distance along the centerline of the pipette's constriction. The supplied potential difference in the design varies form 0.5 kV to 2.5 kV and the peak amplification of the electric field varies from 2.5-12.5 kV/cm. The specified design amplification in this design of the constriction is 5X. Therefore, the magnitude of the applied voltage to generate the peak electric field is five times the applied potential difference. Therefore, a 2.5 kV potential difference generates a 12.5 kV/cm peak electric field at the center of the constriction. The simulation has
been extended to investigate the electric fields that are observed as a function of the flow rate of the suspension in the microfluidic pipette tips.
15.0 . --- (a) cuvette - (b) 4.00 mL/min - (c) 2.00 mL/min
-(d) 1.00 mL/min (e) 0.50 mL/min (f) 0.25 mL/min
E 12.5 -> I \ -10.0 2.5 . .... ....
0.0
0 10 20 30 40 50Time [ms]
Figure 3-3: Simulated electric field as a function of time. The microorganism experiences the simulated electric field during the flow-through electroporation experiments in the microfluidic pipette tips. A constant 2.5 kV potential difference has been applied to the electrodes during the simulation. The simulated flow rates range from 0.25-2 mL/min. The cuvettes electroporation electric field, a decay function, is also expressed in the figure as a basis for comparison.
A strongly coupled correlation to transformation efficiency is the velocity/volumetric flow rate of the suspension used during the flow-through electroporation experiment. In Figure 3-3, the electric field experienced by the microorganism as a function of time at discrete flowrates are plotted from the COMSOL Multiphysics@ simulations. The peak electric fields experienced by the cells remain constant throughout all of the simulated flowrates, as expected. The residence time experienced is significantly different between flow rates, which affects the overall electric field exposure of the cells. The residency time is the time span at which the cell is exposed to the amplified electric field. The residency time is the last data point collected on the plot for each particular flow rate. For example, at 2.00 mL/min the residence for this simulation is approximately 19 ms. This residence time is correlated to the amount of energy delivered to the microorganism throughout the experiment. As the volumetric flow rate increases, the residence time decreases in the MFP tips. The plot in Figure 3-3 includes the electric produced by the cuvette system, which is described by a decay function. The decay function has a time constant of 1.5 ms and an applied peak electric field of 12.5 kV/cm. (The same as the peak electric fields were used for the MFP tips). For
the cuvettes, the residence time is approximately 16 ms. To gain a better understanding of the electric field exposure as a function of time and the cumulative effects we have plotted the normalized residence time versus the electric field experienced by the suspension of microorganisms.
- 0.25 mUmin - .0.50 mUmin . 500- 1.00 mUmin . - - 2.00 mUmin 400 -- 4.00 mUmin -- -Cuvette C.,. i E 300 .~200-E. 0-0.0 0.1 0.2 0.3 0.4 0.5 0.6 0.7 0.8 0.9 1.0
Normalized Residence Time
Figure 3-4: Cumulative electric field versus the normalized residence time and the volumetric flowrate of the suspended cells as they move throughout the MFP tips. The applied potential difference is 2.5 kV
throughout the simulation. As can be seen form the plot, the slower flowrates show significantly higher level of cumulative exposure to the cell in comparison to the decay function.
The plot in Figure 3-4 shows the cumulative electric field integral as a function of the normalized residence time. The cumulative electric field integral is the integrated electric field exposure over the residence time of the microorganism. From the figure, at 0.25 mL/min, the integrated electric field integral is approximately 580 kV-ms/cm. The cuvette's cumulative integral of electric field is only 60 kV-ms/cm. Comparing these two experiments, there is approximately a 10 times increase in energy that the cell experience throughout the electroporation process because of its flows at 0.25 mL/min. At a flowrate of 4 mL/min, the cumulative electrified exposure is approximately 43 kV-ms/cm. Which is less energy delivered for the same suspension. The interesting aspect is how the flow rate parameter affects the transformation efficiency during the electroporation experiment. Therefore, to investigate the flow rate correlation to transformation efficiency, an experiment that varies the flowrate and the applied voltages was conducted with the use of E. coli DH10p.
Flow-Through Electroporation in MicrofluidicsChapter 3 emphasizes the distribution of the electric
field along the central axis of both the microfluidic chips and the MFP pipette tips. Overall, simulations have shown that the geometric design of the constriction are similar in terms of electric field distribution, which means that the devices provide the same electric field impulse to the cells. The flow rates used in the simulations show that they are significantly important parameters because of the impulse experienced by the cells. This correlation of electric field exposure versus flow rate will be discuss further in Chapter 5,
where we considered experimental results for the transformation efficiency of the cells. The simulation of the electric fields was successful and the next chapter seeks to confirm the devices' transformation efficiency experimentally.
Chapter 4
Electroporation Experiments
4.1: Introduction:
In the prior chapter, the electric field distribution along the central axis of the MFP tips and the electric field exposure versus time (cumulative electric field) were the most important aspects. Simulations in COMSOL@ confirmed the similarities between the electric field distribution of the prior chip technology and the prototyped devices. The primary focus of Chapter 4 is to introduce the experimental technique used to quantify the transformation efficiency and test the efficacy of the prototyped design. Chapter 4 initially describes the experimental procedures for the cell preparation, and then the chapter describes the experimental processes for the flow-through electroporation conducted. Experimental results for the transformation efficiency versus flowrate and applied voltages are compiled. There is a slight shift in moment as one proceeds throughout the chapter. Variation in the waveform and the polarity as experimental parameters are introduced. These experiments are mainly conducted in the straight channel PDMS microfluidic chips. This shift from the use of MFP tip is because it is hypothesized that these parameters may have significant effect on the transformation efficiency and a basis is needed for comparison, therefore, prior technology is used. Throughout the Chapter 4, data supports the fact that the MFP tips outperform the cuvette technology. Which indicates that the technology introduced in this thesis can sufficiently replace the current start of the art without loss in performance. In addition, it is observe that factors like the polarity
and waveform play a tremendous role in the transformation efficiency.
A sngle ... '5 1 JI R n 1 . JL A-tII %III f Es/Vrhi LI It"%& It4. , &/ I %JF V 4 cl 1 %,111 k V %,AU
~LU%,X
p ,Ll I %A III'- L4,3116 "IIT WAl xHlp was remve stc+k ; A;iihe ing~ aninoculation loop to ensure that all bacteria replicated were from the same mother cell to ensure genetic uniformity. This Stock petri dish was created from a purchased batch DH1IO Escherichia that was maintained at minus 80 degrees Celsius ( C), and then plated onto the surface of 16 ml of Luria-Bertani (LB) medium plus agar in a 60 mm x 15 mm VWR international polystyrene petri dish. The stock colonies were streaked onto the surface of agar plates and stored at 20 C. To start the . coli culture, a single colony was removed from the stock agar plates using a sterile inoculation
loop.
The colony is then transferred to a5 mL cell culture tube that contains 3 mL of sterilized LB. The LB media was prepared with the use of BD
DifcoTM Dehydrated Culture Media at a concentration of 25 g/L of de-ionized water. The LB mixture was autoclaved for sterilization. The 3 ml of suspended cells were shaken at rate of 250 revolution per minute (rpm) at 370C overnight (approximately 10-16 hrs.).
Electrocompetent E. coli Preparation
After the incubation period overnight, 1.25 mL of the cell culture is transferred to a 500 mL Erlenmeyer flask that contains 200 mL of sterilized LB. The cell culture is then incubated for approximately
3.5 hrs or until the cell culture has reach mid log phase (OD6oo=0.5). After the correct OD6 0 0 is achieved, the sample is centrifuged in order to concentrate the F. coli. The cell culture is transferred into six 50 mL centrifuge tubes with equivalent volume (~33mL). The first centrifugation occurs at 3500 rpm for 10 minutes at 4 C. The LB suspension is removed after the cell culture is centrifuged and the plated bacteria is suspended with a 10% w/w Glycerol to water mixture that was stored at 4 C. The cells are then re-suspended with 1 mL of 10% Glycerol for each of the six centrifugation tubes. The 1 mL of 10% glycerol and . coli is then transfer to 1.5 mL Eppendorf tube in order to be centrifuged again in a series of washes using 10% Glycerol. The sample is centrifuged at 8000 RPM for 5 minutes at 4 C. After the 5-minute interval for the centrifugation, the supernatant is disposed and the pelleted bacteria are re-suspended with 10% glycerol. The rinsing of the sample with the use of 10% glycerol is repeated 3 times. After the last wash of the F. co/i, the supernatant is again disposed. The pelleted cells are re-suspended in a total of I mL
of
10% Glycerol. The 0D6 0 0 is mea ur nd nce- the c "ontratin" of the cells is determined, the volumeis diluted to the desired operating concentration for the electroporation experiment.
4.3: Electroporation Procedure for Flow-Through
Experiments
Cuvette electroporation is done with 2 mm gap electroporation cuvettes form VWR international. The Standard operating procedures were followed for electroporation of E. coli during the experiments. 200 [tL of the electro-competent cell in 10% glycerol were pipetted into the cuvettes. (The cuvette were stored in an ice bucket before the procedure in order to increase cell electroporation viability). After addition of the cells, the cuvettes are then inserted in the MicropulserTM Electroporator and the desired pulse is triggered to deliver the electric field. The cuvettes are quickly removed after the pulse delivery and 800 ptL of LB is added to the cuvettes in order to start the recovery process.
For the flow-through experiments, 100 ptL of electro-competent cells are allocated to each experiment. For the electroporation with the use of the microfluidic chips, the suspension are aspirated into Tygon@ tubing of specified internal diameter (1/16 inch) using a syringe. The tubing is not removed from on the syringe. The syringe is then places inside a syringe pump in order to control the flow rate precisely during the experiments. The alternative end of the tubing that contains the electro-competent has a stainless steel tube, which has an external diameter that matches the internal diameter of the Tygon@ tubing. This added stainless steel tube acts as an electrode during the experiment. Two stainless steel tubes are used to complete the circuit during the experiment. One of the electrodes is placed at the inlet and the other at the outlet of the microfluidic chips so that the cells can traverse the constricted region and be collected afterwards. The cells are pressure driven from the tubing to the inlet of the PDMS microfluidic chips were and electric pulse is applied between the inlet and outlet of the microfluidic chip. The sample is collected afterwards into 900 pL of LB to initiate the recovery process.
Electroporation in the MFP tip are similar to that of the flow-through experiment in the PDMS microfluidic chips. The MFP tips are connected to syringe pumps for precise control over the volumetric flowrate. MFP tips have two stainless steel wire electrodes exposed to the 100 pLL of electro-competent cells as they flow through the constriction of the device. As the sample leaves the MFP tip it is collected into a well that contains 900pL of LB media that initiates the recovery protocol.
During the recovery, the sample is incubated in the LB after the electroporation process for I hr. After the 1 hr time has elapsed, the sample is then diluted at a ratio of 10,000 time per OD600. The samples
are diluted with the use of de-ionized water or cell-culture-grade water purchased from VWR. After the dilution, 100 pl of the sample is then plated onto an Agar+Ampicillin plate in order screen for successfully transformed cells. The plates are prepared with the use of Bacto Agar (20 g/L, Difco LB Broth (25 g/L),
and ampicillin at a concentration of 50 ptg/mL. The plate with the electroporated specimens are then incubated at 37'C for approximately 16 hrs or until a preferred diameter of the individual colonies are achieved for easy quantification. The individual colonies are counted with the use of a colony counting
software.
4.4:
Electroporation in Microfluidic Pipette Tips
Table 2: Parameter for the flow-through experiment using the geometrically configured 3D printed microfluidic pipette tips.
Parameters
Values
Flowrate(mL/min)
0.25, 0.5, 1,2 and 4
OD600
10
Conductivity of cells with DNA
Not Measured
Waveform used 5ms pulses (or 95% duty cycle) Control cuvettes parameters 1.25kV, 1.75kV and 2.5kV; =1.5ms
Voltage applied (kV)
0.5,1, 1.5, 2.0 and 2.5
Figure 4-1: Petri dishes from the electroporation flow-through experiment at 2.5 kV and flow rate of 0.25-4 ml/min of E. coli DH 10P. The pulse used in the experiment was 5 ms (or 95% duty cycle). Overall higher flow rates are more desirable for the electroporation experiment as seen by the increase in the density of fluorescent colonies and hence an increase in transformation efficiency.
The experimental parameters are listed in Table 2 for the flow-through experiment using the microfluidic pipette tips. The applied voltage range during the experiment was 0.5-2.5 kV (in increments of 0.5 kV) and flow rates of 0.25 ml/min to 4 m/min (doubled at each increment). The experiment was completed at OD60o equivalent to 10. After the experiment is completed, the concentration of the cell is
diluted 10,OOOX per OD600 in order to quantify the number of cells that are successfully transformed during
the electroporation process. Figure 4-1 (a-f) shows the petri dishes from the electroporation process using the microfluidic pipette tips and the petri dishes obtained from using the cuvettes as a reference. The petri dishes show the colony form unit (CFU) of E. coli DH 1 OP that have successful been transformed during the electroporation process. The DH10p cells do not natively possess the ampicillin resistance nor the ability to fluoresce green. Therefore, the cell's presence on the surface of the agar/ampicillin petri dish confirms successful transformation by electroporation using the MFP tip. From Figure 4-1, the correlation that is discerned is that as the flow rate increases in the device, there is an increased in the transformation efficiency of the MFP tips. The formula for the transformation efficiency: