En vue de l'obtention du
!"#$"%&$'!(')*+,-.(%/-$0'!('$"+)"+/(
Délivré par :
Institut National Polytechnique de Toulouse (INP Toulouse) Discipline ou spécialité :
Interactions plantes-microorganismes
Présentée et soutenue par :
!"#$%&''&#()*+,%--le vendredi 12 février 2016
Titre :
Unité de recherche : Ecole doctorale :
A PROTEASE OF THE SUBTILASE FAMILY NEGATIVELY REGULATES
PLANT DEFENCE THROUGH ITS INTERACTION WITH THE
ARABIDOPSIS TRANSCRIPTION FACTOR AtMYB30
Sciences Ecologiques, Vétérinaires, Agronomiques et Bioingénieries (SEVAB) Laboratoire Interactions Plantes Microorganismes (LIPM)
Directeur(s) de Thèse :
MME SUSANA RIVAS
Rapporteurs :
M. PATRICK GALLOIS, UNIVERSITY OF MANCHESTER M. SEBASTIEN BAUD, INRA VERSAILLES GRIGNON
Membre(s) du jury :
1 M. JEAN-PHILIPPE GALAUD, UNIVERSITE TOULOUSE 3, Président
2 Mme SUSANA RIVAS, INRA TOULOUSE, Membre
Remerciements
Cette thèse a été réalisée au sein du Laboratoire des Interactions Plantes Microorganismes (LIPM) à Toulouse.
Ma gratitude va à Sébastien Baud, Jean-Philippe Galaud, Patrick Gallois et Thomas Kroj pour avoir aimablement accepté d’être jurés de thèse et pour leurs précieuses questions et réflexions qui, lors de la soutenance, ont donné lieu à de riches discussions.
Je tiens à remercier Susana Rivas qui a remarquablement supervisé cette thèse et qui m’a prodigué confiance, conseils et encouragements au cours de ces années passées au laboratoire.
Je souhaite exprimer mes remerciements très sincères à tous ceux (de la plateforme de microscopie, du service de transgénèse et de l’équipe d’accueil) qui m’ont aidé à réaliser ce travail. Les résultats présentés dans ce rapport sont aussi les leurs tant ils ont œuvré pour les obtenir.
Ma reconnaissance va également à mon comité de thèse, Renier van der Hoorn et Manuel Piňeiro, pour leurs suggestions et leurs conseils pertinents sur ce projet.
Je remercie mes professeurs de l’Université d’Albi, de l’Université d’Algarve au Portugal et de l’Université Toulouse III pour avoir suscité mon intérêt pour la biologie.
1
Table of Contents
__________________________________________________________________________ ABBREVIATIONS 4 FIGURE LIST 7 TABLE LIST 10 INTRODUCTION 111.PLANT-PATHOGEN INTERACTIONS AND PLANT IMMUNITY 12
1.1.PLANT-PATHOGEN INTERACTIONS 12
1.2.PLANT DEFENCE MECHANISMS: A MOLECULAR BATTLEFIELD 14
1.2.1. Constitutive defences 14
1.2.2. Inducible defences 16
· Pathogen-Triggered Immunity (PTI) 17
· Effector-Triggered Susceptibility (ETS) 20
· Effector-Triggered immunity (ETI) 22
1.2.3. Signalling events during plant defence responses 24
1.3.PLANT PROTEASES: ROLES IN LIFE AND DEATH DURING PLANT DEFENCE SIGNALLING 27
1.3.1. Aspartic proteases 29
1.3.2. Cysteine proteases 30
1.3.3. Metalloproteases 33
1.3.4. Serine proteases 33
· Carboxypeptidase-like proteases 34
· Subtilisin-like proteases or Subtilases 34
2.TRANSCRIPTIONAL REGULATION OF PLANT DEFENCE RESPONSES 41
2.1.AP2/EREBPTFS 42 2.2. BHLHTFS 43 2.3. BZIPTFS 43 2.4.BBXTFS 43 2.5.NACTFS 44 2.6.WHIRLY TFS 44 2.7.WRKYTFS 44 2.8.MYBTFS 45
2.8.1. DNA MYB Binding Sites (MBSs) 46
2.8.2. Classification of MYB TFs 47
· 1R-MYB 47
· 2R-MYB (or R2R3-MYB) 47
· 3R-MYB (or R1R2R3-MYB) 48
· 4R-MYB 48
2
2.9.TRANSCRIPTIONAL CONTROL IN PLANT DEFENCE (REVIEW ARTICLE) 51
3.ATMYB30 A POSITIVE REGULATOR OF THE HR IN A. THALIANA 52
3.1.IDENTIFICATION OF ATMYB30 52
3.2.EXPRESSION AND FUNCTION OF ATMYB30 52
3.3.HORMONAL CONTROL OF THE ATMYB30-MEDIATED HR 54
3.4.TRANSCRIPTIONAL TARGETS OF ATMYB30 55
3.5.REGULATION OF ATMYB30 56
3.5.1. Post-transcriptional regulation of AtMYB30 56
3.5.2. Post translational modification of AtMYB30 57
3.5.3. Regulation of AtMYB30 activity through protein-protein interactions 58
SCIENTIFIC CONTEXT OF THE PHD PROJECT 62
OBJECTIVES OF THE PHD PROJECT 63
RESULTS 64
A PROTEASE OF THE SUBTILASE FAMILY NEGATIVELY REGULATES PLANT DEFENCE THROUGH ITS INTERACTION WITH THE
ARABIDOPSIS TRANSCRIPTION FACTOR ATMYB30 65
Previous results: Identification of AtSBT5.2 as a new AtMYB30 interacting partner. 65
1.CHARACTERIZATION OF ATSBT5.2 66
1.1. AtSBT5.2 is alternative spliced and encodes two distinct isoforms. 66
1.2. AtSBT5.2(a) is a secreted protein whereas AtSBT5.2(b) is intracellular. 67
1.3. AtSBT5.2(a), but not AtSBT5.2(b), is glycosylated in planta. 68
1.4. AtSBT5.2(a) is an active serine protease. 70
2.CHARACTERIZATION OF THE INTERACTION BETWEEN ATMYB30 AND ATSBT5.2 73 2.1. Neither AtSBT5.2(a) nor AtSBT5.2(b) affect AtMYB30 protein accumulation in planta. 73
2.2. AtSBT5.2(b), but not AtSBT5.2(a), colocalizes with AtMYB30 in planta. 73
2.3. AtSBT5.2(b), but not (a), interacts with AtMYB30 in planta. 74
2.4. The AtSBT5.2(b)-AtMYB30 interaction is specific and mediated through AtSBT5.2(b) C-terminal
domain 75
2.5. AtSBT5.2(b) localization in intracellular vesicles is mediated through its N-terminal domain 76
3.FUNCTIONAL ANALYSIS OF ATSBT5.2 IN PLANT DEFENCE 78
3.1. AtSBT5.2 negatively regulates plant defence and HR. 78
3.2. AtSBT5.2 controls the HR via AtMYB30. 80
3.3. AtSBT5.2(b), but not AtSBT5.2(a), negatively regulates defence-associated cell death responses. 81
3.4. Analysis of AtSBT5.2 expression after bacterial inoculation. 81
DISCUSSION 83
1.AS, AN EMERGING REGULATORY MECHANISM OF PLANT DEFENCE 84
2.REGULATION OF ATSBT5.2 FUNCTION THROUGH AS 87
3
2.1.1. AtSBT5.2(b) localizes to endosomes 88
2.1.2. Endosomes as important sites for regulation of defence signalling 91
2.2.AS AFFECTS THE GLYCOSYLATION STATUS OF RESULTING ATSBT5.2 PROTEIN VARIANTS 93 2.3.AS APPEARS TO AFFECT THE CATALYTIC ACTIVITY OF RESULTING ATSBT5.2 PROTEIN VARIANTS 94 3.THE APOPLAST AS A PRIVILEGED SITE FOR ANTI-MICROBIAL DEFENCE 98 4.NUCLEAR EXCLUSION THROUGH INTERACTION WITH ATSBT5.2(B): A NEW REGULATORY MECHANISM OF
ATMYB30 ACTIVITY 100
MATERIALS AND METHODS 103
OTHER RESULTS 113
4
Abbreviations
A, Ala Alanine A
Aa Alternaria alternataf.sp. lycopersici
Ab Alternaria brassicicola
ABA Abscisic Acid
ABP Activity-Based Profiling
AD Activation Domain
AP2/EREBP APETALA2/Ethylene Responsive Element Binding
ARF Auxin-Response Factor
At Arabidopsis thaliana
AtPLA2 Phospholipase A2 of Arabidopsis thaliana
Atu Agrobacterium tumefaciens
As Avena sativa (oat)
AS Alternative Splicing BBX B-box protein B Bc Botrytis cinerea BD Binding Domain Be Botrytis elliptica bHLH basic Helix-Loop-Helix BR Brassinosteroid
BRI1 Brassinosteroid Insensitive 1
BRS1 Brassinosteroid Insensitive Suppressor 1
Bt Botrytis tulipae
bZIP basic Domain Leucine Zipper
Ca Capsicum annuum (Pepper) C
CC Coiled-Coil
Cd Colletotrichum destructivum
CDPK Calcium-Dependent Protein Kinase
CEV Citrus Exocortis Viroid
Cf Cladosporium fulvum
CFP Cyan Fluorescent Protein
CK Cytokinin
Cv Cochliobolus victoriae
D, Asp Aspartic Acid D
DAMPs Damage-Associated Molecular Patterns
Ea Erwinia amylovora E
Ec Erysiphe cruciferarum
EE Early endosome
EF-Tu Elongation Factor Thermo-unstable
ECM Extracellular Matrix
Endo H Endoglycosidase H
ER Endoplasmic Reticulum
ET Ethylene
ETI Effector-Triggered Immunity
ETS Effector- Triggered Susceptibility
FLS2 Flagellin-Sensing 2 F
FRET-FLIM Förster Resonance Energy Transfer-Fluorescence Lifetime Imaging
5
GA Giberellic Acid G
Gc Golovinomyces cichoracearum
GFP Green Fluorescent Protein
Gm Glycin max (Soybean)
H, His Histidine H
HA Hemagglutinin (HA)-epitope tag
Ha Hyaloperonospora arabidopsis
HLH Helix-Loop-Helix
HR Hypersensitive Response
hrp HR and Pathogenicity
IF Intercellular Fluid I
ISR Induced Systemic Resistance
JA Jasmonic Acid J
Le Lycopersicon esculentum (Tomato) L
LE Late Endosom
LRR Leucine-Rich Repeat
lsd lesion simulating disease
MAMP Microbe-Associated Molecular Pattern M
MAPK Mitogen-Activated Protein Kinase
MBSs MYB Binding Sites
Md Malus domestica (Apple tree)
Me Manihot esculenta (Cassava)
MIEL AtMYB30-Interacting E3 Ligase
Mo Magnaporthe oryzae
MS Murashige and Skoog
MYB Myeloblastom
N, Asn Arginine N
NAC NAM (No Apical Meristem), ATAF (Arabidopsis thaliana transcription Activation Factor) and CUC2 (Cup-Shaped Cotyledon)
NBS Nucleotide-Binding Site
NLR Nucleotide-binding Oligomerization Domain-Like Receptor
NLS Nuclear Localization Signal
Nb Nicotiana benthamiana
Nt Nicotiana tabacum
Nu Nicotiana umbratica
Os Oriza sativa (rice) O
p35S The cauliflower mosaic virus promoter P
PA Protease associated domain
PAMP Pathogen-Associated Molecular Pattern
PCD Programmed Cell Death
PCR Polymerase Chain Reaction
PD Prodomain
PGNase F Peptide N-glycosidase F
PGSs Putative N-glycosylation sites
Phs Phytophthora sojae
6
PR Pathogenesis-Related
PRR Pattern-Recognition Receptor
Ps Pseudomonas syringae
Pst Pseudomonas syringuae pv. tomato
Pt Puccinia striiformis f. sp. tritici
PTI PAMP-Triggered Immunity
PTM Post Translational Modification
Pv Plasmopara viticola
pv. Pathovar
RFP Red Fluorescent Protein R
RLCK Receptor-Like Cytoplasmic Kinase
RLK Receptor-Like Kinase
RLP Receptor-Like Protein
ROS Reactive Oxygen Species
Rs Ralstonia solanacearum
S, Ser Serine S
SA Salicylic Acid
SAR Systemic Acquired Resistance
SBT Subtilase
SCF Skp1, Cullin, F-box-type ligase
Sf Spodoptera frugiperda
Sl Solanum lycopersicum (Tomato)
St Solanum tuberosum (Potato)
SUMO Small Ubiquitin-like Modifier
T2SS Type II Secretion System T
T35S The cauliflower mosaic virus terminator
T3SS Type III Secretion System
Ta Triticum aestivum (Wheat)
TAD Transcription Activation Domain
TAL Transcription Activator-Like
TF Transcription Factor
TGN Trans Golgi Network
TIR Toll-Interleukin1 Receptor
TMD Transmembrane Domain
TMV Tobacco Mosaic Virus
Tn Trichoplusia ni
Ub Ubiquitine U
UPS Ub/Proteasome System
UTR Untranslated Region
VLCFA Very Long Chain Fatty Acid V
Vv Vitis vinifera (Grapevine)
Xcc Xanthomonas campestris pv. campestris X
Xcv Xanthomonas campestris pv. vesicatoria
Xoo Xanthomonas oryzae pv. oryzae
Y2H Yeast Two-Hybrid Y
YFPv Yellow Fluorescent Protein venus
7
Figure list
Figure 1. Disease symptoms on Arabidopsis leaves caused by pathogens (From Pieterse et
al., 2009).
Figure 2. Overview on the various types of interaction (Adapted from Nürnberger et al.,
2004).
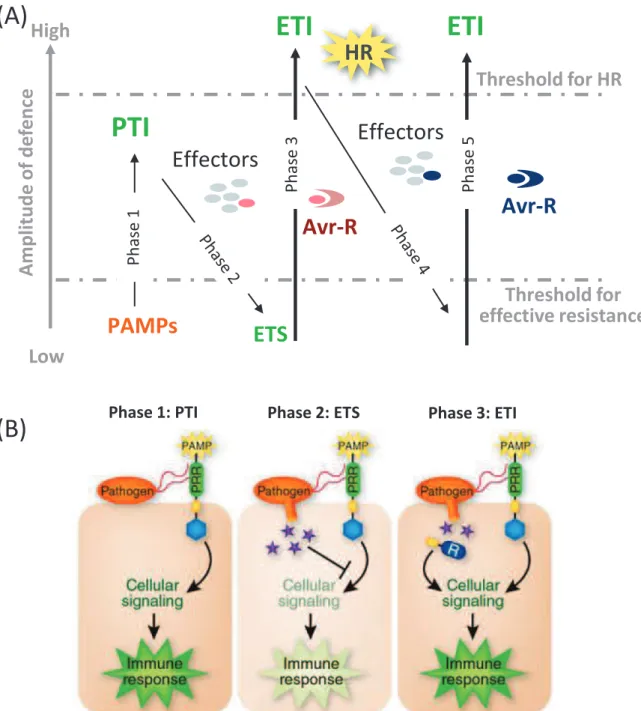
Figure 3. The zigzag model illustrates the quantitative output of the plant immune system
(Adapted from Jones and Danggl, 2006 and from Pieterse et al., 2009).
Figure 4. Schematic representation of systemically induced immune responses (Adapted
from Pieterse et al., 2009).
Figure 5. Plant PRRs and their signalling adapters.
Figure 6. Examples of plant targets of bacterial type III effector proteins (From Deslandes
and Rivas, 2014).
Figure 7. Major families of R proteins.
Figure 8. Model of integrated decoys in NLR protein pairs (From Cesari et al., 2014). Figure 9. Major signalling mechanisms in plant defence (From Bigeard et al., 2015).
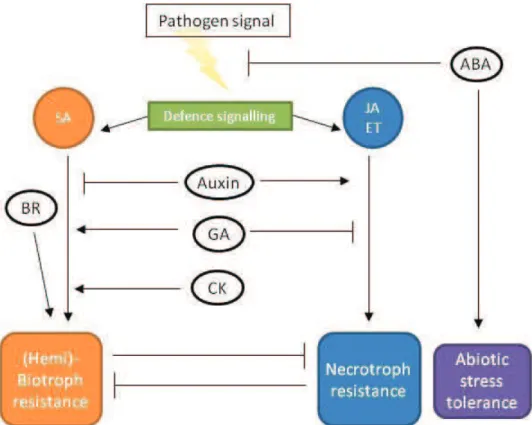
Figure 10. Classic model established for the hormonal control of the plant defence
(Addapted from David De Vleesschauwer et al., 2013).
Figure 11. Development of the hypersensitive response (HR) on tobacco leaf in response to
Pseudomonas syringae pv. tomato DC3000
(http://www.sidthomas.net/images/hypersensitive.jpg).
Figure 12. Cleavage mechanisms of the four major catalytic classes of proteases (From van
der Hoorn, 2008).
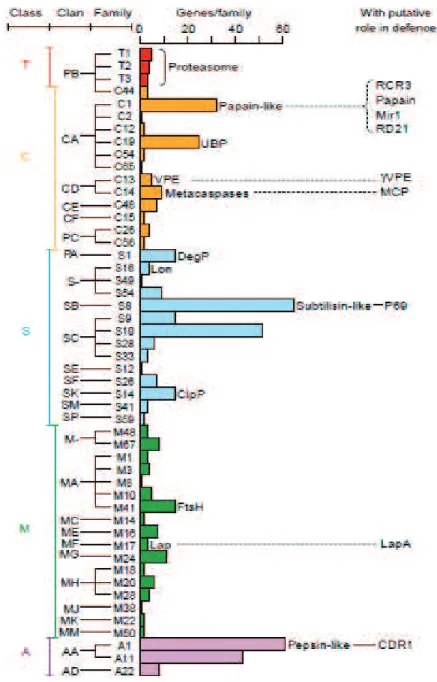
Figure 13. Classification and number of the catalytic types of Arabidopsis proteases (From
van der Hoorn and Jones, 2004).
Figure 14. Protein structure of proteases.
Figure 15. Phylogenetic tree of Arabidospsis subtilases (From Rautengarten et al., 2005). Figure 16. Plant MYB transcription factor classes (Adapted from Dubos et al., 2010).
Figure 17. Schematic illustration of different MYB protein classes and their functions (From
Ambawat et al., 2013).
Figure 18. Schematic representation of the relationships between the different Arabidopsis
R2R3-MYB subgroups (From Dubos et al., 2010).
8
Figure 20. Analysis of AtMYB30 expression in Arabidopsis upon bacterial infection (From
Daniel et al., 1999).
Figure 21. Overexpression of AtMYB30 in tobacco leads to accelerated HR in response to
inoculation with different pathogens (From Vailleau et al., 2002).
Figure 22. AtMYB30 modulates the expression of very long chain fatty acid (VLCFA)-related
genes after bacterial inoculation (From Raffaele et al., 2008).
Figure 23. Schematic overview of metabolic pathways regulated by AtMYB30 during the
incompatible interaction between Arabidopsis and avirulent bacterial pathogens (Adapted from Raffaele et al., 2008).
Figure 24. Simplified model for the simultaneous regulation of AtMYB30-mediated HR cell
death through interaction with AtsPLA
2−α and MIEL1 (Adapted from Raffaele and Rivas,
2013).
Figure 25. Interaction between AtMYB30 and AtSBT5.2 in yeast. Figure 26. AtSBT5.2 is alternatively spliced.
Figure 27. Sequence alignment of AtSBT5.2(a) and AtSBT5.2(b) proteins.
Figure 28. Subcellular localization studies show that AtST5.2(a) is secreted whereas
AtSBT5.2(b) is intracellular.
Figure 29. Intercellular fluid isolation confirms that AtSBT5.2(a) is secreted whereas
AtSBT5.2(b) is intracellular.
Figure 30. Schematic representation of AtSBT5.2(a) and AtSBT5.1 protein sequences. Figure 31. Sequence alignment of AtSBT5.2(a) and AtSBT5.1 proteins.
Figure 32. AtSBT5.2(a), but not AtSBT5.2(b), is glycosylated in planta. Figure 33. All PGS in AtSBT5.2(a) are used for glycosylation in planta. Figure 34. AtSBT5.2(a) self cleaves in planta.
Figure 35. AtSBT5.2(a) is an active serine hydrolase.
Figure 36. Mutation of some glycosylated residues affects the catalytic activity of
AtSBT5.2(a).
Figure 37. Neither AtSBT5.2(a) nor AtSBT5.2(b) affect AtMYB30 protein accumulation in
planta.
Figure 38. AtSBT5.2(b), but not AtSBT5.2(a), colocalises with and retains AtMYB30 outside
9
Figure 39. AtSBT5.2(b)-mediated retention of AtMYB30 outside the nucleus is independent
of C-terminal tagging of the subtilase.
Figure 40. AtSBT5.2(b) does not affect AtMYB123 nuclear localization.
Figure 41. AtMYB30 and AtMYB123 colocalize in nuclei with both AtSBT5.2
362-730 and
AtSBT5.1
405-780.
Figure 42. Sequence alignment of AtSBT5.2(b)
362-730 and AtSBT5.1405-780 proteins.
Figure 43. AtMYB30 localization in intracellular vesicles is AtSBT5.2(b) N-terminal
domain-dependant.
Figure 44. Genetic analysis of AtSBT5.2 and AtSBT5.1 Arabidopsis mutant lines.
Figure 45. AtSBT5.2 negatively regulates HR development and plant resistance to bacterial
inoculation.
Figure 46. AtSBT5.2 is a negative regulator of AtMYB30-mediated HR cell death.
Figure 47. Characterization of AtSBT5.2(a) and AtSBT5.2(b) overexpressing Arapidopsis
lines.
Figure 48. AtSBT5.2(b), but not AtSBT5.2(a), negatively regulates defence-related HR cell
death.
Figure 49. AtSBT5.2(b) and AtMYB30 expression profiles and induction rates overlap during
infection with avirulent HR-inducing bacteria.
Figure 50. Predicted effects of AS on the proteins encoded by AtSBT2.2, AtSBT3.6,
10
Table list
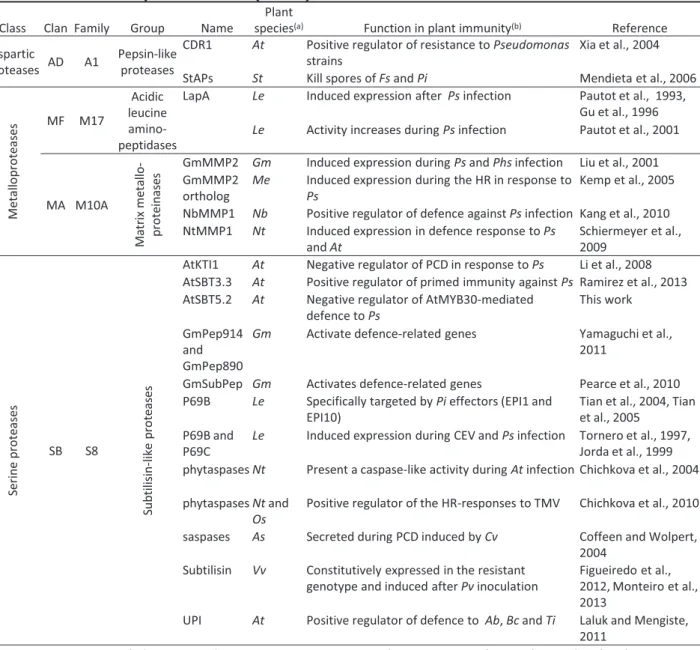
Table 1. Genetic model of the gene for gene theory (From Flor, 1971). Table 2. Role of proteases in plant defence.
Table 3. FRET-FLIM analysis shows that AtMYB30 physically interacts with AtSBT5.2(b) in
N. benthamiana epidermal cells.
11
Introduction
Figure 1. Disease symptoms on Arabidopsis leaves caused by pathogens (From Pieterse et al., 2009).
Disease symptoms on Arabidopsis leaves caused by the necrotrophic fungus Botrytis cinerea (left), the biotrophic oomycete Hyaloperonospora arabidopsidis (center) and the hemibiotrophic bacterium Pseudomonas syringae (right). Photos: Hans van Pelt.
12
1. Plant-pathogen interactions and plant immunity
1.1. Plant-pathogen interactions
Plants are primary producers and therefore a source of nutrients for many organisms (Cardinale et al., 2011). To adapt to their habitat and maximize their chances of survival, plants have developed both root and aerial systems, which, in turn, increases the range of organisms that they can encounter. Many of these organisms, such as plant growth-promoting rhizobacteria, are beneficial to the plant (Gopal et al., 2013) whereas other organisms, including phytopathogenic insects, viruses, bacteria, nematodes, fungi, and oomycetes, have a detrimental effect on plant long-term survival (Dangl and Jones, 2001).
According to their lifestyles, phytopathogens are classified into broad categories (Figure 1): (i) necrotrophs that kill the host, often through the production of phytotoxins, before parasitising it, extract nutrients from the cells and then live on dead tissue (such as the fungal pathogen Botrytis cinerea usually called grey mould) and (ii) biotrophs that obtain nutrients from living cells, commonly through specialized feeding structures (haustoria) that invaginate the host cell without disrupting it and require a living host to continue their life cycle (such as the oomycete pathogen Hyaloperonospora arabidopsis). Hemibiotrophs are microbes that require a living host initially, but kill it at later stages of infection (such as the bacterial pathogens Pseudomonas syringae or Xanthomonas campestris) (Glazebrook, 2005). Bacteria and fungi adopt biotrophic, hemibiotrophic or necrotrophic modes of infection while viruses are ideal biotrophs (although viral infection can eventually result in host cell death) (Dangl and Jones, 2001).
Although plants must thus face the diversity of aggressive biotic agents, over-investing in defence in the absence of infection can be just as detrimental to survival as disease (Brown, 2003). Indeed, plant resistance to disease is a costly response, closely connected to plant physiological and developmental processes (Lozano-Durán et al., 2013, Fan et al., 2014,
Figure 2. Overview on the various types of interaction (Adapted from Nürnberger et al., 2004).
Non host resistance/immunity No pathogen differentiation on the plant
Sufficient preformed defense
Compatible interaction
Incompatible interactions
Susceptibility/disease
Pathogen propagation on the plant
Insufficient preformed/inducible defense
Host resistance/immunity No pathogen propagation on the plant
13 Malinovsky et al., 2014). In agreement, mutants with constitutively active defence responses often present reduced growth and low fertility (Lorrain et al., 2003).
In parallel, the establishment of a parasitic relationship is dependent on the response of the plant under attack. Indeed, to adapt to their hostile environment, plants have evolved sophisticated mechanisms of protection to counteract constant pathogen attacks. Some of these mechanisms are efficient against a broad range of pathogens, while others are limited to specific pathogens. These mechanisms are based on an efficient immune system that depends on cell-autonomous events, and on the ability to develop systemic signals from the site of infection. Therefore, in host-pathogen relationships severe epidemics of disease remain the exception rather than the rule (Burdon, 1987).
Interactions of pathogens with plants can either be compatible or incompatible. A
compatible interaction occurs when the pathogen infects a susceptible or a tolerant host plant. In this case, the plant reacts more or less effectively to this aggression and the
severity of symptoms is variable. Symptoms of disease include death and destruction of host tissue, wilting, abnormal growth and differentiation and discolouration of host tissue (Dangl and Jones, 2001). If the plant keeps the ability to grow, the plant is tolerant. Otherwise, if the plant develops a disease that alters its development, the plant is susceptible. Defence mechanisms are triggered but in a manner that is too slow and/or too weak for the plant to survive. The pathogen is qualified as virulent; it multiplies actively within the plant and appears to be able to suppress the resistance mechanisms of the host (Nürnberger et al., 2004) (Figure 2). For a biotroph to form a successful infection, it must establish a basic compatibility with its host. The pathogen may also produce compatibility factors that delay, avoid or negate recognition by a normally resistant host plant.
An incompatible interaction occurs when the pathogen encounters a non-host plant
(non-host resistance) or a resistant (non-host plant (cultivar-specific resistance or (non-host resistance). In both cases, failure of the pathogen to invade host cells will prevent it from
14 colonising the host and the plant will be named resistant. The pathogen qualifies as
avirulent as it loses its pathogenicity. Resistant hosts prevent or slow the development and
reproduction of the majority of pathogens that they come into contact with. Resistance can be expressed at many stages in the infection process, from inhibition of germination and penetration, to restriction of colony development after entry. In the case of a resistant plant two situations are possible. When an entire plant species is resistant to all races of a microorganism that is pathogenic to other plant species, resistance is known as non-host
resistance (Senthil-Kumar and Mysore, 2013). Non-host resistance, therefore, is the most
common form of disease resistance exhibited by plants. Such broad-spectrum resistance contrasts with host resistance, which is displayed by plant genotypes of susceptible host species against a specific pathogen agent (Hammond-Kosack and Jones, 1997) (Figure 2).
Having introduced the bases of the interaction between plants and pathogens, the next
section provides an overview of the co-evolutionary forces and the molecular mechanisms
that determine the outcome of this interaction.
1.2. Plant defence mechanisms: a molecular battlefield
Plants, unlike mammals, lack mobile defender cells and a somatic adaptive immune system. Instead, they rely entirely on their innate immunity and on systemic signals originating from infection sites (Dangl et al., 2013). Indeed, in response to pathogen attack, plants have developed complex, multilayered signalling and defence mechanisms to protect themselves. Defence barriers and mechanisms used by plants represent a co-ordinated network of molecular, cellular and tissue-based responses that can be classified into constitutive (passive) and inducible (active) defences.
1.2.1. Constitutive defences
Pathogen initial invasion can be primarily prevented by preformed physical and/or chemical barriers called constitutive defences. Physical barriers largely involve properties of the plant
15 surface such as the thickness of the cuticle of leaves, cuticular lipid, wax layers or the size of stomatal pores. The cuticle is a layer coating the outer surface of epidermal cells of organs of the aerial part of the plants and also present within seed coats (Serrano et al., 2014). Composed of an insoluble cutin polymer matrix and interspersed with waxes (epicuticular and intracuticular lipids), the cuticle protects from desiccation and acts as a mechanical barrier against various abiotic and biotic stress, such as UV radiation and pathogens (Serrano et al., 2014). In addition to its hydrophobic surface, a vertical leaf orientation can also add to plant resistance, by preventing the formation of moisture films on the leaf surface, thus inhibiting infection by pathogens reliant on water for motility. Some plants present a very thick cuticle and bark, if present; can also prevent the entry of pathogens (Reina-Pinto and Yephremov, 2009). Therefore, to enter inside the plant, microorganisms must force these barriers or use wounds or natural openings such as stomata or hydathodes, naturally used for gas exchange or water-excreting, respectively (Schwab et al., 2015).Stomatal aperture is driven by specialized plant cells called guard cells (Assmann and Shimazaki, 1999) that control openings by turgor pressure. This aperture is very tightly controlled by several plant hormones, most notably abscisic acid (ABA) (Pillitteri and Dong, 2013). In the presence of pathogenic bacteria and fungi, stomata close rapidly to prevent microbial entry (Gudesblat et al., 2009). Hydathodes are specialized stomata. Since aperture of hydathodes is not controlled by the plant, they particularly serve as pathogen entry points (Gu et al., 2013) especially after a guttation period when the water droplet is sucked back into the plant.
If a microorganism reaches the intercellular space, called apoplast, it must face the plant cell wall before entering the cell. Although the composition and structure of the cell wall differ significantly in the relative amounts of its compounds among plant lineages, plant cell walls are composed of a complex network of polysaccharides, including cellulose microfibrils embedded in a matrix of pectin, hemicelluloses, lignin, and structural proteins (Loqué et al., 2015). This composition serves as the plant exoskeleton providing mechanical support but it also serves as a physical barrier, important for resistance to pathogens. Evidence of the role
Phase 1: PTI Phase 2: ETS Phase 3: ETI
Figure 3. The zigzag model illustrates the quantitative output of the plant immune system (From Jones and Dangl, 2006 and Pieterse et al., 2009).
(A) The zigzag model illustrates the intensity of the plant defence responses in place upon pathogen interaction. In phase 1, plants detect microbial/pathogen-associated molecular patterns (MAMPs/PAMPs, red diamonds) via Pattern Recognition Receptors (PRRs) to trigger PAMP-triggered immunity (PTI). In phase 2, successful pathogens deliver effectors that interfere with PTI, or otherwise enable pathogen nutrition and dispersal, resulting in Effector-Triggered Susceptibility (ETS). In phase 3, one effector (indicated in red) is recognized by an NB-LRR protein, activating Effector-Triggered Immunity (ETI), an amplified version of PTI that often exceeds a threshold for induction of hypersensitive cell death (HR). In phase 4, pathogen isolates are selected that have lost the red effector, or perhaps gained new effectors through horizontal gene flow (in blue). These can help pathogens to suppress ETI. In phase 5, selection favours new plant NB-LRR alleles that can recognize one of the newly acquired effectors, resulting again in ETI.
(B) Molecular events occurring in phases 1 to 3 of the zigzag model.
(B)
(A)
PAMPs
Ampl
it
ude
of
de
fenc
e
Threshold for HR
Threshold for
effective resistance
PTI
Effectors
ETS
Low
High
Avr-R
ETI
I
HR
Ph ase 1 Ph ase 3ETI
Effectors
Avr-R
Ph ase 516 that the cell wall plays in resistance comes from pathogens that use mechanical force or release cell wall degrading enzymes to overcome this barrier (Kubicek et al., 2014, Hématy et al., 2009). For example, Erwinia spp produce pectinases to increase accessibility for other enzymes like cellulases and xylanases and several other hydrolases to break down the hemicellulose chains (Toth and Birch, 2005), which disrupt host cell integrity and thus promote rotting (Toth et al., 2003). Even though in the past these structures have been regarded as “passive”, research has shown that they are very dynamic and intricately connected to “active” defences (Traw and Bergelson, 2003).
Beside the physical barriers against pathogen penetration, plants constantly produce various chemical compounds that inhibit pathogen growth (Osbourn, 1996). These constitutive
chemical barriers include compounds such as antimicrobial compounds (also referred as
phytoanticipins) (Pedras and Yaya, 2015) or secondary metabolites (such as glucosinolates, tannins, ...) (Ahuja et al., 2012, Bednarek, 2012).
1.2.2. Inducible defences
Pathogens that overcome passive defence layers are systematically perceived. Following perception of invading microbes, plants use a two-tiered receptor-based immune system to prevent infection (see below). This adapted defence response is mounted locally and has been summarized in the zigzag model proposed by Jones and Dangl (Jones and Dangl, 2006), which decrypts the co-evolutionary molecular events driving the interaction between plants and pathogens (Figure 3).
The outcome of the interaction, which varies according to the genetic determinants of each organism, is also presented in this model. Local perception of a microorganism can, in addition, trigger systemic defence responses that prime the plant for resistance against a broad spectrum of pathogens. Systemic acquired resistance (SAR) and induced systemic resistance (ISR) are systemic resistance responses that are extremely rapid and usually
Figure 4. Schematic representation of systemically induced immune responses (Adapted from Pieterse et al., 2009).
Systemic acquired resistance (SAR) is typically activated in healthy systemic tissues of locally infected plants. Upon pathogen infection, a mobile signal travels through the vascular system to activate defence responses in distal tissues. Salicylic acid (SA) is an essential signal molecule for the onset of SAR, as it is required for the activation of a large set of genes that encode pathogenesis-related (PR) proteins with antimicrobial properties. Induced systemic resistance (ISR) is typically activated upon colonization of plant roots by beneficial microorganisms. Like SAR, a long-distance signal travels through the vascular system to activate systemic immunity in above-ground plant parts. ISR is commonly regulated by jasmonic acid (JA)-and ethylene (ET)-dependent signalling pathways and is typically not associated with the direct activation of PR genes. Instead, ISR-expressing plants are primed for accelerated JA-and ET-dependent gene expression, which becomes evident only after pathogen attack. Both SAR and ISR are effective against a broad spectrum of virulent plant pathogens.
17 involve an amplification of the initial response in distal tissues (Kothari and Patel, 2004) (Figure 4).
SAR is characterised by the increased, broad spectrum resistance against pathogens
following a primary infection (Gozzo and Faoro, 2013). Development of SAR usually involves the establishment of a slowly expanding necrotic lesion and other localised responses to infection, the release of a signal originating from the infection site, and the subsequent priming of the plant against further attacks, allowing a more rapid response in the case of subsequent infections. This response is dependent on the plant hormone salicylic acid (SA) and is associated with the transcriptional reprogramming of a number of defence genes, including pathogenesis-related (PR) genes, leading to accumulation of PR proteins that contribute to resistance due to their antimicrobial properties (Muthamilarasan and Prasad, 2013). The precise nature of the signal triggering SAR is still unknown. Although SA levels increase around necrotic lesions and remain high in plants displaying SAR, a phloem-translocated lipid molecule, and not SA itself, has been proposed as the SAR-inducing long distance signal (Chanda et al., 2011, Maldonado et al., 2002, Chaturvedi et al., 2008) (Figure 4).
ISR is triggered by non-pathogenic root bacteria (for example, Pseudomonas fluorescens)
and confers effective resistance against a broad range of pathogens and insect herbivores (Pieterse et al., 2014). In contrast to SAR, ISR seems to develop independently of SA and PR gene induction and is rather dependent on the phytohormones jasmonic acid (JA) and
ethylene (ET) (Pieterse et al., 2009) (Figure 4).
· Pathogen-Triggered Immunity (PTI)
When a pathogen manages to penetrate the plant cell wall and reaches the periplasmic space, it comes into contact with the plasma membrane of the host cell where it is exposed to surface receptors that are capable of perceiving a great variety of microorganisms. This detection generally occurs through the perception of microbial molecules, conventionally
Figure 5. Plant PRRs and their signalling adapters.
(A) Domain structures for receptor-like kinases (RLKs) and receptor-like proteins (RLPs). The kinase domain is absent in RLPs. SP: signal peptide; TMD: transmembrane domain; LysM: lysine motif; LRR: leucine-rich repeats.
(B) Bacterial elicitors flagellin (flg22) and EF-Tu (elf18) are recognised by the Arabidopsis RLKs flagellin sensing2 (FLS2) and EF-Tu receptor (EFR), respectively. FLS2, and EFR, oligomerise with BRI1-associated kinase1 (BAK1) in a ligand-dependent manner. Chitin binds to homodimers of the Arabidopsis lysine motif receptor kinase (LysM-RK) chitin elicitor receptor kinase1 (CERK1) to induce immune responses. The Arabidopsis RLK PEPR1 recognises endogenous AtPep peptides that act as danger-associated molecular patterns (DAMPs).
(B)
(A)
RLP
RLKs
LRR TMD SP Kinase LysMKey:
BACTERIA DAMPs AtPep peptides PEPR1 AtProPep proteins FLS2 Flagelin (flg22) EF-Tu (elf18) EFR BAK1 BAK1 FUNGI CERK1 Chitin18 located at the surface of the microorganism called pathogen-associated molecular patterns (PAMPs) or microbial-associated molecular patterns (MAMPs). PAMPs are typically conserved and indispensable molecules, such as bacterial flagellin or chitin, a substance found in fungi cell walls and the exoskeleton of insects and nematodes. However, PAMPs can also be intracellular molecules being secreted or released from dead bacteria, which are perceived by the plant [e.g. elongation factor (EF)-Tu]. These molecules are recognized by cognate plasma-membrane-bound extracellular receptor proteins called pattern recognition receptors (PRRs), on the external face of host cells. PRRs are typically plasma membrane-bound receptor-like kinases (RLK)- or receptors-like proteins (RLP)- type proteins (Zipfel, 2014). These receptors present an extracellular leucine-rich repeat (LRR) or lysine motif (LysM) domain allowing the recognition of "non-self" molecules, a transmembrane domain (TMD) and a kinase domain in the case of RLKs, involved in signal transduction (Figure 5A). Without a kinase domain, the short intracellular domain of RLPs associates with intracellular kinase proteins in order to transduce an appropriate signal response (Böhm et al., 2014).
The Arabidopsis RLKs flagellin sensing2 (FLS2) and EF-Tu receptor (EFR) recognize bacterial flagellin and EF-Tu, respectively, and are the best characterized plant PRRs (Zipfel, 2014). These and other examples of PRR proteins are shown in Figure 5B. It has recently become clear that several RLKs require other RLKs for full function (Zipfel, 2014). Binding of flg22 or elf18 (the immunogenic peptides of flagellin or EF-Tu in Arabidopsis, respectively) to FLS2 or EFR, respectively, induces their instant association with the co-receptor RLK BRI1-associated kinase1 (BAK1), phosphorylation of both proteins and initiation of downstream responses (Roux et al., 2011, Schwessinger et al., 2011, Chinchilla et al., 2007) (Figure 5B). RLKs interact also with soluble receptor-like cytoplasmic kinases. For example, Botrytis-induced kinase1 (BIK1) and related PBS1-like (PBL) kinases constitutively associate with FLS2 and EFR and become quickly phosphorylated and released from the PRR complexes upon PAMP binding (Lu et al., 2010, Zhang et al., 2010). These associations play positive regulatory roles in immunity (Böhm et al., 2014). To penetrate into the host cell, several
19 pathogens produce a range of cutin-degrading enzymes, which are often crucial for the successful penetration of the plant tissue, and release cell wall or cuticular fragments. Plants are also able to detect and respond to these endogenous molecules released by pathogen invasion, called danger-associated molecular patterns (DAMPs), that are not available for recognition under normal conditions. Polysaccharides released from the plant cell wall (e.g. oligogalacturonides), and some endogenous peptides are DAMPs detected as “infectious self”. When cell wall damage is detected, the cell wall is remodelled and reinforced at the penetration site by formation of cell wall-associated structures like papillae (Hückelhoven, 2007). This reaction prevents infection of individual cells and stunts pathogen growth. The first plant DAMP/PRR pairs have been recently identified.The Arabidopsis RLKs PEPR1 and PEPR2 perceive AtPep peptides (Yamaguchi et al., 2006, Yamaguchi et al., 2010) (Figure 5B). These peptides are derived from the propeptides (AtProPeps) that are encoded by a multigenic family of seven-members whose expression is induced by wounding or PAMP perception (Krol et al., 2010). Treatment with AtPep peptides induces defence gene expression and overexpression of AtProPep1 leads to enhanced resistance to the fungal root pathogen Pythium irregulare. AtPep perception is part of a PTI amplification loop and is important for the induction of systemic immunity (Zipfel, 2013).
Stimulation of PRRs triggers a set of complex signalling pathways leading to the development of the first line of active defence responses formerly called basal or horizontal immunity. This response is known as PAMP, DAMP or MAMP-triggered immunity (PTI, DTI or MTI) and is sufficient to prevent the colonization of the microorganism in the plant (Beck et al., 2012) (Figure 3). Functional PRRs and co-regulators are crucial for the success of PTI, as mutant plants with a defective recognition system show increased susceptibility to pathogens (Miya et al., 2007, Zipfel et al., 2006).
After pathogen detection, activation of PRRs induces a number of defence mechanisms such as the establishment of structural and/or chemical barriers. Indeed, antimicrobial compounds can be synthesized de novo in response to microbial attack. Such compounds are known as
20 phytoalexins. For example, when Pseudomonas syringae enters the plant via stomata, recognition of flg22 by FLS2 stimulates production of reactive oxygen species (ROS), which have direct antimicrobial properties but also serve as signalling molecules to activate further immune outputs (O'Brien et al., 2012), cell walls are reinforced by callose, lignin and suberin deposition for extra protection (Senthil-Kumar and Mysore, 2013) and production and secretion of molecules (such as camalexin) and defence-related proteins/peptides (such as PR1) is induced (Bigeard et al., 2015, Bednarek, 2012, Ahuja et al., 2012, Melotto et al., 2008). This recognition also leads to closure of stomata to limit bacterial entry (Sawinski et al., 2013). Moreover, certain proline-rich proteins of the cell wall become oxidatively cross-linked after pathogen attack in an H2O2-mediated reaction. This process strengthens the cell
wall in the vicinity of the infection site, increasing resistance to microbial penetration (Morimoto et al., 1999). In response to cell wall degrading enzymes secreted by phytopathogenic microorganisms, plants have evolved a diverse battery of defence responses including protein inhibitors of these enzymes. These include inhibitors of pectin degrading enzymes such as polygalacturonases, pectinmethyl esterases and pectin lyases, and hemicellulose degrading enzymes such as endoxylanases and xyloglucan endoglucanases (Juge, 2006).
All these defensive reactions, together with passive defences, build up a so-called basal
resistance that is regarded as non-specific as it is activated regardless of the
microorganism encountered. Ultimately, basal defence generally contributes to halt infection before the microbe gains a hold in the plant allowing resistance to a variety of phytopathogenic organisms. However, during evolution, some pathogens developed various strategies to counter this first line of plant defence and acquired the ability to induce the development of symptoms leading to disease and even the death of the plant.
· Effector-Triggered Susceptibility (ETS)
Successful pathogens such as bacteria, fungi, oomycete, and nematodes have evolved strategies to circumvent PTI responses and are able to promote pathogenesis by delivering a
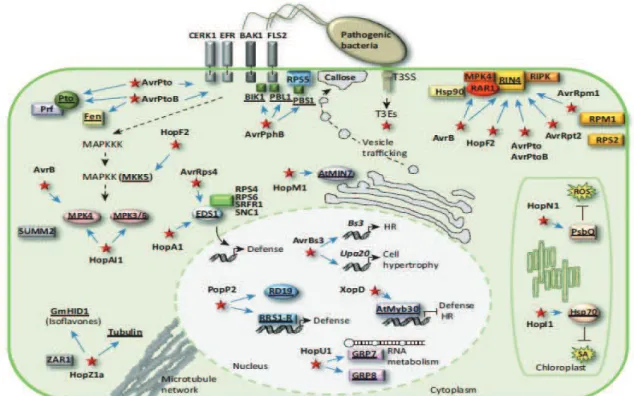
Figure 6. Examples of plant targets of bacterial type III effector proteins (From Deslandes and Rivas, 2014).
At the plasma membrane (PM), activation of the receptor complexes, for example, Flagellin-Sensitive2/BRI1-Associated Kinase1 (FLS2/BAK1) or EF-Tu receptor/BAK1 (EFR/BAK1), by recognition of conserved bacterial pathogen-associated molecular pattern (PAMP) molecules triggers PAMP-triggered immunity (PTI)-associated signalling. Phytopathogenic bacteria inject type III effector (T3E) proteins into plant cells using the type III secretion system (T3SS). Following their translocation into plant cells, T3Es may be addressed to different subcellular compartments where they may manipulate a variety of host cellular functions. Recognition of the activity of T3Es by R proteins triggers effector-triggered immunity (ETI) responses. AvrPto and AvrPtoB target PM-associated receptor complexes. The cytoplasmic kinase proteins Pto and Fen act as molecular mimics of host virulence targets of AvrPto and AvrPtoB to activate ETI. AvrPto, AvrPtoB, AvrB, AvrRpm1, AvrRpt2, and HopF2 target the negative regulator of defence RPM1-interacting protein4 (RIN4) at the PM. AvrAC targets immune kinases at the PM. HopZ1a, recognized by the R protein ZAR1, targets 2-hydroxyisoflavone dehydratase (GmHID1), which is involved in isoflavone biosynthesis, and tubulin, which affects the cellular microtubule network. Cleavage of PBS1 and additional related kinases (BIK1 and PBL1) by AvrPphB is recognized by the R protein RPS5, triggering ETI. HopI1 and HopN1 are addressed to the chloroplast where they respectively target the chaperone protein Hsp70, suppressing salicylic acid (SA) accumulation, and the Photosystem II-associated protein PsbQ, diminishing reactive oxygen species (ROS) production. HopM1 accumulates in the trans-Golgi network/early endosome (TGN/EE) where it targets AtMIN7, a key component of vesicle trafficking, thereby suppressing cell wall-associated defences. HopF2, HopAI1, and AvrB target mitogen-activated protein kinase (MAPK) signalling. In the nucleus, the Transcription Activator-Like (TAL) effector AvrBs3 is able to mimic eukaryotic transcription factors (TFs) and directly activate transcription. AvrBs3 binding to the UPA box in host promoters induces plant cell hypertrophy, contributing to disease development. By contrast, in resistant plants, activation of the resistance gene Bs3 leads to HR development. The effector protein XopD targets the Arabidopsis TF AtMYB30, which a positive regulator of Arabidopsis defence responses. This protein interaction results in repression of AtMYB30 transcriptional activation and suppression of plant HR and defence responses. PopP2 induces nuclear relocalization of the vacuolar protease RD19 and perception of PopP2 activity by the R protein RRS1-R activates immunity. HopU1 ribosylates GRP7/8 probably altering immunity-related RNA metabolism. Both HopA1 and AvrRps4 target the enhanced disease suceptibility1 (EDS1) immune regulator disrupting its association with various immune surveillance proteins, including RPS4. Host targets are underlined.
21 battery of secreted molecules called effectors at the extracellular space of host plant cells (apoplastic effectors) or inside plant cells (cytoplasmic effectors) (Win et al., 2012). Therefore, by targeting PTI signalling (Zhang et al., 2007) or PTI receptors (Chaparro-Garcia et al., 2015) these effectors can suppress PTI, thus resulting in effector-triggered susceptibility (ETS) (Figure 6). During the past few years, the molecular functions of a significant number of effectors from various phytopathogens have been discovered, revealing an astonishing number of eukaryotic processes that are targeted by effector proteins (Deslandes and Rivas, 2012).Apoplastic effectors are able to prevent PAMP recognition and PRR activation, as well as chitinase or protease action (Asai and Shirasu, 2015). Pathogen effectors delivered inside host cells suppress defence responses by targeting components of defence signalling (details on signalling events triggered upon pathogenic infection are provided in the next section) (Feng and Zhou, 2012). Host-translocated (cytoplasmic) effectors are delivered into host plant cells via the type III secretion system (T3SS) (Galán et al., 2014) or through specialized infectious structures called haustoria that are formed within the host cell during infection (Giraldo and Valent, 2013). In plant-pathogenic bacteria, genes encoding components of the T3SS are located in so-called hrp (HR and Pathogenicity) gene clusters, as their mutation typically disrupts bacterial ability to cause disease on host plants and to elicit a hypersensitive response (see section 3) on non-host plants (Tang et al., 2006). The hrp cluster is conserved among Gram negative bacteria including Pseudomonas syringae, Xanthomonas spp., Ralstonia solanacearum and Erwinia spp.(Galán et al., 2014). Although the bacterial T3SS has been well studied (Galán et al., 2014), the mechanisms of effector translocation by filamentous pathogens are still under debate (Giraldo and Valent, 2013). Once inside host cells, effectors subsequently traffic to distinct compartments including the nucleus (Sarris et al., 2015), the plasma membrane (Wu et al., 2011), the endoplasmic reticulum (ER) (Block et al., 2014), the tonoplast (Caillaud et al., 2012), intracellular vesicles (Nomura et al., 2011), chloroplasts (Petre et al., 2015) or the microtubule network (Lee et al., 2012). Figure 6 presents a general, not exhaustive, view of the diversity of cellular processes targeted by type III effectors (T3Es) to promote disease.
Figure 7. Major families of R proteins.
Representation of the location and structure of the main classes of plant disease resistance proteins. The majority of R proteins contain tandem leucine-rich repeats (LRRs, depicted in blue), which have a major role in recognition specificity. The most widely represented R protein family consists of Nucleotide-Binding site–LRRs (NB-LRRs) proteins that contain a nucleotide-binding site and a region of similarity to proteins that regulate PCD in metazoans. NB-LRR proteins are likely localized in the cytoplasm, perhaps as peripheral membrane proteins. Some NB-LRR proteins contain a putative coiled-coil domain (CC) at the N-terminus. Other NB-LRR proteins contain a domain with homology to the metazoan superfamily of Toll-like innate immunity receptors (TIR). Another class of R protein consists of an extracellular LRR (eLRR) anchored to a TM domain.
LRR
RLP
(Cf-proteins)
CC
NBS
LRR
(RPM1,
RPS2)
(RPS4,
RPS6)
TIR
NBS
LRR
NB-LRRs
Cytoplasm Pla sm a m em bran e Nucleus Apoplasm22 · Effector-Triggered immunity (ETI)
Just as pathogens have evolved to disable plant defences, plants have gained the ability to recognize and respond to these effector-mediated attacks. Indeed, plants have evolved a, more efficient and specific, second line of active defence to recognise and protect themselves from sneaky invaders. To detect effectors, or their interference with host proteins, plants have developed receptors called resistance (R) proteins. The A. thaliana Columbia (Col-0) accession presents around 150 R genes in its genome (Meyers et al., 2003). A majority of R proteins belongs to the intracellular nucleotide-binding leucine-rich repeat receptor (NLR or NB-LRR) protein family (Jones and Dangl, 2006) that displays striking similarities with animal nucleotide-binding oligomerization domain-like receptors (NLRs) or CATERPILLER proteins (Rairdan and Moffett, 2007, Inohara and Nuñez, 2003). NLR proteins are multidomain proteins and possess a conserved architecture including a central nucleotide binding site domain (NBS) and a C-terminal LRR domain (Takken and Goverse, 2012) (Figure 7). Based on the presence in their N-terminal domain of either Toll/Interleukin-1 receptor (TIR) or coiled-coil (CC) motifs, NLR proteins fall into two major structurally distinct sub-classes named TIR-NB-LRR (TNL) or CC-NB-LRR (CNL), respectively (Bonardi et al., 2012). Other R proteins belong to the group of eLRR (extracellular LRR) domain proteins. This includes mainly the Receptor-Like Protein (RLP) family characterized by an extracellular LRR domain, a TMD and a short cytoplasmic domain (Muthamilarasan and Prasad, 2013) (Figure 7). The best characterized R proteins of this class are Cf proteins which confer resistance of tomato to the fungal pathogen Cladosporium fulvum (Rivas and Thomas, 2005).
This mode of recognition leads to co-evolutionary dynamics between the plant and the pathogen that are quite different from those associated to PTI as, in contrast to PAMPs, effectors are dispensable molecules although usually necessary for pathogenicity. This specific recognition represents the second line of active defence known as specific
Figure 8. Model of integrated decoys in NLR protein pairs (From Cesari et al., 2014).
Pathogen effectors target host proteins for manipulation in order to promote infection.
(A) Indirect recognition of effectors occurs when target proteins are guarded by host NLR proteins,
(B) or if duplicated target genes evolve to encode decoy proteins monitored by host NLRs.
(C) Alternatively, the decoy may be integrated into the structure of the receptor component of an NLR pair, allowing effector recognition by direct binding.
Pathogen genotype
Plant genotype Avr (Avirulent) avr (virulent)
R (Resistant) Resistance (HR) Disease
r (Susceptible) Disease Disease
Table 1. Genetic model of the gene for gene theory (From Flor, 1971).
The resistance of the plant, often associated with the HR, is only established if the plant carries an R gene corresponding to an Avr gene in the pathogen. In all other cases, disease occurs.
(A) Guard model
(B) Decoy model
23
resistance and commonly termed effector-triggered immunity (ETI) (Jones and Dangl, 2006)
(Figure 3).
Variation in host resistance is often controlled by the segregation of single R genes (Hammond-Kosack and Jones, 1997). The genetic interaction underlying the induction of this type of resistance is typically explained by the "gene for gene" model (Flor, 1971). This classic concept is based on the observation that a plant carring a dominant resistance gene (R) is resistant when it interacts with a pathogen that expresses a dominant and complementary effector protein historically called avirulence protein (Avr). In the absence of the R protein and/or the corresponding avirulence protein, the pathogen is not detected by the plant, which results in the establishment of disease (Table 1) (Gassmann and Bhattacharjee, 2012). The first biochemical interpretation of this hypothesis was a receptor– ligand model that implies that plants activate defence mechanisms upon R-protein-mediated recognition of pathogen-derived Avr gene products (Table 1).
More recent studies showed that direct recognition of Avr gene products by R proteins is the exception rather than the rule and that a more prevalent mode of recognition exists that involves indirect interaction mediated by accessory-proteins that the immune receptor associates with and in which it recognizes effector-induced modifications. These accessory proteins that mediate indirect recognition may either be direct virulence targets of the effector (guard model) (Dangl and Jones, 2001, Dodds and Rathjen, 2010) (Figure 8-A) or decoy proteins that the plant has evolved to mimic real effector targets (decoy model) (Hou et al., 2011, van der Hoorn and Kamoun, 2008) (Figure 8-B). In some cases,a decoy protein fused to a member of an NLR pair may act as bait to trigger defence signalling by a second NLR member upon effector binding (integrated decoy model) (Cesari et al., 2014, Delga et al., 2015) (Figure 8-C).
Figure 9. Major signalling mechanisms in plant defence.
PAMPs perception by PRR induces rapid (seconds) immune receptor complex formation at the plasma membrane and different auto- and transphosphorylations of the actors involved (1). BIK1 becomes quickly phosphorylated and released from the PRR complex (2). Phosphorylated Botrytis-induced kinase1 (BIK1) has a higher binding affinity for respiratory burst oxidase homolog D (RBOHD) and phosphorylates it (3). At the same time, BIK1 also activates Ca2+ channel(s) and
induces Ca2+ influx. A Ca2+ burst occurs (30 s to 2 min) and reaches a peak at around 4–6 min (4).
This Ca2+ influx induces opening of other membrane channels (influx of H+, efflux of K+ and Cl–),
which leads to extracellular medium alkalinization (1 min) and depolarization of the plasma membrane (1–3 min) (5). A ROS burst then rapidly occurs (2–3 min) via RBOHD and peaks at around 10–14 min (6). Full activation of RBOHD requires phosphorylation by BIK1 and Ca2+
-induced Calcium-dependent protein kinases (CDPKs) (6). Ca2+ also regulates RBOHD through direct
binding or modification of the protein (6). RBOHD produces O2.– in the apoplast, which is
converted into H2O2 by superoxide dismutases (SOD) (7). H2O2 can enter the cytosol and the different organelles of the cell and is capable of inducing cytosolic Ca2+ elevations (8). 14-3-3
proteins modulate the activity of RBOHD and CDPKs (9). Effector recognition induces rapid immune response (10). Mitogen-activated protein kinase (MAPK) modules are activated in a few minutes leading to transcription factor (TF) activation (11). TFs participate in the regulation of several thousand genes (12). SA, JA, and ET signalling pathways then contribute to downstream regulation of gene expression (13). Crosstalks also occur with other phytohormones (14). This complex signalling network finally leads to the implementation of plant-induced defences, such as the production and secretion of antimicrobial compounds and the generation of toxic ROS (15). Arrows denote enzymatic pathways, transport, or regulation (see text for more details). ABA: abscisic acid; BR: brassinosteroid; CK, cytokinin; ET: ethylene; GA: gibberellic acid; JA: jasmonic acid; P, Phosphorylation; SA: salicylic acid.
24
1.2.3. Signalling events during plant defence responses
Upon pathogen perception, the induction of defence mechanisms relies on a complex and interconnected network of signalling events (Bigeard et al., 2015). PTI and ETI share a set of downstream signalling components with distinct activation dynamics and amplitudes (Tsuda and Katagiri, 2010).
Transient changes in the ion permeability of the plasma membrane appear to be a common early element in defence signalling that stimulates ion fluxes across the plasma membrane (Ca2+ and H+ influx, K+ and Cl– efflux) resulting in elevation of cytosolic calcium ([Ca2+]cyt) (Reddy et al., 2011), concomitant membrane depolarization (Jeworutzki et al., 2010), medium alkalinization and cytoplasmic acidification (Bricchi et al., 2013) (Figure 9). Stimulus-specific responses are explained by the concept of the “Ca2+ signature” (McAinsh and Pittman, 2009), where duration, amplitude, frequency and spatial distribution are thought to encode stimulus-specific information that is decoded by various Ca2+-binding proteins including calmodulins (CaMs) and CaM-Like proteins (CMLs), which regulate the production of nitric oxide (NO) (Ma, 2011). In addition, roles of Ca2+/CaM interacting proteins such as CaM binding protein (CBP) and CaM-binding transcription activators (CAMTAs) have been identified in plant defence signalling cascades (Ma, 2011). Furthermore, calcium-dependent protein kinases (CDPKs) emerged as important Ca2+ sensor proteins in transducing differential Ca2+ signatures, triggered by PAMPs or effectors and activating complex downstream responses (Ma, 2011) (Figure 9). For example, overexpression of Arabidopsis AtCDPK1 confers broad-spectrum resistance to both bacteria and fungi (Coca and San Segundo, 2010). Moreover, emerging evidence suggests that specific and overlapping
CDPKs phosphorylate distinct substrates in PTI and ETI to regulate diverse plant immune
responses (Boudsocq et al., 2010) (Figure 9).
Subsequently, ROS production often referred to as “ROS burst” is an additional early response, starting only a few minutes after PAMP treatment and at a much slower pace during ETI. In Arabidopsis, the plasma membrane-localized nicotinamide adenine
25 dinucleotide phosphate-oxidase (NADPH), named respiratory burst oxidase homolog D (RBOHD), is predominantly responsible for ROS burst in response to pathogen attack (Torres et al., 2002). RBOHD is mainly controlled by Ca2+ via direct binding to EF-hand motifs and phosphorylation by CDPK (Dubiella et al., 2013). Recent studies have, however, revealed a critical role for a Ca2+-independent regulation of RBOHD (Kadota et al., 2014, Li et al., 2014). Biochemical analyses showed that RBOHD associates with the PRR complex in vivo, and that BIK1 directly phosphorylates RBOHD upon PAMP perception (Li et al., 2014,
Kadota et al., 2014). Furthermore, abrogation of ROS accumulation, either in the rbohD mutant or through inhibitor application, led to loss of the second peak of PAMP-induced biphasic Ca2+ cytoplasmic changes, demonstrating a positive feedback activation of ROS on Ca2+ signalling (Ranf et al., 2011).
14-3-3 proteins also participate in immune signal transduction. They were shown to interact with known components of immune signal transduction, such as NtRBOHD (Elmayan et al., 2007) or CDPKs (Camoni et al., 1998, Lachaud et al., 2013), and modulate their activity (Figure 9). The signal is further transduced by activation of mitogen-activated protein kinase (MAPK) proteins, typically functioning in a phosphorylation cascade that involves at least three interlinked protein kinases (MAPKKK, MAPKK and MAPK) which are sequentially activated by phosphorylation. Interestingly, a reduction of Ca2+ oscillations was observed upon MAMP perception using inhibitors of serine/threonine protein kinases and MAPK kinases, suggesting that Ca2+-PTI signalling is in part dependent on MAPK cascades (Ranf et al., 2011, Boudsocq et al., 2010). However, although other data suggest that MAPK activation may be independent of CDPKs (Boudsocq et al., 2010).Although several immune-related MAPK substrates have been identified that are involved in diverse cellular functions (Bigeard et al., 2015), almost half of bona fide immune MAPK substrates are Transcription Factors (TFs). In this context, the identification of MYB TFs, such as MYB41 or MYB44 (Hoang et al., 2012, Nguyen et al., 2012, Persak and Pitzschke, 2013), or WRKY TFs, such as WRKY33 or WRKY1 (Ishihama and Yoshioka, 2012), as targets of MAPK activity
Figure 10. Classic model established for the hormonal control of the plant defence (Addapted from David De Vleesschauwer et al., 2013).
Plant resistance is mainly controlled by two antagonistic hormonal pathways, those of SA and JA/ET. They respectively promote resistance against biotrophic and necrotrophic pathogens. Auxin induces the JA/ET pathway whereas, cytokinins and gibberellic acid (or gibberellin) induce the SA pathway. BRs regulate plant immunity through an SA-independent pathway. ABA appears to act as a negative regulator of defence against biotic stress, but plays a crucial role in responses to abiotic stresses. The arrows indicate activation or positive interaction and blocked lines indicate repression or negative interaction. Hormone abbreviations: ABA: abscisic acid; BR: brassinosteroid; CK, cytokinin; ET: ethylene; GA: gibberellic acid; JA: jasmonic acid; SA: salicylic acid.