HAL Id: tel-02870363
https://tel.archives-ouvertes.fr/tel-02870363
Submitted on 16 Jun 2020HAL is a multi-disciplinary open access
archive for the deposit and dissemination of sci-entific research documents, whether they are pub-lished or not. The documents may come from teaching and research institutions in France or abroad, or from public or private research centers.
L’archive ouverte pluridisciplinaire HAL, est destinée au dépôt et à la diffusion de documents scientifiques de niveau recherche, publiés ou non, émanant des établissements d’enseignement et de recherche français ou étrangers, des laboratoires publics ou privés.
”On-chip” astronomical instrumentation : bringing
polarimetric and spectroscopic capabilities to the
detector level
Sophie Bounissou
To cite this version:
Sophie Bounissou. ”On-chip” astronomical instrumentation : bringing polarimetric and spectroscopic capabilities to the detector level. Instrumentation and Methods for Astrophysic [astro-ph.IM]. Uni-versité Paris-Saclay, 2019. English. �NNT : 2019SACLS400�. �tel-02870363�
Th
`e
se
de
do
ctorat
NNT
:
2019SA
CLS400
“On-chip” astronomical instrumentation :
bringing polarimetric and spectroscopic
capabilities to the detector level
Th`ese de doctorat de l’Universit´e Paris-Saclay pr´epar´ee `a l’Universit´e Paris-Sud et au CEA
Ecole doctorale n◦127 d’Astronomie et d’Astrophysique d’ˆIle de France
Sp´ecialit´e de doctorat : Astronomie et Astrophysique
Th`ese pr´esent´ee et soutenue `a Saclay, le 27 novembre 2019, par
Sophie Bounissou
Composition du Jury :
Alain ABERGEL
Professeur, IAS Pr´esident Etienne LE COARER
Chercheur, IPAG Rapporteur Alfred KRABBE
Professeur, Universit´e de Stuttgart Rapporteur Carole TUCKER
Professeur, Universit´e de Cardiff Examinateur Willem JELLEMA
Professeur, SRON Examinateur Louis RODRIGUEZ
Chercheur, CEA Saclay (DAp) Directeur de th`ese Vincent REVERET
Chercheur, CEA Saclay (DAp) Co-encadrant de th`ese Herv´e GEOFFRAY
Chercheur, CNES Examinateur Laurent DUSSOPT
“On-chip” astronomical instrumentation :
bringing polarimetric and spectroscopic
capabilities to the detector level
Th`ese de doctorat de l’Universit´e Paris-Saclay pr´epar´ee `a l’Universit´e Paris-Sud et au CEA
Ecole doctorale n◦127 d’Astronomie et d’Astrophysique d’ˆIle de France
Sp´ecialit´e de doctorat : Astronomie et Astrophysique
Th`ese pr´esent´ee et soutenue `a Saclay, le 27 novembre 2019, par
Sophie Bounissou
Composition du Jury :
Alain ABERGEL, Professeur, IAS Pr´esident
Etienne LE COARER, Chercheur, IPAG Rapporteur
Alfred KRABBE, Professeur, Universit´e de Stuttgart Rapporteur
Carole TUCKER, Professeur, Universit´e de Cardiff Examinateur
Willem JELLEMA, Professeur, SRON Examinateur
Louis RODRIGUEZ, Chercheur, CEA Saclay (DAp) Directeur de th`ese
Vincent REVERET, Chercheur, CEA Saclay (DAp) Co-encadrant de th`ese
Herv´e GEOFFRAY, Chercheur, CNES Examinateur
Acknowledgements
Apr`es avoir r´edig´e ma th`ese en anglais, je m’autorise un peu plus de libert´e en switchant au fran¸cais qui me semble plus appropri´e ici.
Voil`a ! Trois ann´ees s’ach`event... et quelles ann´ees ! Une th`ese ¸ca vous change : bien sˆur, j’ai ´enorm´ement appris en sciences, mais j’ai le sentiment d’avoir encore plus grandi sur le plan personnel. Un peu h´esitante au d´ebut `a l’id´ee d’arriver dans un labo inconnu pour ma th`ese, les qualit´es scientifiques et humaines des personnes au CEA ne m’ont jamais fait regretter ce choix.
Je souhaite tout d’abord remercier les chercheurs qui m’ont fait le privil`ege d’ˆetre dans mon jury de th`ese. Merci `a Alfred Krabbe et `a Etienne Le Coarer qui ont lu mon manuscrit avec beaucoup d’attention. Je salue ´egalement la bienveillance et l’int´erˆet scientifique que m’ont t´emoign´es Carole Tucker et Willem Jellema `a la fin de ma th`ese et en particulier le jour de ma soutenance. Merci enfin `a Alain Abergel qui m’a suivie `a l’´ecole doctorale pendant ces trois ann´ees et `a Herv´e Geoffray du CNES de m’avoir permis de faire ce doctorat au CEA.
Pour r´ealiser une th`ese en R&D dans de bonnes conditions, il faut plusieurs ingr´edients. Le tout premier, c’est une id´ee un peu ´etrange d’un chercheur qui se dit que ce serait int´eressant de creuser dans une direction encore plus ou moins inexplor´ee.. Merci Vincent R. ! Je me suis ´eclat´ee, ce sujet m’a passionn´ee (et parfois mˆeme un peu hant´ee). Merci de m’avoir fait confiance en me laissant la libert´e n´ecessaire `a ma recherche, tout en m’encadrant jusqu’au dernier jour !
Ensuite, la recette d’une th`ese implique un directeur de recherche qui vous impressionne par l’´etendue de ses connaissances et qui ne compte pas les heures qu’il vous accorde ! Merci Louis R. pour tous les ´
echanges que l’on a eus, ils ont vraiment construit ma r´eflexion et guid´e ma recherche. Outre cela, quel bonheur de travailler avec toi ! Tu as raison, c’est essentiel de travailler avec des personnes que l’on appr´ecie. Un ingr´edient indispensable `a cette fameuse recette est un super binˆome de labo’. Merci Albrecht P. de m’avoir accompagn´ee tout au long du chemin. Ton aide, tes conseils et tes anecdotes herscheliennes et fifiliennes m’ont ´et´e si pr´ecieuses. Et puis c’est tellement plus amusant les manip’s avec toi ! A quand la prochaine “Ferme `a D´ed´e” par 40◦C ?
Pour r´ealiser une th`ese dans de bonnes conditions, il vous faudra aussi un Cyrille D. ! Et oui tout le monde a besoin d’un Cyrille D., qui produit un travail monstrueux et avec une motivation infaillible ... J’ai en m´emoire une journ´ee cauchemardesque que l’on avait pass´ee `a d´emonter, remonter, re-d´emonter, re-remonter, re-re-d´emonter et encore re-monter un cryostat parce que la colle de la tige qui actionne la
roue cassait `a chaque fois `a un endroit diff´erent et tu ne d´esesp´erais pas... Sache que ta pers´ev´erance m’a bluff´ee ce jour-l`a ! Le DAp a vraiment beaucoup de chance de t’avoir.
Viennent ensuite les coll`egues du LETI. Merci `a Laurent D. qui a suivi et dirig´e ma th`ese sur le plan technique, je suis tr`es contente et fi`ere que notre collaboration ait pu amener ce projet si loin ! Merci `a Abdel A. pour sa gentillesse et pour toutes ces discussions qui m’ont appris beaucoup sur la technologie silicium et les simulations. Val´erie G., merci pour ta sympathie et tes bons conseils, que ce soit en conf’ ou autre ! Et enfin, Gilles L., merci pour le temps que tu nous as consacr´e : ces lonnnnnngues journ´ees en salle blanche ont fini par aboutir `a quelque chose, merci mille fois !
Je dois aussi remercier : Obaid A. avec qui j’ai partag´e bien des discussions comsolesques, Jean-Luc S. (parce que j’adore tout simplement le personnage ! mais aussi...) pour sa bienveillance scientifique, J´erˆome M. parce qu’il m’a dessin´e de super montures pour mes ´etalons mais surtout pour sa bonne humeur claire-ment contagieuse ainsi que Didier D., Samuel R. et Pierre-Antoine F. pour tous leurs conseils d’opticiens ! Merci `a Sandrine P. mˆeme si un projet commun n’a pu aboutir, `a Jacques D. pour les discussions sur la spectroscopie et pour son aide sur la polarim´etrie et `a Suzanne M. et Maud G. pour leur aide `a la pr´eparation de ma soutenance. Merci `a Vianney L. et Koryo O. pour le suivi qu’ils m’ont consacr´e pendant ces trois ann´ees ! Je remercie aussi Olivier L. pour son aide avant soutenance. Merci `a Pascale D. pour le soutien qu’elle m’a apport´e, mˆeme apr`es avoir quitt´e le CEA !
Pour une th`ese qui se d´eroule dans la bonne ambiance, choisissez ´egalement de supers coll`egues avec qui vous appr´ecierez partager des moments conviviaux. J’ai nomm´e : Michel L., Thierry T., Olivier B., Gamil C, Pascal G., Vincent M., Isabelle L., Christian E., K´evin T., L´ea B., Mathieu C., Luc D., Patrick M., Eric D., Michel T., Philippe F., Marc S., Ayoub B., Pam-pam B., Paul S., Yannick L., Manu G.,... et good luck `a Camille G. ! J’adresse un cheers particulier `a des coll`egues qui sont devenus des amis : Diana R., Thibault P., Marin P. et Fran¸cois V. . Merci pour tous ces bons moments pass´es, je sais qu’il y en aura d’autres ! J’ai aussi une pens´ee pour Jess’ (mon ancienne super co-bureau qui est actuellement une super maman) et pour Paula T. et Iacopo B. ! Merci aussi `a ma Tat’ de m’avoir sorti la tˆete de mon ordi `a bien des reprises, t’as ´et´e une acolyte parfaite : de running, de spectacles en tout genre, et bien sˆur d’ap´ero !
Je remercie chaleureusement mes famille et belle-famille pour leur soutien. En particulier, merci `a mes parents qui m’ont offert la chance de choisir ma voie, en me rappelant souvent de profiter de toutes les exp´eriences de la vie. Mention sp´eciale `a Flo’ pour son aide avec la bibliographie, tu m’as fil´e un vrai coup de pouce !
Last but not least... Baptiste. Il y a approximativement un milliard de raisons pour lesquelles je devrais te remercier ! Pour n’en citer qu’une parce qu’elle est particuli`erement repr´esentative de ta gentillesse `a mon ´egard : merci de t’ˆetre enfil´e huit ´episodes d’une s´erie la derni`ere nuit de ma r´edaction, juste pour rester avec moi ! Tu rends ma vie tellement plus simple, et aussi terriblement plus belle.
Contents
Introduction
1 Advancement of astronomical research due to progress in instrumentation and
analy-tical methods 5
1.1 Introduction of instrumentation for astronomy . . . 6
1.2 Scientific opportunities for future polarimetric and spectroscopic imaging instruments . . . 10
1.2.1 The effects of magnetic fields in the process of star formation . . . 10
1.2.2 The [CII] cooling line as tracer of the ISM . . . 14
1.2.3 The B modes : the new frontier of Cosmic Microwave Background science . . . 18
1.3 Potential for simplification of future instruments . . . 22
2 Bolometers for far-infrared/ (sub)-millimeter observations 25 2.1 Bolometers : more than 100 years of research . . . 27
2.1.1 The invention of the first bolometer . . . 27
2.1.2 General description of bolometers . . . 28
2.1.3 Evolution of the bolometer technology . . . 35
2.1.4 Other detectors in the sub-millimeter field . . . 37
2.2 Bolometers at CEA . . . 40
2.2.1 The PACS bolometers . . . 40
2.2.2 From PACS bolometers to B-BOP bolometers . . . 46
2.2.3 Perspectives . . . 49
3 Optimization of the spectral absorption of polarimetric bolometers for SPICA/B-BOP instrument 51 3.1 Introduction to linear polarization . . . 52
3.1.1 Definition of Stokes parameters . . . 52
3.1.2 Classical measurements of any polarized state . . . 55
3.3 The SPICA/B-BOP polarimetric imager instrument . . . 61
3.3.1 The SPICA mission : scientific objectives and instruments . . . 61
3.3.2 B-BOP : a polarimetric imager . . . 62
3.4 Optimizing the design of the detectors in the three channels of the B-BOP instrument . . . 64
3.4.1 Optimizing the physical parameters of the detectors . . . 65
3.4.2 Minimizing the cross-polarization . . . 66
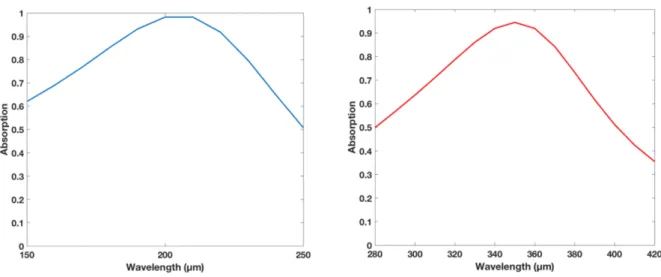
3.4.3 Adapting the 200 µm- and the 350 µm-channels from the 100 µm- detectors . . . . 68
3.5 Perspectives . . . 69
3.5.1 New design of the focal plane . . . 69
3.5.2 Deriving the Stokes parameters from the detectors signal . . . 70
4 Development of a compact spectroscopic imager 75 4.1 State of the art of spectroscopy for far-infrared/sub-millimeter astronomy and new develop-ments towards compact spectrometers . . . 77
4.1.1 Spectrometers for far-infrared/sub-millimeter instruments . . . 77
4.1.2 Towards compact spectro-imaging instruments . . . 86
4.2 Compact spectroscopic imager using Fabry-Perot Interferometer (FPI) . . . 92
4.2.1 Adding the spectral selectivity to the detector . . . 92
4.2.2 Conventional Fabry-Perot Interferometry in the sub-millimeter range . . . 97
4.2.3 Optimizing the spectral finesse of the FPI . . . 101
4.2.4 Coupling the FPI with the detector . . . 111
4.2.5 Conclusions of the chapter . . . 125
5 Experimental validation of the spectroscopic capability of compact Fabry-Perot Inter-ferometers based on dielectric mirrors for combination with bolometer arrays 127 5.1 Building mirrors with dielectric materials for compact FPIs . . . 128
5.1.1 Building the dielectric mirrors in collaboration with LETI . . . 128
5.1.2 Validation of the quality of dielectric layers for mirrors . . . 130
5.1.3 Assembling the mirrors . . . 135
5.1.4 Validation of the theoretical model by Time Domain Spectrometer (TDS) measure-ments at ambient temperature . . . 140
5.2 Validation of the performance of Fabry-Perot etalons based on dielectric mirrors . . . 140
5.2.1 Description of the cyrogenic optical train . . . 140
5.2.2 Measuring the finesse of multi-layer silicon etalons . . . 145
5.2.3 Measuring the transmission of multi-layer silicon etalons . . . 154
5.4 Conclusions of the chapter and perspectives for the future experiments . . . 162
Conclusion 163
A Derivation of the Airy formula for Fabry Perot interferometry 169
B Solution based on micro-structured silicon 173
C CMB bands defined by the LiteBIRD mission 177
D Calculation of the spectral and spatial effects of a Fabry Perot located in the focus of
a beam for different nominal finesses. 179
E Upgrade of the FTS Optical Train 181
E.1 Configuration of the system before the upgrade . . . 181 E.2 Upgrade of the optics design . . . 182 E.3 Implementation of the FTS optics upgrade . . . 184
Introduction
Up to the recent detection of gravitational waves, light was the main messenger from the Universe. It has brought us an incredible amount of information about celestial objects that are, for now, unreachable. With the discovery that the electromagnetic spectrum is not restricted to the visible light, instrumentation has continuously evolved to help astronomers observing the full spectrum. While the X-rays highlight the violent and energetic reactions related to ionization, the infrared and radio-waves trace the cold Universe (for low redshift). With light as the only probe, one can get the global picture of phenomena like physical processes and chemical composition in a specific region of the sky. Building telescopes sensitive to any wavelength (if possible), in the highest and driest places on Earth was therefore necessary to collect the maximum amount of photons which can travel through the atmosphere. To observe wavelengths that are absorbed by the atmosphere, telescopes fly onboard balloon, aircraft or spacecraft. Every small structure in the sky is investigated by increasing the size of the telescope mirrors and when one single dish cannot meet the spatial resolution required by science, several telescopes are used to artificially create one dish the size of the maximal distance between telescopes. In addition of observing smaller details, it is also possible to observe further in distance : astronomers are, indeed, able to travel in time and even more, to get back to the first light of the history of the Universe.
When travelling towards the Earth, light brings a large number of precious data. The function of an instrument is to grab the fraction of information relevant for astronomical purposes. In particular, besides the different wavelength range, it may be useful to observe the intensity of a source as a function of time, to study one or several specific lines of the spectrum (spectroscopy) or to probe the preferential direction of the electric field of the wave (polarimetry). The two latter aspects are the ones which we are particularly interested in in this thesis. As always, science drives the evolution of instrumentation (the reverse is also true) and it turns out that the requirements are becoming more and more challenging. Indeed, the current need is to have several light analyzing functionalities within the same instrument. This is, for instance, related to the need for mapping the polarization of light or fine-structure lines in star-forming regions. There are even some scientific targets where polarimetry, (low-resolution) spectroscopy, and imaging are required, and preferably in one homogeneous observation. Here, we are, in particular, interested in having
the polarimetric and the spectroscopic capabilities (in a first attempt, independently) brought to the level of the detection array. The idea of having several instrumental functionalities in a very compact form, has become possible only because of the progress in micro-technologies. In our developments, we are benefit-ting from the expertise of CEA/LETI in the silicon microelectronics field. This fruitful collaboration has resulted in the bolometers for the HERSCHEL/PACS photometer at the beginning of this century and will make achievable the challenging polarimetric detectors for the SPICA/B-BOP instrument. The concept of extending the instrumental capabilities by adding more functionalities within the bolometer array aims at paving the way to detectors which could become the whole instrument. Assuming that multi-function detectors could reach the same performance as current instruments (related to science requirements), one would gain a lot in terms of simplicity, mass and volume budgets, cryogenics autonomy, ...
This thesis studies the possibility to implement the light analysis functions, namely polarimetry and spec-troscopy, at the level of the bolometer array. At the beginning of this thesis, the original idea behind the polarimetric pixels had already demonstrated its working principle. The work presented here consists in the optimization of the design and in the characterization of certain performance parameters of the polari-metric pixel. Concerning “on-chip” spectroscopy, I had the chance to select the object of my research since this domain had been sparsely studied in our team. The objective was to develop a concept which will introduce the spectroscopic capability within the pixel array and to experimentally validate this concept with the manufacture of a prototype. In this thesis, the absorption of the detector has been a key notion since the absorber plays the role of the transducer of the electromagnetic radiation. This is the reason why bringing the light analysis functionalities to the pixel array had been only possible by modifying either the design of the absorber or of the interferometric system the absorber is embedded in. Thus, the absorption of the detector has been the figure of merit throughout this work.
This thesis starts from the astrophysical motivation to the experimental work including the development of the theoretical concept.
Chapter 1 introduces some astrophysical and cosmological open questions that formulate the need for combining several instrumental functions, namely polarimetric and spectroscopic imaging, within one ins-trument.
The bolometer technology is described in chapter 2, from its invention in 1881 to the key milestones of bo-lometer evolution and the development of other detectors in the sub-millimiter field. This chapter lays the foundation for the next chapters, by also introducing the absorption process within the CEA bolometers. It also describes the reasoning which has led to pixels intrinsically sensitive to polarization.
Chapter 3, as a continuation of chapter 2, describes how the scientific questions arisen after HERSCHEL and PLANCK results, has driven the concept of the B-BOP instrument for the new SPICA mission. In
this chapter, I depict in detail the detector design and present my model and its results. The last part is dedicated to the new design of the pixels achieved by the B-BOP detector team.
Chapters 4 and 5 deal with the introduction of spectroscopy within the detector array. Chapter 4 is focused on the theoretical development of the spectro-imaging detector. From a review of compact spec-trometers, I picked one solution which seems to be the easiest to implement with an array while meeting high-spectroscopy performance : the Fabry-Perot interferometer (FPI). We then decided to introduce multi-layer silicon mirrors to improve the efficiency of the current state-of-the-art FPIs. The efficiency and the limitations of the spectro-imaging system are also estimated in this chapter.
In chapter 5, I outline the different steps that make possible the experimental validation of the multi-layer silicon FPI. First, I present the characterization and the assembling of these layers. The experimental cryogenic set-up is then depicted and lastly, results of the measurements and their analysis are shown.
Note that in the rest of this thesis, I will no longer use the pronoun ‘I’, since this work, and especially because it deals with experiments, has benefited from the contribution of several researchers and engineers.
Chapter 1
Advancement of astronomical research
due to progress in instrumentation and
analytical methods
Contents
1.1 Introduction of instrumentation for astronomy . . . 6
1.2 Scientific opportunities for future polarimetric and spectroscopic imaging ins-truments . . . 10
1.2.1 The effects of magnetic fields in the process of star formation . . . 10
1.2.2 The [CII] cooling line as tracer of the ISM . . . 14
1.2.3 The B modes : the new frontier of Cosmic Microwave Background science . . . 18
This chapter is focused on the evolution of astronomical opportunities with progress in instrumentation and methods. It aims at introducing three science topics that instrumentation presented in this thesis could address. In the first part, we point out some milestones that have contributed to breakthroughs in the way astronomers make observations. This historical review is clearly non-exhaustive and is oriented towards what will be presented in this thesis. The second part of this chapter is dedicated to the three specific science cases that remain unsolved and for which innovative instrumentation for spectroscopy and polarization experiments could achieve progress. The very end introduces the next chapters which deal more with instrumentation.
1.1
Introduction of instrumentation for astronomy
Astronomy occurs to be the oldest science since it was the first application of mathematics to an empirical phenomenon, the motion of heavens. Because what happens in the sky was considered as the manifestation of gods on Earth, it also impacted the human’s life in practice. In particular calendars have been established thanks to the position of stars and planets (“wanderer” in Greek : at the time this included the Moon and the Sun) within the year. Calendars have organized the civil life and agriculture, by informing farmers about the seasons, for the start of planting, for example. The need for these calendars has justified the invention of rudimentary tools (e.g. sundials) to very complex ones (e.g. astrolabes). Astronomy was also a powerful tool for navigation. The Sun and the stars were indeed good orientation points during long ship journey. Techniques and also instruments (especially on-board reliable chronometers) were developed. Nowadays, stars and planets are no longer used for time measurements and navigation ; astronomy has become exclusively a pure science, justified by the humans wish to understand their place within the Universe.
The evolution of astronomy together with the progress in the field of instrumentation has to be extended to that of physics. This is the reason why this part, which deals with the milestones of instruments for astronomy is interspersed with key historical events in physics and optics. The first breakthrough which marks the start of modern astronomical instrumentation corresponds to the invention of the refractive telescope in 1609. Although there is some doubt about the identity of the actual inventor of this new kind of instrument, Galileo was one of the first to use such an instrument for observations of the heavens while anything so far had been achieved with the bare eye. Refractive telescopes have been progressively improved over the years, but this kind of telescope presents a limitation due to the use of lenses. Indeed, lenses introduce optical aberrations in addition to the mechanical limitations of having large lenses in a telescope. Nevertheless, a solution was proposed to solve the aberration issues by increasing the focal length and by introducing mirrors to fold the induced long focus. The reflective telescope, proposed by Newton, in 1688, for astronomical purpose, overcame all the issues introduced by refractive telescopes. Shortly after (1666), Newton with his famous prism experiment, revolutionized the physics field by understanding that
white light is composed of a set of rainbow colors. Herschel went further, more than one century after (1800), still with a prism that disperses the Sun light. When he used mercury-glass thermometers to measure the radiation of several wavelengths, he noticed that, next to the outermost radiation of the visible spectrum, heat was still produced by an invisible radiation : he discovered the infrared radiation. The illustration of the Herschel experiment is shown in figure 1.1. Later, the ultraviolet (Ritter), radio waves (Hertz), X-rays (Rontgen) and gamma-rays (Villard) were discovered.
In the meantime, the understanding of the nature of light drastically evolved. In the second half of the
Figure 1.1: The Herschel experiment : Sun light is dispersed by a prism and thermometers are in charge of measuring the heat produced by each rainbow color (illustration by Vilmos Thernesz based on the original figure in Herschel (1800)).
19th century, Maxwell understood the relationship between the electric and the magnetic fields, how they influence each other to create and propagate an electromagnetic wave. He developed four equations that unify the physics of electricity and magnetism and the properties of materials. From theses equations, he also derived the result that the electromagnetic wave travels at the exact speed of light (first calculated by Romer, in 1676) and concluded that the light was an electromagnetic wave. In astronomy, the dispersion of light by optical elements such as gratings enabled Fraunhofer to measure the spectrum, i.e. the power distribution as a function of wavelength, including the dark lines, of the Sun in 1835. Spectroscopy was invented and appears quickly as a new way to investigate the sky, different from photography. Indeed, it is a powerful tool to learn more about the nature or the evolution of distant astronomical objects, simply by probing their composition. Lines, whether they are emitted or absorbed by the gas, correspond
to unique chemical elements and molecules. Spectroscopy is also the means to observe their distance through cosmological redshift, and their intrinsic motion, by measuring the Doppler effect. The study of the black-body radiation was the next breakthrough in physics which has found applications in astronomy. A black-body has a characteristic spectrum which only depends on its temperature. With Wien’s empirical law, the temperature of a black-body can be derived from its maximal emission wavelength through Wien’s law :
λmax× T = b (1.1)
where b ≈ 2898 µm.K is Wien’s displacement constant. Any body is not necessarily a black-body, but it happens that most astronomical objects can be approximated as a black-body or by a gray-body (i.e. a black body with a lower emissivity). A table of the corresponding frequency, wavelength, energy and temperature for the whole radiation spectrum is presented in figure 1.2. It shows, in particular, that short wavelengths are related to highly energetic events while it is the opposite for longer wavelengths. Then X- and γ-rays are related to the hottest ionized regions while the radio emission traces the cold Universe (assuming no redshift).
The 19thcentury has seen the start of the production of silver-on-glass mirrors for reflector telescopes. Since
Figure 1.2: Relationship between frequency f , wavelength λ, energy E and temperature T . The wavelength range which this thesis is focused on, has a white background.
then, the size of the mirrors has been increasing and this is still relevant today : the future E-ELT primary mirror will be 39-m in diameter. Nowadays the whole spectrum is exploited since it has been understood that different parts of the spectrum provide various complementary information. For regions of the spectrum which are not accessible from the ground, telescopes are sent onboard balloons, airplanes or spacecrafts. For example, X-rays are completely inaccessible from the ground while the terrestrial atmosphere is perfectly
transparent to radio waves. For far-infrared/sub-millimeter wavelengths (the range we are interested in in this thesis), some windows exist from the ground but require telescopes in the driest and highest places on Earth. The opacity of the atmosphere as a function of wavelength is illustrated in figure 1.3.
Depending on the astrophysical target, photometry, spectroscopy or polarimetry can be performed.
Time-Figure 1.3: Atmospheric opacity as a function of the wavelength. Credit NASA
dependent photometry has even made possible the tracking of the supernova evolution by measuring their light curves. Moreover, while instrumentation progress has increased the quantity of collected data, the introduction of new computational methods, such as Fourier Transform theory and the improvement of computing resources have enabled astronomers to process a large amount of data. Another example is the recent use of several radio-telescopes across the world to create one single virtual larger telescope, the Event Horizon Telescope (The Event Horizon Telescope Collaboration, 2019). Very long baseline interferometry drastically improves the resolving power of individual antennae, so much that the equivalent resolving power of the network is comparable to the one of a telescope with a diameter approximating the size of the Earth.
Up to the recent detection of gravitational waves, light has been the main messenger from the Universe. This thesis is focused on the far-infrared/sub-millimeter range, which can trace several kinds of astrophysical sources. A few of them are presented in the next section. Note that the words “far-infrared” and “sub-millimeter” refer to the wavelength range 50 µm - 1 mm. Kimmitt (1970) differentiates these words as follows : “the use of ‘far-infrared’ or ‘sub-millimeter’ depends on whether the method is derived from optical or microwave wavelengths”. However, in this thesis, techniques from both optical (especially in spectroscopy) and radio (in polarization) fields are applied to CEA bolometers, thus we use both terms indiscriminately.
1.2
Scientific opportunities for future polarimetric and spectroscopic
imaging instruments
In this part, we aim at reporting some of the scientific applications that would require the combination of different instrumental capabilities within one single instrument. Since the detectors that we use are dedicated to sub-millimeter astronomy, we will first focus on astrophysical applications linked to the cold Universe. The two following subsections are motivated by questions about the processes involved in star formation within the Interstellar Medium (ISM). We first describe the requirement of using a polarimetric imager to probe the magnetic field within the filaments in dense molecular clouds where stars may form. The second subsection develops the idea that astronomers would need maps of reliable tracers (as the [CII] cooling line) for a better understanding of the evolution of the gas and dust in the ISM. The last subsection slightly differs from the first ones because we shift our discussion to longer wavelengths to discuss cosmology and more precisely, polarization of the CMB that may require the collection of all the light information (photometry, low-resolution spectroscopy and polarimetry) within one instrument.
1.2.1 The effects of magnetic fields in the process of star formation
“What drives the star-formation process ?” is still an open question in astrophysics. The HERSCHEL Space Observatory (Pilbratt et al., 2010), launched in 2009, has delivered valuable data which have contri-buted to enhance significantly our understanding of the evolution of the ISM and of star formation. One of the main goals of the instruments onboard the far-infrared/sub-millimeter observatory was to map the structure of the gas in molecular clouds. Although large scale filamentary structures were known to exist in some interstellar clouds for a long time (Schneider and Elmegreen, 1979), the systematic nature of the pattern was not expected. HERSCHEL has demonstrated the ubiquitousness of these filamentary struc-tures in the ISM : interstellar clouds exhibit filaments on all scales as shown in figure 1.4 (Andr´e et al., 2013). These filaments play a key role in the star formation process : they could be the seeds of prestellar cores and ultimately of protostars, after the fragmentation of gas which leads to the formation of dense cores through gravity.
Other important results in this field have been derived from observations with HERSCHEL : for example, Arzoumanian et al. (2011) and Arzoumanian et al. (2018) found out that the filaments are characterized by a specific width of 0.10 ±0.06 pc. Thus the ISM, which looks chaotic at first glance, is actually well structured and constrained. The main process which drives the physics within the network of filaments in the ISM is still not well understood and requires deeper examinations. Gravity and supersonic turbulence are strongly involved in the process but the magnetic field may be the missing part of the puzzle (Crutcher, 2012). Indeed results from the PLANCK mission have pointed out that magnetic field is very
Figure 1.4: Column density map of a portion of the Polaris flare translucent cloud, derived from HERSCHEL data where contrast of filaments has been enhanced : the backbone of the filament network is highlighted in blue (Andr´e et al., 2013).
well organized : the field tends to be perpendicular to the high-density filaments but looks aligned with the low-density filaments (see figure 1.5). This observation may suggest that the magnetic field shapes the whole filamentary pattern by enhancing the accretion of matter in low-density filaments along field lines (Andr´e et al., 2019). Studying the morphology of the magnetic field inside denser filaments may also help to understand why the width is maintained constant whatever the filaments are.
Polarimetry is an indirect tool to observe the effects of magnetic field on the interstellar medium and in fact, the light polarization measured in the Universe can have different physical origins (Hildebrand, 1988; Tielens, 2005). While the effects of irregularly shaped dust grains on starlight were already known through the phenomena of extinction and reddening, Hall (1949) and Hiltner (1949) have first observed another effect : the polarization of starlight by these grains. Indeed the magnetic field tends to align the elongated grains perpendicular to the field lines since the spin axis of grains is the shortest one. As a
Figure 1.5: Column density (colors) from Planck data toward the Taurus molecular cloud. The ‘drapery’ pattern traces the magnetic field, orthogonal to to the thermal polarization (Planck Collaboration, 2016).
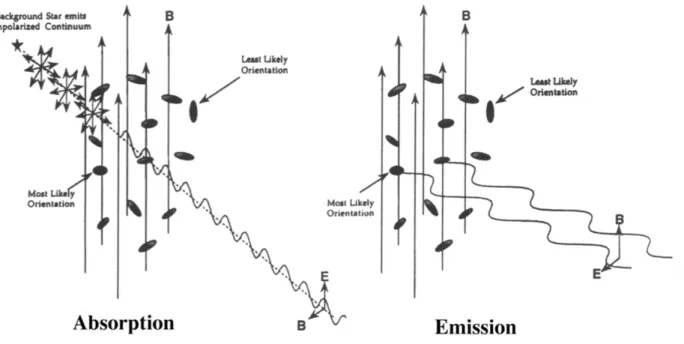
consequence grains absorb the unpolarized light of stars preferably in the direction of their alignment, leading to polarization of light parallel to the magnetic field in the UV/visible wavelength range. The induced polarization is often called “dichroic extinction” since it refers to selective attenuation of light in the direction of the alignment of grains (Wood, 1997). Measuring the polarization of light coming from one region of the sky gives access to the orientation of the magnetic field in this region. Another way to probe the magnetic field is to observe the polarization of the thermal emission of the dust grains themselves after they have absorbed the visible and UV radiations. This polarization also finds its origin in the fact that the spin axis of grains is aligned with the field lines. Hence grains will preferably re-radiate energy in the direction of their long axis, which is perpendicular to the field. Since the temperature of the molecular cloud is about a few tens of Kelvins, the emitted radiation lies in the far-infrared wavelength range. Figure 1.6 illustrates the polarizations by dichroic extinction and by thermal emission which are in fact orthogonal and which can be measured in different wavelength ranges. Because both polarizations originate from the alignment of the grains, they strongly depend on the nature of these grains (i.e. composition, size and shape).
Figure 1.6: Polarization of starlight by dust grains, extracted from Weintraub et al. (2000).
Future imaging polarimetry in the submillimeter field aims at examining the thermal polarized emission of dust in order to understand the role of magnetic fields in the evolution of filaments. SPICA (Roelfsema et al., 2018), the European/Japanese telescope scheduled to be launched in 2032, will have an instrument B-BOP dedicated to this purpose for example (see Andr´e et al. (2019) for an overview of the main science drivers). B-BOP is an imaging polarimeter that can reach high sensitivity due to the cooling of the primary mirror to 8 K and of the detectors down to 50 mK : the Noise Equivalent Power (NEP) of the detectors is ∼ 1 aW/Hz1/2 (Rodriguez et al., 2018; Adami et al., 2018). This advantage will allow B-BOP to achieve
the same signal to noise in polarized maps (a few percent up to 20% of polarization is expected in some interstellar regions) as the PACS photometer (Poglitsch et al., 2003b) of HERSCHEL for total power inten-sity maps. The main innovation of the B-BOP detectors, compared to the PACS photometer bolometers, is that they are intrinsically sensitive to polarization. They are comprehensively described in chapter 3. These detectors allow a very compact instrument design by integrating one of the optical functions directly into the device. The high spatial resolution with the SPICA telescope is also a strong argument in favor of the imaging polarimeter : significantly better than PLANCK spatial resolution (20-30 times higher due to a slightly larger primary mirror and a different sampling, although they cannot be compared directly because they do not work at the same wavelength (a factor ∼ 8 in wavelength)), B-BOP will be able to resolve the magnetic field inside dense filaments. This capability will enable astronomers to trace the morphology of the field, especially within dense filamentary structures where astronomers suspect that the field could change from perpendicular in the outer part to parallel in the inner part of the filaments. Instruments as SPICA/B-BOP, with better performance than previous instruments, will certainly push forward the
boundaries of our current knowledge of the evolutionary stages of filaments and of the formation of dense cores.
1.2.2 The [CII] cooling line as tracer of the ISM
The interstellar medium, that fills the space between stars, is the source of 25% of the visible light coming from a galaxy (Tielens, 2005). It is made of gas and dust (99% of the mass of the ISM is assigned to the gas (Ward-Thompson and Whitworth, 2011)). It is one of the key players that regulates the star formation of a galaxy. Indeed, the star formation rate of a galaxy is directly linked to the gas density through the Schmidt-Kennicutt law (Schmidt, 1959; R.C. Kennicutt, 1998). Understanding this complex medium will help to know more about the stars that are already formed but also to understand how the future stars will form. The “metallic” (see below) ISM originates directly from stars because it results from stellar winds, radiative emission or even supernovae (explosion of massive stars when they die or of white dwarfs) ; and the future stars will feed and emerge from this rich environment. After the Big Bang, the Universe was made of hydrogen and helium but it has evolved towards increasing complexity with the birth and death of stars which have introduced “metals” (atoms heavier than hydrogen and helium). The metallicity Z defines how metal-rich a galaxy is and precisely corresponds to the mass fraction of metals (as C, O, N, Fe . . . ). Similarly, we can define X and Y as the mass fraction of hydrogen and helium respectively. These definitions lead obviously to the equation X + Y + Z = 1 everywhere in the galaxy, although the metallicity is not necessarily constant over the full scale of the galaxy. Moreover metals in a galaxy become more abundant through the lifecycles of stars : stars produce heavy elements up to iron during their lives through the stellar nucleosynthesis and they expel these elements to the ISM through stellar winds or at the end of their lives when they explode, leading to an enrichment of the ISM. Observations provide insight into the cycling of matter between stars and ISM. This study requires data over the full electromagnetic spectrum to disentangle the different contributors to the radiation. For example the visible observations highlight the stars but dust tends to absorb the stellar radiation and to re-radiate light in the infrared (illustrated in figure 1.7). These processes lead to dark zones in the visible and to a bright continuum in the infrared. Hence the observations of a galaxy at different wavelengths depict different physico-chemical mechanisms.
Although the ISM generally takes the form of a diffuse warm gas, it also exists as dense and cold molecular clouds in other places, which builds a perfect stellar nursery. The gas and dust of the ISM are heated by stellar photons, X rays or cosmic rays through photo-ionization and photo-electric effects. As a consequence, the ISM becomes stratified depending on the optical penetration depth of the radiation field
Figure 1.7: Andromeda Galaxy (M31) in visible (Image credit : Robert Gendler) and infrared, at 250 µm (ESA/Herschel/SPIRE) : the visible range picture highlights the bright stars of the galaxy while the infrared range one shows the thermal radiation of cold dust due to absorption of the stellar radiation by dust grains.
through the cloud. Astronomers have chosen to describe this morphology as a function of the state of hydro-gen : ionized, neutral atomic or molecular. The sketch in figure 1.8 illustrates this three-layers stratification.
The ionized phase corresponds to the environment surrounding stars where the UV radiation from the stars ionizes the hydrogen atoms. In these so-called HII regions, a UV photon with energy greater than 13.6 eV hits an atom of hydrogen thus removing the electron which will collide and excite other electrons. In this phase the hydrogen species is mostly represented by H+, the temperature can exceed 10 000 K and densities can vary from 1 cm−3 in the diffuse regions to 105 cm−3 in the most compact regions (Chevance, 2016).
In the atomic phase, the hydrogen molecules have been dissociated (or not been yet formed) and the pho-tons with energy greater than 13.6 eV have all been absorbed in the previous layer, thus the hydrogen atom can no longer be ionized : the neutral atomic form of hydrogen dominates, the area is called HI region. Nevertheless, the photo-ionization of atoms for which the ionization energy is less than 13.6 eV can still happen in this region : the atomic phase consists of atoms (H, O, C) and ions (C+, Si+, S+). The dominant
Figure 1.8: Sketch of the three structured phases of the ISM : HII region (ionized), Photodissociation region (atomic) and molecular region. UV photons from stars travel the ISM and heat the gas and dust, the optical depth is different for photons depending on their energy. Cooling lines that can be used as tracers for each layer are indicated (Cormier, 2012).
heating in this medium comes from the photo-electric effect by UV radiation on dust grains : a photon will eject an electron from the grain which will excite neutral atoms and other electrons of the gas, leading to an increase of the temperature of the gas. Thus the ISM varies from 100 K in the cold neutral medium (CNM) to 8000 K in the warm neutral medium (WNM) and the density is about 50 cm−3 in the CNM while it can fall to 0.5 cm−3 in the WNM (Tielens, 2005). The transition region between the ionized region and a molecular core, where star formation may happen, is called the Photodissociation Region or Photo-dominated region (PDR). In this region, atoms such as carbon can still be ionized by far-UV radiation (carbon ionization potential : 11.26 eV) and the molecules are photo-dissociated by the incident photons ; it is the neutral atomic region surrounding molecular clouds (Hollenbach (1990) for more information). In this stratified model, the molecular phase is the deepest phase into the cloud and it may be the birth-place of stars : stars emerge from the gravitational collapse of these dense and cold molecular clouds. H2
is the dominant form of hydrogen in this region. Molecules of gas are more easily formed on the surface of dust grains, which act as a catalyst, and then evaporated. The low temperature in this phase increases the efficiency of molecule formation. Although H2 is the most abundant molecule, other molecules are present
such as CO, CS, HCN, O2or H2O (Chevance, 2016). H2is protected from UV radiations by its self-shielding
while the other molecules mostly rely on the dust to protect them from photo-dissociation. The molecular phase being the deepest phase in the cloud, only a small amount of far-UV and X (through cosmic rays) radiation reaches this zone and bypasses the shielding of molecules to heat the gas (by photo-electric effect on the dust grains or by photo-dissociation of molecules). In these clouds, the temperature goes down to 10 K and the density can reach high values from 100 cm−3 up to 1 000 000 cm−3 in the dense cores. These low temperatures will also enable star formation since the gravitation will overcome the gas pressure forces (Jeans instability). In short, the cooling of the gas and the shielding of molecules create an environment
suitable for a cradle of stars.
In this three-phase model, a photon from a star removes an electron from a dust grain or from a hy-drogen atom of the gas. This electron collides other electrons and heats the gas. The energy transferred by the electron to the gas can be radiate away by fine structure line emission. Spatial and spectral ob-servations of the emission (continuum and fine structure lines) of the gas and dust helps to understand the stages of the evolution of the ISM. Indeed, this emission fully depends on the chemical compositions, on the temperature and on the density of the medium. On one hand, the study of the bright continuum between 10 µm and 1 mm outlines the heating of dust ; on the other hand, the fine structure lines trace the cooling of the gas.
Depending on the phase of the medium, there are species which are more suitable than others to use for tracing the ISM cooling. For example, the [CII] 158 µm line, which corresponds to the electronic ground state fine structure transition of C+, is often the brightest line, accounting for 0.1-1% of intensity in the far-infrared regions (Stacey et al., 1991). The ionization of C0occurs in HII regions but also in photo-dissociated regions since the required energy (11.26 eV) is less than for hydrogen H0 (13.6 eV). Astronomers often use the [NII] 122 µm and 205 µm lines as complementary data to disentangle the contributions from HII and photodissociation regions to the observed [CII] line flux. However, the luminosity of the fine structure lines strongly depends on the metallicity of the galaxy. Cormier et al. (2015) have shown that in dwarf galaxies as in the Small and Large Magellanic Clouds where the metallicity is low (in comparison to the Milky Way), the [OIII] 88 µm line is the brightest. The observation tools must therefore be adapted to the galaxy. Regarding the molecular phase, because the direct detection of H2 is quite difficult, astronomers
track CO, the second most abundant molecule, which emits one line at 2.6 mm. Nevertheless, the C/CO zone transition is quite different from the H/H2 transition since CO is still photo-dissociated in the outer
part of the molecular phase, while H2 is no longer photo-dissociated, due to its shelf-shielding : thus there
exists a “dark zone” which is invisible in CO line emission. This means that the emission of the CO mo-lecule only traces a fraction of the molecular phase. With the C+ ion being present in this area and the excitation still sufficient, the [CII] line can therefore be used to unveil this CO-dark molecular component. In a more general way, the [CII] line can trace the ionized phase and a part of the neutral phase. So, used in combination with other tracers (such as the [NII] line), its observations can help to disentangle the different phases.
In a nutshell, the emission of the [CII] 158 µm line encompasses a large range of conditions of the ISM. It is the reason why instruments like PACS and HIFI onboard the HERSCHEL observatory and FIFI-LS and GREAT onboard SOFIA have chosen this probe ; future experiments as SPICA and Co-PILOT will also observe the C+ cooling line. The large interferometer ALMA is also able to observe the redshifted 158 µm line emitted from the early Universe, leading to a global picture of the evolution of the ISM throughout
time. The Co-PILOT balloon experiment (C+ observations with PILOT), for instance, aims at mapping the [CII] line over a wide field of view with a 2’ angular resolution. The main goal of this experiment would be to resolve the boundary layers of molecular clouds in the Milky Way (and other galaxies of the Local Group), as the COBE/FIRAS instrument did (Bennett et al., 1994) but with an angular resolution 200 times better. For this purpose, the instrument onboard the balloon-borne experiment will need to combine arrays of detectors with a spectral capability. In this thesis, we propose a solution for a very compact spectrometer which could be suitable for this kind of scientific target.
1.2.3 The B modes : the new frontier of Cosmic Microwave Background science
In this last subsection about specific science that can be studied with new compact instrumentation, we want to broaden the discussion to open cosmological questions, since the technology choices taken in this thesis are not restricted to sub-millimeter applications. In the following, we discuss the next challenge in the Cosmic Microwave Background (CMB) field : detecting B modes. As will be explained, B-modes detection requires polarimetric imaging in several spectral bands.
In 1948, G. Gamow explained that the atomic species that we can observe in all directions of the universe are the main result of the evolution of the primordial matter at the earliest stages of the expansion of the Universe (Gamow, 1948). Following Gamow’s path, R. Alpher and R. Herman (Alpher and Herman, 1948) predicted that this expansion must have cooled down the early extremely hot-and-dense Universe to a temperature of about 5 K. In 1965, A. Penzias and R. Wilson from the Bell Telephone Laboratories in New Jersey accidentally measured an excess noise at a 3.5 K temperature coming from all over the sky (Penzias and Wilson, 1965), that they interpret, with another scientific team from a Princeton laboratory, as being the Cosmic Microwave Background (CMB), the leftover glow from the Big Bang. Shortly after the Big Bang, the Universe was made of a white-hot soup where no light was able to escape. The photons from the highly-ionized plasma (baryons, electrons and photons) were scattered by the electrons, and thus were trapped in this soup, leading to an opaque Universe. As the Universe was expanding, the plasma became cooler and protons and electrons combined to form the first atoms (mostly hydrogen) without being photo-dissociated. Around 380,000 years after the Big Bang, the interaction rate between electrons and photons decreased because of the lower electron density, allowing the photons to travel freely in the Universe. This period is called the period of decoupling between light and matter. The mean free path of photons grew towards reaching the Hubble’radius (i.e. the size of the observable Universe) : the Universe became trans-parent to light. The CMB corresponds to the radiation of the last scattering surface : photons from the CMB are remnants of the first electromagnetic waves and they saved the information about the spatial distribution of matter 380,000 years after the Big Bang. At this time, the temperature of the Universe was about 3000 K which corresponds to infrared wavelengths but with the expansion of the universe, the temperature dropped down to about 3 K today, the radiation became less energetic and the wavelength has
been stretched to the millimeter range. With the expansion of the Universe, the temperature of the CMB will continue to drop and the wavelength associated to the radiation will be more and more redshifted. Observing today this 3 K-radiation in all directions of the sky appears to be one of the strong evidences of the Big Bang theory because this shows that there was a time where the Universe was in thermodynamic equilibrium and every element of the plasma was at the same temperature. We now know that this CMB radiation that we observe at a distance of 13.8 billion light years from us (z=1100), represents 95% of the electromagnetic energy that we receive from the Universe, on a global scale.
The second milestone has been reached by the COBE satellite (1989-1993) which had three scientific ins-truments onboard. Soon after launch, one of them, the FIRAS (Far-InfraRed Absolute Spectrophotometer) instrument, measured the spectrum of the CMB and showed that it perfectly fits a blackbody spectrum (as defined by M. Planck in 1901) with a temperature of 2.735±0.06K (Mather et al., 1990), which corresponds to a wavelength peak at about 2 mm ; to date it is the best-known blackbody (figure 1.9).
Figure 1.9: First spectrum fo the CMB from FIRAS observations, compared to a blackbody emission. Data with 1% error bar (Mather et al., 1990).
Later more advanced data processing has refined this value to 2.725±0.002 (Mather et al., 1999). Ano-ther instrument, called DMR (Differential Microwave Radiometer), contributed also to the success of the mission by mapping the deviations from the blackbody temperature : the tiny temperature variations are called anisotropies of the CMB. After subtracting the galaxy background and the dipole effect (due to motion of the Solar system), temperature fluctuations (∆T/T) have been estimated to the order of 10−5 from point to point on the sky (Smoot et al., 1992). This discovery has strongly supported the Big Bang theory : the uniformity of the 2.72 K-radiation in all directions of the sky suggests that all the spatial points in the Universe have a common origin but the anisotropies correspond to the early density variations that
are the seeds of the large-scale structures in the Universe (clusters, galaxies and stars) that we see today. The anisotropies of the CMB have also allowed to strongly constrain the six parameters that are needed to fully describe the Universe within the Λ-CDM model (Λ Cold Dark Matter) by using the data from the WMAP (Wilkinson Microwave Anisotropy Probe) satellite (2001-2010) and then from the PLANCK satellite (2009-2013) (Planck Collaboration, 2018) . The anisotropies measured by WMAP and PLANCK are shown in figure 1.10.
Figure 1.10: Anisotropies of CMB at 2.72 K from WMAP and PLANCK satellites [NASA].
Nowadays CMB remains an active field with ongoing studies as cosmologists are facing a new promising topic : the polarization of the CMB. Indeed, the polarization of the CMB is one of the missing pieces that will increase our knowledge of the history of the Universe. Polarization is a different probe than temperature to map the anisotropies ; in a perfectly uniform glow, the radiation would have been unpolarized. This polarization comes from the Thomson scattering at the time of the last scattering period : an electron in an anisotropic plasma sees different intensities depending on the hot and cold spots around it, it oscillates in one preferential direction, producing a polarized wave. The degree of polarization of the CMB is about 10%. The anisotropies of the plasma at the origin of this polarization may be due to density fluctuations (scalar fluctuations) and the polarization is called E-modes, or due to distortions of space by the primordial gravitational waves (tensor fluctuations) and the polarization is called B-modes. The E and B modes can be
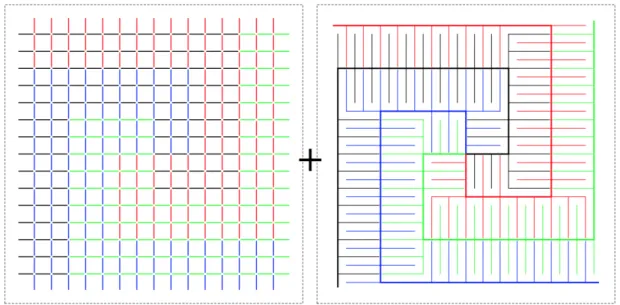
differentiated by their properties of symmetry : E is even while B is an odd function (figure 1.11). Detecting
Figure 1.11: E and B modes.
the B-modes of the CMB at degree angular scales, will support the theory of the cosmic inflation that would have happened shortly (∼ 10−32s) after the Big Bang and that would have expanded the Universe with an exponential rate, producing gravitational waves. If the E-modes have already been caught by the PLANCK satellite, the B modes are still part of the challenges that cosmology would have to address. The B modes are very difficult to observe because they are considerably faint : the B modes are expected to be more than three orders of magnitude less prominent than the anisotropies of the CMB (see figure 1.12, left). These numbers are the result of predictions but it could occur that these B-modes are much fainter. If we want to push the limits of our knowledge of the history of the Universe, scientific instruments must be always more sensitive. In 2014, the BICEP2 collaboration thought that they had mapped the B-modes of the CMB, but the polarization that they observed was the result of the dust emission of our own galaxy (Ade et al., 2015). To be able to identify such faint sources as B-modes, we need to remove all other contributions to polarization : galactic foregrounds, synchrotron emission, E modes, B modes due to the lensing of E-modes by large scale structures at relatively late time, etc . For this, we need to characterize the emission level of each component and this can only be done by recording the polarization in several spectral channels to discriminate each contribution to the polarization, this is what is presented in figure 1.12, right. The Japanese mission LITEBIRD, planned to be launched in 2027, is one of the candidates competing for the discovery of B-modes. For this, the telescope will have 15 frequency bands from 40 to 400GHz onboard (Suzuki et al., 2018). In this thesis, we present detectors that are sensitive to far-infrared polarization (chapter 3). The working principle of these detectors could be scaled to longer wavelengths for CMB purpose. We could also take benefit from the spectrometric capacity developed in this thesis (chapters 4 and 5) to modify the intrinsic spectral selectivity of these detectors to adapt it to specific bands as it is required for CMB missions (shown in figure 1.12, right).
Figure 1.12: (Left) Simulated power spectra of anisotropies in intensity and polarization (Page et al., 2007; Piat, 2008) ; (right) Different contributions to polarization as a function of frequency. Planck channels are shown in grey (Planck Collaboration, 2018).
1.3
Potential for simplification of future instruments
The current and future requirements of astrophysics and cosmology imply having ever more complex instruments. The focal planes must be always larger, the detectors have to be more sensitive from one mission to the next one, and so on. Here we are interested in combining different optical functions in the same instrument, namely imaging, polarimetry and spectroscopy. This means that science targets such as the ones presented above could be addressed. Keeping in mind these objectives, we want to extend the instrument capabilities by adding more functionalities to the simple photometer. However, we decided to do so at the level of the focal plane array. Therefore, we create pixels which are intrinsically sensitive to polarization and we want to add the spectral capability to the detection array (i.e. in a very compact way). In a longer-term, we could imagine to have all functionalities in the same pixels array. A spectro-imaging polarimeter array could for example, be one of the ‘off the shelf’ technology that suits the CMB requi-rements, providing a scaling of the detectors. In short, this thesis aims at investigating the possibility to have several light analysis functions in the same compact device to simplify the overall instrument. The benefits of compact instruments are quite straightforward : mass, volume, simplicity, ... These advan-tages are also reinforced by the fact that our instruments work at very low temperature. As a consequence, the total mass of the instrument to cool down must be as low as possible. Nevertheless, combining several instrumental capabilities in a compact way may affect the performance of each individual function. In this
thesis, in addition of presenting the current developments, we will discuss the impact on performance of having these various light analyzing functionalities within the pixels or at least, in the focal plane.
Chapter 2
Bolometers for far-infrared/
(sub)-millimeter observations
Contents
2.1 Bolometers : more than 100 years of research . . . 27 2.1.1 The invention of the first bolometer . . . 27 2.1.2 General description of bolometers . . . 28 Parameters to optimize . . . 29 General equations . . . 30 Noise . . . 32 2.1.3 Evolution of the bolometer technology . . . 35 2.1.4 Other detectors in the sub-millimeter field . . . 37 2.2 Bolometers at CEA . . . 40 2.2.1 The PACS bolometers . . . 40 2.2.2 From PACS bolometers to B-BOP bolometers . . . 46 2.2.3 Perspectives . . . 49
The detection of a natural phenomenon can be usually understood as the conversion of a physical quantity to an electric signal. The method for detecting electromagnetic radiation really depends on the wavelength of the radiation. Moreover we have seen in chapter 1 that observations in various wavelengths ranges bring complementary information of astrophysical sources. As a consequence, the choice of the de-tector used must be adapted to the observation frequency range in order to get the best from measurements. This thesis is focused on thermal detectors, i.e. bolometers, for far-infrared astronomy, since they are one of the prime choices for detectors in this range (together with KIDs and photoconductors). Detectors based on the same physical principle as bolometers are used for X-rays spectroscopy and are called “calorimeters”. One difference exists however, bolometers for far-infrared detect the intensity of the incoming wave while calorimeters can resolve the energy of individual X-ray photons. Concerning other wavelength domains, although thermal detectors can in principle be used for the whole spectrum, photodiodes are favored for far UV to near IR measurements. These detectors rely on the internal photoelectric effect : when a photon strikes a semi-conductor material, provided the photon is energetic enough, the transferred energy allows the creation of an electron-hole pair which raises the electrical conductivity of the material. Applying a bias voltage to the detector allows one then to measure the change of current. In practice this kind of detection can be used up to 100 µm since at longer wavelengths the incident radiation is no longer ener-getic enough, compared to the bandgap of most semiconductor. It has to be noted that for the PACS and FIFI-LS spectrometers onboard HERSCHEL and SOFIA respectively, Ge :Ga photoconductors have been mechanically stressed to push forward the cut-off wavelength to 200 µm (Poglitsch et al. (2003a), Fischer et al. (2018)). In the radio wave field, detectors use antennas to couple the wave to the detection system. In this chapter, our goal is to present a brief overview of thermal detectors and to focus on highly-resistive bolometers for far-infrared astronomy, since they are the historical devices and the current technology used at CEA. However, more recent developments such as superconducting bolometers or kinetic inductance detectors will also be presented. We will first try to provide a detailed picture of the invention of the bolometer and then some general characteristics of the bolometer behavior. We will also present some key technological milestones achieved in the field which have led to the current bolometers that we work on at CEA. Lastly, we will come back to the evolution of bolometers at CEA, from PACS bolometers, which have flown with the HERSCHEL space observatory, to the B-BOP technology of the future space mission SPICA. The first section is an overview of the field which also appears in many other thesis (Buzzi (1999); Reveret (2004); Billot (2007) in particular). The last section of this chapter is dedicated to the bolometers that have been thought, designed and built at CEA, from a strong collaboration between DRF/IRFU/DAp in Saclay and DRT/LETI in Grenoble.
2.1
Bolometers : more than 100 years of research
Here we describe in a non-exhaustive way several key events of the bolometer history : from Langley’s invention to the different milestones which have led to today’s bolometers. This section aims at introducing the technology description of CEA silicon bolometers.
2.1.1 The invention of the first bolometer
The bolometer has been invented by an American astronomer, Samuel Pierpont Langley (1834-1906) (see biography by Loettgers (2003) for more details). After trying to improve thermopiles1 for decades to measure the radiant heat from the infrared spectrum of the Sun, he concluded that the field needed a new instrument, more reliable and more sensitive. In 1881, a paper published in Nature (Langley, 1881), described the new concept of bolometer, or ‘actinic balance’ :
“Two strips of thin metal, virtually forming arms of a Wheatstone’s bridge, placed side by side in as nearly as possible identical conditions as to environment, one only of them being exposed to radiation. Such radia-tion would slightly warm the strip and therefore alter its electric resistance, and the amount of this change would be indicated by the movement of the needle of the galvanometer placed in the middle circuit of the “bridge” ”.
Then a bolometer converts radiation heating into variations of the electrical impedance and a galvanometer records the change of current flowing through the bolometer. With this simple definition, the bolometer becomes a universal detector that could work, in principle, in every frequency range. Figure 2.1 illustrates the principle of the Langley’s experiment. The top figure shows the ebonite cylinder which contains a series of diaphragms in front of the metallic strips which are located at the end of the tube. The bottom figure sketches the Wheatstone bridge which allows one to measure the variation of the electrical resistance of ‘M’, caused by the incident radiation, via the imbalance of the bridge. The performance of the bolometer was far better than any thermopile : the bolometer allowed Langley to measure changes in resistance that correspond to heating of the metallic part of 10 µK ! Langley found the sensitive instrument he was looking for and used this breakthrough invention to observe the solar spectrum. The details of the experiment are explained in Langley (1900a,c,b) : Langley used a bolometer combined with optics including a prism and called this whole set-up a “spectrobolometer”. In addition of its contribution to the knowledge of water vapor absorption by earth’s atmosphere (Langley, 1902), the measurements made by Langley with its spectrobolometer have announced early signs of the discovery of Planck’s law about black body emis-sion. Indeed, in Langley (1881), he presented his recent results about the solar spectrum, demonstrating that the heat maximum recorded on a bolograph (intensity as a function of the wavelength) was shifted to shorter wavelengths despite his contemporaries’ thoughts. Further measurements of artificial radiations proved that the heat maximum shifts to shorter wavelengths with increasing temperature. Beyond that,
Figure 2.1: (Top) Ebonite cylinder with several diaphragms and Langley’s bolometer (metallic strips) ; (Bottom) Wheatstone bridge which is used to measure the variations of the electrical reference M, exposed to light, with respect to reference resistances (Langley, 1881).
Langley extended the scientific observations of the Sun to the infrared region and therefore paved the way to a new research field of astronomy.
2.1.2 General description of bolometers
In this subsection, we describe the overall functioning of a contemporary bolometer. The working principle of these detectors is similar to the one used for Langley’s device : the bolometer measures the conversion of radiation to heat, it is a power detector. However, in Langley’s experiments the absorber and thermometer were basically the same element while the functions are nowadays decoupled even if the temperature is supposed to be homogeneous in the system. This has the clear advantage to enable the optimization of both elements at the same time.
The bolometer can be basically described by three components : the absorber, the thermal sensor and the heat sink shown in figure 2.2. When a photon hits the absorber, its energy is converted into heat. The thermometer measures the changes in temperature through the changes in its resistance. Note that the critical part (i.e. absorber and thermometer) is thermally isolated from the rest of the bolometer and that finally, the energy is offloaded to the heat sink.
Figure 2.2: Description of the different parts that form a bolometer. The incoming wave gets absorbed and converted into heat by the absorber. Then the thermometer measures the temperature rise of the absorber. Note that the central part is suspended and thus thermally isolated. A weak link enables the thermometer to offload the heat to the heat sink. The thermal conductance Gthis a parameter to optimize since it accounts for the sensitivity and for the speed
of the whole bolometer (adapted from Billot (2007)).
Parameters to optimize
Depending on the application, several parameters can be optimized :
- The absorption of the radiation is a key parameter as it determines how much of the incident light is converted into heat for detection. The optimization of the absorption of the bolometer is the central concern of this thesis and will be largely investigated throughout the manuscript.
- The heat capacity Cth for a thermally isolated object is by definition the ratio of the absorbed
energy dE to the temperature rise dT : Cth = dE/dT . To have very sensitive bolometers, we need
absorbers and thermometers to react strongly (in terms of temperature rise) to a small amount of energy. Therefore the heat capacity of the system must be minimized. One way for reducing the heat capacity of the absorber is to reduce its mass m since the heat capacity Cth is proportional to m
through the equation : Cth = m.s, where s is the specific heat capacity of the material used. Another
way to minimize the heat capacity is to work at very low temperature : as suggested by Simon (1935), the sensitivity of the bolometer could be improved by many orders of magnitude when working at low temperature. Indeed, the specific heat capacity s depends, in theory, on the temperature as T3 for