O
pen
A
rchive
T
OULOUSE
A
rchive
O
uverte (
OATAO
)
OATAO is an open access repository that collects the work of Toulouse researchers and
makes it freely available over the web where possible.
This is an author-deposited version published in :
http://oatao.univ-toulouse.fr/
Eprints ID : 12414
The contribution was presented at IWCMC 2013 :
http://iwcmc.org/2013/
Official URL:
http://dx.doi.org/10.1109/IWCMC.2013.6583695
To cite this version :
Houaidia, Chiraz and Van den Bossche, Adrien and Idoudi,
Hanen and Val, Thierry and Azzouz Saidane, Leila Experimental Performance
Analysis of Routing Metrics in Wireless Mesh Networks. (2013) In: 9th International
Wireless Communications and Mobile Computing Conference (IWCMC 2013)
Workshop on Multihop Wireless Network Testbeds and Experiments, 1 July 2013 -
5 July 2013 (Cagliari, Sardinia, Italy).
Any correspondance concerning this service should be sent to the repository
administrator:
[email protected]
Experimental Performance Analysis of Routing
Metrics in Wireless Mesh Networks
Chiraz Houaidia∗§1, Adrien Van Den Bossche§2, Hanen Idoudi∗3, Thierry Val§4, Leila Azouz Saidane∗5 ∗Ecole Nationale des Sciences de l’Informatique (ENSI),
University of Manouba
Campus Universitaire de la Manouba, Tunisia
1[email protected], {3hanen.idoudi, 5leila.saidane}@ensi.rnu.tn
§CNRS-IRIT-IRT, University of Toulouse, UT2,
1 pl. G. Brassens, BP 60073, 31703 Blagnac Cedex, France
1[email protected],{4val,2bossche}@irit.fr
Abstract—This paper provides a description of a wireless mesh network testbed setup and a measurement-based performance evaluation of the Optimized Link State Routing (OLSR) protocol [7] under three different routing metrics. The considered metrics include hop-count, ETX and ETT. The network performances are evaluated in an indoor testbed formed by heterogeneous MIMO devices. A part of our tests was about the impact of 802.11n features on the network performances showing the importance of lower layers consideration. Our measurements point out the shortcoming of each metric and eventual optimizations towards a more efficient routing. Experimental results show that OLSR-ETT outperforms OLSR-ETX and OLSR-hopcount significantly in terms of packet loss, end-to-end delay, and efficiency.
Index Terms—Wireless mesh network, Routing, OLSR, Metric, Testbed, Performance.
I. INTRODUCTION
In rural areas, where broadband infrastructure is not avail-able, Wireless Mesh Networks (WMNs) may be a potential solution to provide these regions with a reliable Internet access based on multihop connections. The use of stationary wireless routers (backbone) to interconnect isolated LANs, may provide backhaul access to users in a flexible and dynamic manner. These backbone nodes usually do not have strict constraints on power consumption, so, mobility and power savings are no longer the main problems in WMNs. In ad hoc networks, the most used routing metric is hop count, which is convenient for ad hoc networks because frequent link breakages result from the mobility of users. For mesh networks, however, the focus tends towards a new paradigm called quality-aware routing. Indeed, wireless mesh routing is optimized to consider link quality metrics such as transmission capacity, loss probability, interferences ...
An efficient path selection must be done while optimiz-ing network resources and satisfyoptimiz-ing users QoS require-ments. However, with an unstable radio environment, a shared medium and a varying link capacities limited by interference, routing performance issues in a WMN are increasingly chal-lenging. Packet losses, throughput degradation, congestioned links, etc., are among several problems identified in WMNs
and issued generally from lower layers. Routing metrics, then, that reflect link quality variations are increasingly needed. Sev-eral link-quality routing metrics have been proposed and eval-uated by simulations, but only a few have been implemented and evaluated in real networks [1][2]. Experimental evaluation of new metrics is, generally, a matter of implementation. It requires the consideration and the adaptation with, on the one hand, the physical characteristics of the testbed and on the other hand, the routing protocol evolved to, which is feasible but although not straightforward.
Among implemented mesh routing metrics, we are inter-ested to ETX [3] and ETT [4]. The focus of this paper is to add the ETT metric to an implementation of the OLSR (Optimized Link State Routing) protocol in order to carry out a comparative study of the behavior of this protocol under different metrics. One of the most-known implementations of OLSR is OLSRd program (OLSR daemon) [13] which imple-ments basically hop count and ETX as metric. The purpose of this paper is to setup and configure a real IEEE 802.11n [8] based WMN testbed and to evaluate, in a comparative way, the OLSR performances. We studied the impact of PHY/MAC components using simulation in a previous work [10]. This paper is part of a scientific approach which intends to con-tribute to innovative points such as mesh routing metrics and strategies but the feasibility and performance study will also be made on the testbed that we are presenting in this paper. This work is carried out as a part of the project tetaneutral.net [15]. It was then agreed to make the comparative study on our testbed and then further contributions and experiments will be tested in the real network tetaneutral.net.
The remainder of this paper is organized as follows: Section II presents a brief description of the two routing metrics used in this work. Our experimental results are shown in Section III. Section IV presents a general discussion of the results obtained and the shortcoming of each metric.
II. ROUTINGMETRICS
In ad hoc networks, where mobility and power saving are the main problems, the most convenient metric is hop count.
This metric, coupled with a routing strategy, allows a fast recovery of instable routes due to link breakage. On the other hand, as mesh routers are, most of the time, stationary, wireless mesh routing protocols are optimized to consider link quality metrics. New metrics, such as ETX, ETT, WCETT, MIC, etc. [9], are proposed towards a quality-aware routing, in order to reflect more the link variations such as transmission capacity, loss probability, interferences, etc. In our experiments, we intend to evaluate and compare the performances of OLSR under two routing metrics aware of the link quality which are ETX [3] and ETT [4].
A. ETX
The Expected Transmission Count (ETX) metric is a pro-posal to better suit wireless networks where link fluctuations and packet losses are inevitable. It represents the number of times a node expects to transmit and retransmit a packet for a successfull delivery. So, ETX aims essentially to find the route with the highest probability of packet delivery. The ETX metric considers the asymetric property of wireless links and is computed as follows :
ET X = 1/(df× dr) (1)
Wheredfanddr are respectively the forward and the reverse
delivery ratios of the link.
To estimatedf anddr, nodes broadcast small-size probes at
an average periodτ during a time window ω so that each node knows how much probes it should receive during this period which is τ /ω. The probe contains the number of received probes for each neighbor during the lastω. So, each receiving node becomes aware of the forward delivery ratio for each link. This information is then broadcasted to make all neighbors aware of the ETX of the link. The best link quality is the link with the smallest ETX i.e with the smallest loss probability. The ETX of a route is the sum of the link metrics.
B. ETT
As described here before, ETX assumes that all links have the same bandwidth capacity, which is a very simplified hypothesis due to the great diversity of PHYs in modern communication technologies such as IEEE 802.11n. The ETT routing metric, proposed by Draves et al. [4], improves ETX by considering the differences in link transmission rates. The ETT of a link is defined as the expected MAC layer duration for a successful transmission of a packet. It is expressed as follows :
ET T = ET X × S/B (2) Where S is the probe-packet size and B measures the transmission rate of the link. The ETT of a path p is simply the summation of the ETTs of the links on the path.
Through the following performance experiments, we aim to highlight the effeciency and flaws of each metric within a high throughput environement based on IEEE 802.11n standard.
III. EXPERIMENTALSTUDY
A. Configuration and Testbed Setup
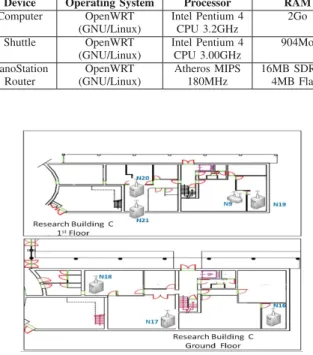
To carry out performance evaluation and comparison, we run experiments in an indoor testbed BlueMeLab [11]. Our testbed is deployed at the University Institute of Technology (IUT) Blagnac-Toulouse. It is formed by seven nodes: four shuttles, two personal computers and one Ubiquiti Networks Nanostation Loco router. Device configurations are shown in Table I. All nodes are IEEE 802.11n compliant, with a 2x2 MIMO radio devices running with the ath9k driver [12] and are using OpenWRT operating system [13]. This driver provides enough features for our implementation as well as for future improvements. Console of each node is accessible via an Ethernet link, so as not to cause additional traffic control on the radio during tests or performance assessments. All nodes are configured to use the channel 9 with a 40MHz width spectrum. The adhoc mode is enabled and the PHY rate is automatically set : each node computes the best PHY rate for every neighbor. The OLSR routing protocol is implemented natively in the OpenWRT operating system as an OLSR deamon (olsrd) [14]. This implementation is improved to offer both the use of the Hop Count and the ETX metrics.
The nodes are spread over two floors of the building (cf. Figure 1). Rooms are separated by thick bricked walls. It is worthy mentioning that there are other wireless networks in the area. The choice, then, of the channel was made essentially in order to avoid interferences with existant networks and garantee a certain accuracy of our results.
TABLE I: CONFIGURATION OF DEVICES USED ON THE TESTBED
Device Operating System Processor RAM Computer OpenWRT Intel Pentium 4 2Go
(GNU/Linux) CPU 3.2GHz
Shuttle OpenWRT Intel Pentium 4 904Mo (GNU/Linux) CPU 3.00GHz
NanoStation OpenWRT Atheros MIPS 16MB SDRAM Router (GNU/Linux) 180MHz 4MB Flash
As mentioned above, olsrd implements natively the hop count and the ETX metrics. To measure ETX, olsrd, instead of creating new probe messages, uses HELLO and TC mes-sages of OLSR which are sent periodically each 2s and 5s respectively. This method aims to avoid extra overhead. We have made some improvements in order to measure the ETT metric.
A multitude of monitoring tools were offered by the ath9k driver and used in our experiments. The iperf tool was used to generate TCP and UDP traffic at different rates between pairs of nodes and measure bandwidth, jitter, packet loss, etc. As usual UDP traffics are CBR (bandwidth is a parameter of the traffic generator) while TCP traffics try to use the whole capacity of the link. Tcpdump and Wireshark tools were used to dump the traffic in the network and give a description of the contents of packets. Iw configuration utility was used to get device capabilities and set parameters and statistics.
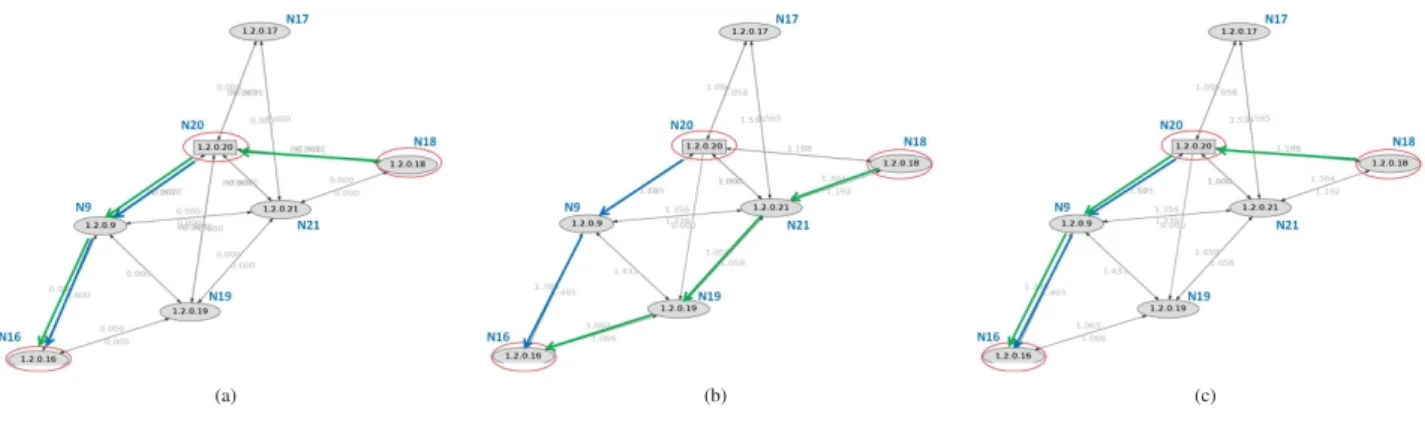
We choose two representative pairs of nodes to carry out our performance tests. Nodes are numbered as show in the figure 1. First pair includes the node N18 and the node N16. Second pair includes N20 and N16. These pairs were selected so as to have different routes with different caracteristics (distance between nodes, number of hops, link quality, etc.). The routes selected for each routing metric are shown in the figure 3. This figure can be viewed here [16] with a better visibility.
Prior to performing the experiments, we carried out some preliminary tests in order to validate some properties relative to our experimental environement such as frame aggregation feature and evaluate its impact on the network performances. First, in order to underscore the importance of such a feature, we have enabled and disabled aggregation at two nodes (N19 and N21) and measured the resulted throughput and packet loss. Results are shown in the table II. The aggregation mechanism, in general, consists of combining multiple data packets from the upper layer into one larger aggregated data frame for transmission. Thus, generated overhead is reduced since the header overhead and inter-frame time is saved. This is prouved by the results below which indicate a significant gain in packet delivery, throughput and jitter.
TABLE II: IMPACT OF AGGREGATION
Aggregation Enabled Aggregation Disabled Data Transfered 3.49 MBytes 290 KBytes
Throughput 33.5 Mbits/sec 5.10 Mbits/sec
Jitter 1.067 ms 8.420 ms
Packet Loss 27 % 94 %
In another testflow, attemps were made to verify the capabil-ity of a node to manage simultaneously two queues for sent and received packets respectively and the expected induced packet loss. Figure 2 shows the packet loss while varying, on the one hand, the transmission rate and, on the other hand, the packet size. The packet loss engendered grows considerably when the intermediate node is receiving or sending a large amount of traffic. This test allows us to estimate and justify the amount of lost packets by the high exposure of the node to
neighbors traffic, ie. when the node is sollicited by important traffics or even several control messages.
Fig. 2: Behavior of a node when sending and receiving simultaneously.
B. Performance Measurement And Analysis
We compare the performance of hop count, ETX and ETT metrics implemented in OLSR.
1) Route Selection: First attemps were to study the
be-havior of OLSR while varying the routing metric: how did OLSR select the routes? How does this choice impact the load distribution over all the links in the network? Figure 3 displays the routes selected for each metric. To reach the node
N16 from the node N20, the best route is the same for all metrics which is the 2-hop route including N20, N9 and N16. However, from the node N18, the path selection differs. Based on hop count metric, OLSR selects just the first route with minimum hops. Based on ETX, the choice is made according to the quality of all links of the route : the path
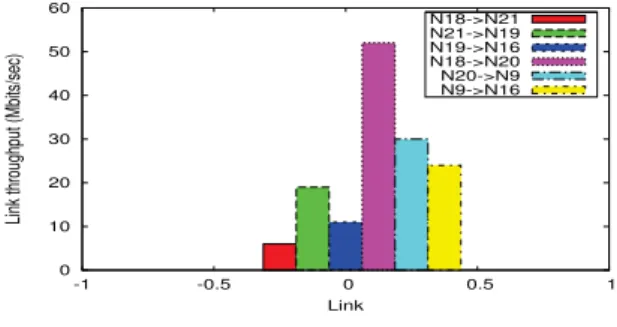
N18-N21-N19-N16offers the smallest ETX and then the best quality. Based on ETT, OLSR considers, in addition to the link quality, the link bandwidth which differs from one link to another in our experiments. As shown in the figure 4, the route
N18-N20-N9-N16includes links with the highest throughput, so route links chosen by ETT metric have better quality and send packets using higher physical rates which explains the better route selection in that case.
In terms of route length, OLSR selects always a 3-hop path, then, all metrics have the same number of medium accesses. The difference lies essentially on the distribution of the traffic load on the network.
0 10 20 30 40 50 60 -1 -0.5 0 0.5 1
Link throughput (Mbits/sec)
Link N18->N21 N21->N19 N19->N16 N18->N20 N20->N9 N9->N16
(a) (b) (c)
Fig. 3: Route Selected; (a) Hop Count (b) ETX (c) ETT.
2) Link Load: To reach the node N16, according to our
topology, there is two principal gateways which are N9 and
N19. For farther nodes, packets should transit by N20 or N21. So, the manner how OLSR manages the traffic between these four gateways can be an important comparison criteria. Figure 5 presents how many times a link is used while considering the different routes computed by each node As depicted in that figure, with the hop count metric there is no strategy for load balancing between the different links in the network. For that reason, we find that some links are overloaded compared to some others which are never used. Based on ETX metric, traffic is equally distributed between the four gateways mentionned before and routes are used at the same rate by all the nodes in the network. Based on ETT metric, a better distribution is made in so far as, first, all the available links are used and second, the trade-off between the traffic supported and the throughput offered by a link remains reasonable. In fact, the link (N9,N16), as mentionned in the figure 4, presents a higher bandwidth compared to the link (N19,N16). As the ETT metric takes into account the link bandwidth, it follows that this link is prefered from others.
0 1 2 3 4 5 HC ETX ETT Link Load Metric (N9,N16) (N19,N16) (N20,N9) (N21,N19) (N21,N9)
Fig. 5: Link Load.
3) Packet Loss: In the first flow of experiments, we
gener-ate an UDP traffic between the different pairs while varying the transmission rate and we pick up the average packet loss of 10 series of tests. Figure 6 (a) plots the average packet loss rate for each metric experienced by node N20 when pinging node N16. For all metrics, as the transmission rate increases, the packet loss rate also increases. In fact, the more the link is overloaded by heavy traffic, the more is the risk of loss because of congestion or timeout in queues, particularly at the gateway
N9which is the only used with all metrics. We remind that for that pair of nodes, the route is the same with all metrics: which explains the fact that the pattern is approximatively the same especially for ETX and ETT metrics. Using hop count metric, however, the increase of packet loss rate is considerably higher at important transmission rates. This packet loss is measured essentially at the link (N9,N16) which is overloaded and very exposed to a major part of neighbor traffics (cf. Figure 5).
Results in figure 6(b) show the packet loss rate measured between nodes N18 and N16. Based on the hop count metric and the ETT metric respectively, the route is the same (cf. Figure 3) which explains the pattern similarity at some rates. The ETT metric has the lowest packet loss rate because this metric is designed to select the best route according to the current link quality, and reproduces physical conditions better than ETX and hop count. With high transmission rates, the performance of ETX is the worst because packets are transited over links having the worst throughputs as shown in Figure 4. So, the packet delivery is affected by traffic load and congested links. Note that the communication between nodes N18 and
N16shows a higher loss rate than the communication between
N20and N16 . This behavior occurs because the path between these nodes has more obstacles and uses more hops (cf. Figure 3). Consequently, the difference in performance among the three metrics is larger.
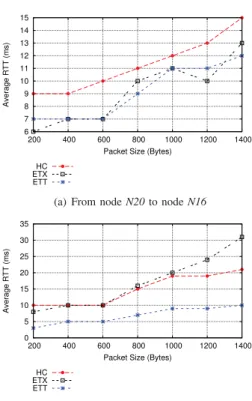
4) Average Round Trip Time (RTT): Each experiment
con-sists of transmitting 100 pings between each pair of nodes and is repeated 10 times. We measured, then, the average RTT while increasing the packet size. Results are plotted in
0 10 20 30 40 50 60 1 2 3 4 5 6 7 8 9 10 Packet Loss (%)
Transmission Rate (Mbits/sec) HC
ETX ETT
(a) From node N20 to node N16
0 10 20 30 40 50 60 70 80 90 1 2 3 4 5 6 7 8 9 10 Packet Loss (%)
Transmission Rate (Mbits/sec) HC
ETX ETT
(b) From node N18 to node N16
Fig. 6: Packet Loss Rate.
the Figure 7. Similarly to the packet loss rate, the round trip time produced with the ETT metric is the lowest among the three metrics at all scenarios. This better performance is expected as the ETT metric is, indeed, designed to estimate the transmission and retransmission times. The average RTT is clearly greater for the communication between nodes N18 and N16 when compared with the pair N20 and N16 which is due to the longer routes in terms of hops.
IV. DISCUSSION
According to the results of our experiments, the hop count metric considers only the least number of hops and assumes identical link characteristics accross the entire network. It doesnt consider the trade-off between distance (loss) and hops. The route selection, then, is relatively stable as it is not aware of link quality variation. Then, in some topologies such ours, several nodes may choose the same route and neglect others which could offer a better capacity or quality. This may result generally on overloaded links and forming a bottelneck which leads to the performance degradation across the entire network. With ETX metric, the link quality estimation is based on small probe size (some bytes) which doesn’t properly reflect the data loss probability. In fact, such measurement under-estimates data loss ratios and over-under-estimates ACK loss ratios. In real scenarios, such our experiments, we clearly note the important packet loss rate and delay made by ETX while increasing the traffic load or the packet size. Figure 6(b) and Figure 7(b) show that ETX metric achieves the worst performances. Moreover, ETX assumes all links run at one
6 7 8 9 10 11 12 13 14 15 200 400 600 800 1000 1200 1400 Average RTT (ms)
Packet Size (Bytes) HC
ETX ETT
(a) From node N20 to node N16
0 5 10 15 20 25 30 35 200 400 600 800 1000 1200 1400 Average RTT (ms)
Packet Size (Bytes) HC
ETX ETT
(b) From node N18 to node N16
Fig. 7: Average Round Trip Time.
bit-rate and probes are sent in broadcast at the network basic physical rate. So, this metric assumes a robust physical layer which is not the case at all. When links data rates are not accounted for, a short path with lower ETX may be chosen over another longer path with higher ETX albeit the latter may be able to support a higher overall throughput and less end-to-end delay.
To cope with these problems, ETT metric, by accounting for both the link capacity and quality, offers a better estimation and ensures both reliability and efficiency. According to the experimental results (cf. Figure 6,7), ETT achieves the best performances among other metrics. However , from a practical point of view, an accurate design of ETT may be more complex compared to ETX. In fact, several methods were proposed to compute the transmission rate of each link [4][5]. The packet pair technique proposed by Draves and al.[4] is the most used. But, this method is based on unicast probes which may lead generally on additional overhead. For example, in a n-node network, where each node has v neighbors, the number of probes sent using ETT is O(nv) whereas using ETX it is O(n).
On the other hand, given a link with a high capacity does not mean that its total bandwidth is available for use. Based on figure 3(c), the node N18 has to choose between 2 links : (N18, N20) and (N18, N21) respectively towards neighbors N20 and N21. The first link has a total capacity of 52 Mbits/sec, the second one offers only 6.5 Mbits/sec. Based on ETT computation, the node N18 choose the link
(N18, N20) because it offers, theoretically, more bandwidth. However, practically, this link (N18, N20) may be already in use by a heavy or regular traffic which does not reflect properly delays and loss probability generated by congestion. In that case, the link (N18, N21) may be more appropriate and efficient to use. Hence, one should check first the link availability or the residual bandwidth, if already in use, in order to make sure if this link can support the amount of data to transmit or not and how good it is.
V. CONCLUSIONANDFUTUREWORK
This paper describes the setup of an IEEE 802.11n based wireless mesh network testbed formed by MIMO nodes. Nodes are equipped with new technologies and features allowing us to validate our results on an advanced environment.
This paper provides a measurement-based performance eval-uation of the OLSR protocol. Three versions of OLSR are configured and evaluated in order to get a comparative study of the most known routing metrics: Hop Count, ETX and ETT in a wireless mesh testbed. Our measurements show that OLSR-ETT outperforms OLSR-ETX and OLSR-hopcount in terms of packet loss, delay and load balancing. Results obtained are related to the considered topology, further study of other topologies is needed to validate this conclusion. Although, our results remain coherent with other works [2][6].
At the best of our knowledge, we are the first to study these routing metrics in a MIMO and 802.11n based mesh network. By taking into account the PHY/MAC diversity of nodes, we focused on the shortcomings of these metrics to adapt a heterogeneous environment.
As a future work, we intend to propose and implement a new routing metric where we tend to be aware of the link quality based on the PHY/MAC characteristics such as link availability, residual bandwidth, etc.. The learning of these low-layer parameters will be subject of a cross-layer mech-anism and will be included in an adaptive routing protocol. Further contributions will be validated by simulation and prototyped then in a real mesh network deployed in Toulouse city which offers a more realistic environment, traffic and wireless contraints. It allows us also to check the scalability of our proposal when deployed in a large scale network. This work is a prior part of the proposal presented in section IV.
ACKNOWLEDGMENT
This work is carried out as a part of the project tetaneu-tral.net. Further contributions will be tested in the real network. Authors would like to thank the project’s manager support: Laurent Guerby.
REFERENCES
[1] M. E. M. Campista, D. G. Passos, P. M. Esposito, I. M. Moraes, C. V. N de Albuquerque, D. C. M. Saade, M. G. Rubinstein, L. H. M. K. Costa and O. C. M. B. Duarte. ”Routing metrics and protocols for wireless
mesh networks”IEEE Network, vol. 22, no. 1, pp. 6-12, Jan.-Feb. 2008. [2] P. M. Esposito, M. E. M. Campista. , I. M. Moraes, L. H. M. K. Costa, O. C. M. B. Duarte, M. G. Rubinstein. ”Implementing the Expected
Transmission Time Metric for OLSR Wireless Mesh Networks”. IFIP Wireless Days, Dubai, Nov. 2008, pp. 1-5.
[3] D. S. J. D. Couto, D. Aguayo, J. Bicket, and R. Morris. ”A
high-throughput path metric for multi-hop wireless routing”. ACM MobiCom, California, Sept. 2003, pp. 134-146.
[4] R. Draves, J. Padhye, and B. Zill. ”Routing in multi-radio, multi-hop
wireless mesh networks”. ACM MobiCom, Philadelphia, Sept. 2004, pp. 114-128.
[5] D. Aguayo, J. Bicket, and R. Morris. ”SrcRR: A high throughput routing
protocol for 802.11 mesh networks (DRAFT)”. MIT, Tech. Rep., 2005. [6] H. Sinky and B. Hamdaoui. ”Implementation and performance
measure-ment and analysis of OLSR protocol”. International Wireless Communi-cations and Mobile Computing Conference (IWCMC), New York, Jul. 2010. pp. 286-290.
[7] T. Clausen and P. Jacquet. ”Optimized Link State Routing Protocol
(OLSR)”. Internet Request For Comments RFC 3626, Internet Engineer-ing Task Force, Oct. 2003.
[8] C. Wang and H. YuWei. ”IEEE 802.11n MAC Enhancement and
Per-formance Evaluation”. Mobile Networks and Applications, vol. 14, no. 6,Dec. 2009, pp. 760-771.
[9] S. Ghannay, S.M. Gammar, F. Filali, F. Kamoun. ”Multi-radio
multi-channel routing metrics in IEEE 802.11s-based wireless mesh networks - And the winner is ”. Communications and Networking (ComNet), Hammamet, Nov. 2009, pp.1-8.
[10] C. Houaidia, H. Idoudi, A. Van Den Bossche, T. Val, L. Saidane. ”Impact
of IEEE 802.11 PHY/MAC Strategies on Routing Performance in Wireless Mesh Networks”. FINA International Symposium in conjunction with AINA, Barcelona, Mar. 2013.
[11] http://lab.iut-blagnac.fr/bluemelab. Last access: November, 2012. [12] http://linuxwireless.org/en/users/Drivers/ath9k. Last access: November,
2012.
[13] https://openwrt.org/. Last access: November, 2012. [14] http://www.olsr.org. Last access: November, 2012. [15] http://tetaneutral.net/. Last access: November, 2012.
[16] http://lab.iut-blagnac.fr/bluemelab/topology.png. Last access: November, 2012.