Gilles TOUSSAINT
a*, Miguel Angel RODRIGUEZ
b, Rudi CLOOTS
c, Juan RUBIO
d, Fausto RUBIO
e,
Bénédicte VERTRUYEN
f, Catherine HENRIST
g.
a* GREENMAT, Department of Chemistry, B6a, University of Liege, Sart Tilman, B-4000 Liège, Fax: +3243664747, Tel: +3243663438, E-mail:
gilles.toussaint@ulg.ac.be
b Instituto de Cerámica y Vidrio, CSIC, C/ Kelsen, 5, 28049 Madrid, Spain, Fax: +34917355843, Tel: +34917355840, E-mail: mar@icv.csic.es c GREENMAT, Department of Chemistry, B6a, University of Liege, Sart Tilman, B-4000 Liège, Fax: +3243664747, Tel: +3243663438,
rcloots@ulg.ac.be
d
Instituto de Cerámica y Vidrio, CSIC, C/ Kelsen, 5, 28049 Madrid, Spain, Fax: +34917355843, Tel: +34917355840, E-mail: jrubio@icv.csic.es
e Instituto de Cerámica y Vidrio, CSIC, C/ Kelsen, 5, 28049 Madrid, Spain, Fax: +34917355843, Tel: +34917355840, E-mail: frubio@icv.csic.es f GREENMAT, Department of Chemistry, B6a, University of Liege, Sart Tilman, B-4000 Liège, Fax: +3243664747, Tel: +3243663438,
b.vertruyen@ulg.ac.be
g
GREENMAT, Department of Chemistry, B6a, University of Liege, Sart Tilman, B-4000 Liège, Fax: +3243664747, Tel: +3243663438, catherine.henrist@ulg.ac.be
Abstract
Synthetic lamellar silica and hybrid lamellar silicas have been prepared by liquid crystal templating, template extraction and silanization. The samples have been characterized by thermogravimetric analysis (TGA), carbon analysis, spectroscopy, X-Ray diffraction (XRD) and nitrogen adsorption. The XRD analyses have shown that the lamellar periodic stacking is preserved for all samples. The quantity and type of organic molecules at the silica surface have been evaluated by carbon analysis, TGA and spectroscopy. The covalent grafting of the solvent used for extraction of the initial surfactant has been highlighted by these analyses. The nitrogen adsorption analyses have revealed three categories of pores and two types of samples. The initial lamellar silica exhibits a very low specific surface area and plate-like type of pores. The second type of samples is made up of the hybrid samples and the initial substrate from whom the surfactant has been extracted. These samples show a significantly higher specific surface area with interlamellar spaces corresponding to narrow slit -like mesopores around 4 nm. The nitrogen adsorption data analysis has highlighted the presence of micropores within the silica sheets. The difference of specific surface is due to pore blocking by the surfactant impeding the access to nitrogen into interlamellar spaces and by the silanes covering the pores once the surface modified. The presence of micro and mesopores combined to a high BET specific surface of 612 m²/g make these lamellar silicas interesting materials for catalysis applications.
Keywords: hybrid, silica, lamellar, adsorption, porosity.
Abreviations: TEOS : Tetraethoxysilane, XRD: X-Ray diffraction, GPTMS: glycidoxypropyltrimethoxysilane, PEOTMS:
2-[methoxy(polyethyleneoxy)propyl)]trimethoxysilane, NMR: Nuclear Magnetic Resonance, TGA: Thermogravimetric analysis, DSC: Differential Scanning Calorimetry
1. Introduction
Since the synthesis of first mesoporous molecular sieves by the scientist from Mobil Oil Research and Development [1], the synthesis of inorganic - organic hybrid materials with ordered nanostructure has attracted a lot of attention amongst material science and technology. These materials show indeed a strong potential for use as nanofillers and catalysts [2, 3]. Pores can be classified in three categories according to their size: micropores smaller than 2 nm, mesopores between 2 and 50 nm and macropores larger than 50 nm [4]. Since molecule adsorption is related to the pore size in heterogeneous catalysis, a lot of efforts have been made in the development of mesoporous solids as these can host larger molecules than the conventional microporous zeolites [1]. The presence of mesopores combined to micropores can also allow faster diffusion into micropores. In gas oil cracking activity, the presence of mesoporous region in microporous zeolites shows an increase in the catalysis performance [5]. Some layered lamellar materials, like natural clays, are interesting materials because they have pores in the high limits of microporosity together with mesopores formed by the arrangement of the layers. Such materials can have many applications in acid or redox catalysis [6-10]. Thanks to their surface silanols, it has also been shown that silica -based material can be converted into interesting catalysts used for ethylene polymerization [11]. We have shown in our previous study that liquid crystal templating can be used together with silanization to synthesize different organized lamellar hybrid silicas with interlayer distance in the order of 2 – 4 nm [12]. As layered material from which surface can be easily modified by reaction with their surface silanols, these layered silica can be of great interest in catalysis. The lamellar morphology, the platelet stacking organiza tion, the type and quantity of organic molecules between silica sheets and the type of bonding of these molecules has been already discussed for the different lamellar hybrid silica we synthesized [12]. In this article, nitrogen adsorption-desorption measurements
have been performed on those lamellar silicas in order to investigate surface and pore structure. The results are discussed a nd analysed following different models in order to determine the specific surface area, the pore size and the microporous and mesoporous properties of the materials.
2. Experimental
2.1. SynthesisThe lamellar silica substrate is obtained by liquid crystal templating in acidic solution according to the procedure and conditions previously described [13]. A mixture of dimethyldialkylammonium chloride (Arquad 2HT-75, from Akzonobel) is softly melted and then added under vigorous stirring to an HCl solution of concen tration 1.8 mol/l at 50°C. The mixture is allowed to equilibrate at 50°C during one hour in order to reach a complete organization of the template molec ules into an ordered lamellar mesophase. The precursor of the silica, tetraethylorthosilicate, is then added under stirring to the previous mixture. The Si:Surfactant ratio was adjusted to 8,9. The mixture is left to react at 50°C for 24 h. A solid phase is formed and preserves the symmetry of the surfactant mesophase used as template. The solid is filtered off, washed with de-ionised water and air-dried. In this study, the reactant mixture was prepared from 5,8 g of surfactant. This sample is further refer red to as ―As-Synth‖ silica. The modification of the As-Synth silica surface is achieved by silanization grafting-onto method. Isopropanol has been chosen as solvent for silanization to allow the extraction of the surfactant during the functionalization. T he procedure and conditions were adapted from our previous study [12]. In the present study, we have worked with one gram of As-Synth silica and 100 mL of isopropanol. We have used 90 and 21 mmol of silane glycidoxypropyltrimethoxysilane (further referred to as ―GPTMS‖) and 2-[methoxy(polyethyleneoxy)propyl)]trimethoxysilane (further referred to as ‖PEOTMS‖) respectively to prepare the silanized lamellar silicas that are further referred to as ―GPM‖ and ―PEO‖. The lamellar silica sample without surfactant is prepared by refluxing 1g of the As-Synth silica during 24h in 100 mL of isopropanol. This silica is further referred to as ―Surf-Free‖.
2.2. Characterizations
The X-ray diffraction analyses were performed in a Siemens 5000 diffractometer working with Cu Kα radiation and Ni filter. Uncertainties for the thickness of the tactoids calculated from Scherrer equation have been arbitrary rounded to 10 % of the thickness value. TGA and DSC were carried out in a Netzsch STA449C thermobalance. Around 15 mg of the sample were placed in a platinum crucible and heated at a rate of 10 °C/min up to 800 °C in a dynamic air atmosphere. Several measurements have been made for every sample to ensure the reproducibility of the analysis. Carbon analyses were performed with a LECO CS-200 Carbon and Sulfur Analyzer. Samples were grinded in a mortar and two to three analyses were carried out by sample to ensure the reproducibility of the results. Uncertainties in Table 1 have been calculated in the following way. For a variable U function of three other variables (x,y,z), the uncertainties ΔU can be calculated using the following equation :
2 2 2
z
z
U
y
y
U
x
x
U
U
withx
U
the derivative of U in respect to x and Δx the uncertainties on x. We have applied this general formula to calculate the uncertainties taking into account the uncertainty on the volume of silane added with a syringe ΔV, the uncertainty on the molecular weight of the silane PEOTMS (the number of ethyleneoxide units of this silane is comprised between 6 and 9 units, indicated by ABCR) and the uncertainty on the evaluation of the weight loss by TGA after silanization. The latter was arbitrary rounded off to 0.5 wt %. Nitrogen adsorption-desorption isotherms were analysed with a Tri-Star 3000 (Micromeritics Co.) in the whole partial pressure range at 77K. Samples were degassed at 120 °C during 20 hours before analysis. Uncertainties on the BET surface areas where estimated by the Tristar Software of the equipment. As similar values of specific surface are determined by the others methods, the BET uncertainties were taken as references for the uncertainties on specific surface determined with the other models. The 13C cross-polarization (CP) magic-angle spinning (MAS) and the 29Si MAS spectra were recorded with 4 mm zirconia rotors spinning at 7kHz on a Bruker Avance DSX 400WB spectrometer (B0 = 9.04 T) working at Larmor frequencies of 100.6 MHz and 79.5
MHz respectively. The 13C and 29Si chemical shifts were referenced relative to the peaks of TMS. The 13CP NMR spectra were recorded under high-power proton decoupling (83 kHz) with a recycle delay time of 4 s and a contact time of 2 ms. Quantitative
29
Si MAS-NMR spectra were obtained by performing one-pulse experiments with a 90 pulse of 5.5 s. Quantitativity was checked by varying the recycle delay time and an optimal value was found at 480 s. Typically, 500 transients were used for NMR analyses. Infrared spectra were taken for 1 mg of the sample dispersed and pressed in a pellet with 200 mg of KBr. Analyses were performed with a Perkin Elmer Spectrum One apparatus.
3. Results
3.1. Reaction scheme.The samples are prepared by liquid crystal templating and silanization, as illustrated on Fig.1. The As-Synth silica substrate obtained is made-up of dialkyldimethylammonium chloride molecules arranged in double layer between the silica sheets. The surfactant molecules are linked as ions pair (R4N+Cl-) to the surface silanols by hydrogen bonding. When the sample is silanized
with GPTMS or PEOTMS silane, the surfactant is easily extracted and the silanes get covalentl y bonded to the surface silanols. When no silane is used and the As-Synth silica is refluxed in isopropanol, the surfactant gets simply extracted.
3.2. TGA DSC and carbon analyses
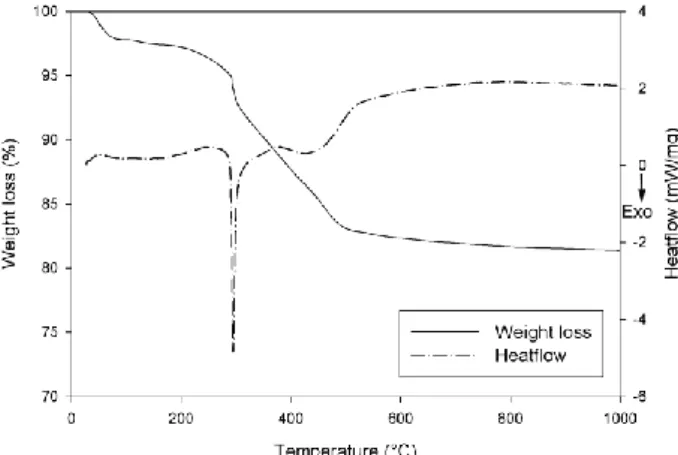
The TGA-DSC curves of the As-Synth, GPM and PEO hybrid silica are similar to the ones presented in our previous article. The TGA-DSC curve of the Surf-Free sample is shown on the Fig. 2. Like the silanized samples GPM and PEO, the Surf Free sample exhibits a sharp exothermic peak related to a weight loss above 200°C, characteristic of the combustion of an organic molecule.
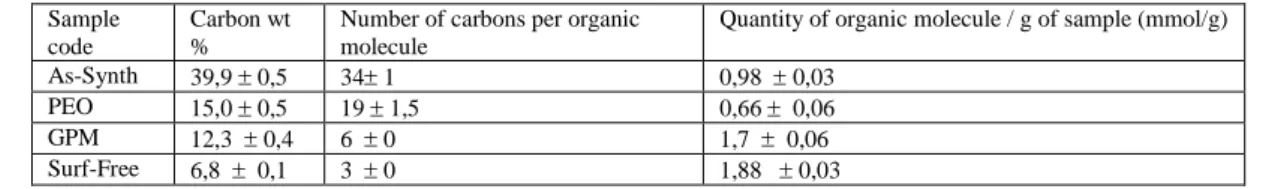
The quantity of organic molecules Qorg of each sample is determined by means of the Equation 1 and elementary carbon
analyses. The results are shown in Table 1.
Equation 1
Table 1. Determination of the quantity of organic content in the silica samples, determined by elementary analysis and by means of Equation 1. Sample
code
Carbon wt %
Number of carbons per organic molecule
Quantity of organic molecule / g of sample (mmol/g)
As-Synth 39,9 0,5 34 1 0,98 0,03
PEO 15,0 0,5 19 1,5 0,66 0,06
GPM 12,3 0,4 6 0 1,7 0,06
Surf-Free 6,8 0,1 3 0 1,88 0,03
3.3. Spectroscopy
The following analyses of the Surf-Free sample (not shown here) have been carried out in order to check the nature of the organic molecules related to the weight loss as revealed by TGA analysis. First, 13C NMR shows only two peaks that have a chemical shift identical to the one of the isopropanol carbons (23 and 66 ppm). No signs of eventual surfactant residues can be seen in the 13C NMR analysis. Secondly, 29Si NMR shows a decrease of the silanols Q3 signal, indicating that a condensation reaction occurred with the surface silanols. Finally, the infra-red analysis of the Surf-Free sample shows peaks at 2940 and 2980 cm-1 associated with the C-H vibration of isopropanol, and the intensity of the surfactant C-H vibrations at 2851 and 2920 cm-1 is closed to zero for this sample. If the Surf-Free powder is dried at 100°C under vacuum, the results remain unchanged. This indicates that isopropanol has been grafted on the silica surface. Actually, the As-Synth silica is washed after synthesis until the pH has reached a 5 – 6 value. It is very much likely that some remaining acid promotes the isopropanol grafting by condensation to the silanols of the surface during surfactant extraction in the Surf-Free sample.
3.4. XRD
The XRD pattern of the As-Synth silica (Fig. 3) exhibits two sharp peaks characteristic of the first and second diffraction order of the lamellar structure, which correspond to a d-spacing of 39 Å in the pristine lamellar stacking. The XRD patterns of the silica after surfactant extraction or after silanization exhibit one peak which indicates that the periodic structure of the platelet stacking is maintained. This is due to the grafting of the silanes in the case of GPM and PEO and to the grafting of isopropanol in the case of Surf-Free, which prevent the collapsing of the lamellae. It has been shown previously that the periodic lamellar structure was indeed preserved after surfactant extraction for the GPM sample but not for the PEO sample prepared with the addition of 5.9 mmol of PEOTMS silane [12]. In the present study, the same procedure and conditions were used. However, the quantity of initial materials used to prepare the As-synth silica in this study was lower and the sample PEO analysed here has been prepared with a higher amount of silane added (21 mmol). Reproducibility of the previous and current results was checked and it seems that the quantity of initial material and silane may be critical factors to the final periodic structure of the platelets. It was also verified that this does not affect the other results, including the pores and nitrogen adsorption characteristics as des cribed in this article.
From the XRD diffraction peak of the silica, the thickness of the tactoïds (the organized aggregates of lamellar sheets) can be estimated by using the Scherrer equation [14]. The value of this thickness is shown for the different samples in Table 2. The presence of the silica diffraction peak indicates that the periodic stacking of the silica sheets is preserved after surfactant extraction and/or silanization. However, it can be observed that these modification of the initial lamellar substrate decreases the thickness and therefore the number of sheets periodically layered in the tactoids.
Table 2. Thickness of the tactoids estimated by the Scherrer equation.
As-synth PEO GPM Surf-Free
Thickness of the tactoids 35 4 nm 26 3 nm 20 2 nm 19 2 nm
3.5. Nitrogen adsorption-desorption
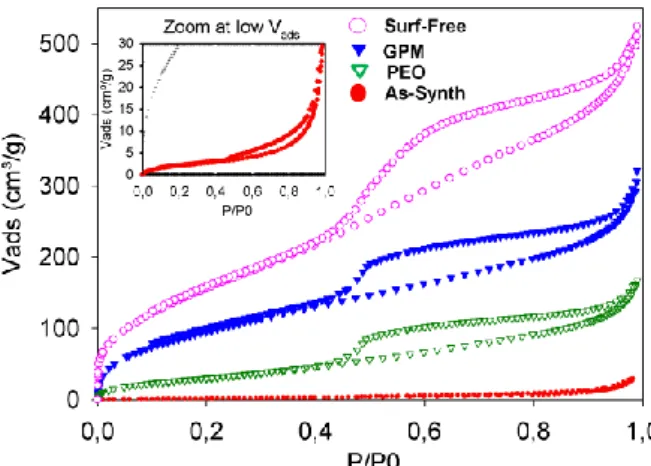
The nitrogen adsorption – desorption isotherms of the samples are shown on Fig.4. The sample without surfactant (Surf-Free) shows the higher level of nitrogen adsorption, followed by the silanized samples GPM and PEO, while the As-Synth sample adsorbs a very low amount of nitrogen. The isotherms can be classified as type IV in accordance with IUPAC classification [4, 15]. The hysteresis loop is associated to capillary condensation in mesopores. The samples can be classified in two groups regarding to the type of hysteresis. The initial silica substrate is characterized by a type H3 hysteresis characteristic of plate-like particles. The others samples have a type H4 hysteresis often associated with narrow -slit like pores but, as notified in the IUPAC recommendations for reporting physisorption data, the H4 type loop also has a Type I isotherm character indicative of microporosity.
Specific surface areas (SSA) calculated from isotherms using the BET equation [13] are given in Table 3. For all samples, the fitting has been made for P/P0 between 0.1 and 0.3, the coefficient of determination is higher than 0.9995 and the parameter C values are higher than 20, assuring reliable values of the specific surface (according to IUPAC recommendations [15]). The SSA values decrease as follows: (Surf-Free) > (GPM) > (PEO) >>>> (As-Synth). The order is identical to the order of volume adsorbed for the isotherms as discussed previously.
Table 3. Results obtained from BET model for nitrogen adsorption.
As-Synth PEO GPM Surf-Free
Specific surface area (accessible) (m²/g)
8,5 0,1 122,9 0,8 375,4 0,8 612,3 1,3
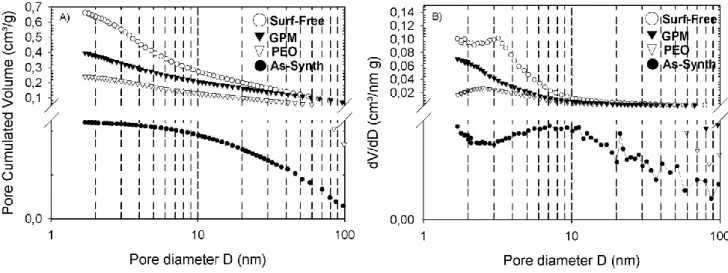
The Barret-Joyner-Hallenda (BJH) method can be used to calculate the pore size distribution [16]. Fig.5A shows the cumulative pore volume distribution for the studied samples and Fig.5B shows the corresponding differential plots. The cumulative pore volume distribution is linked to the volume occupied by pores as a function of their size and the differential pore volume distribution is linked to the number of pores with a given size. For the As-Synth sample, the differential volume distribution shows a broad band around 8-9 nm while the cumulative volume adsorbed starts to decrease for pores larger than 8 -9 nm. This indicates that for the initial As-Synth silica substrate, a considerable part of the nitrogen volume is adsorbed by pores with 8 -9 nm size. On the other hand, for the other samples, both cumulative and differential pore volume distribution decrease for pores smaller than 2 -3 nm with a significant number of pores smaller than 4 nm adsorbing a great quantity of nitrogen.
The specific surface calculated by BET (SBET = SSA) is the total surface of the sample including all types of pores, i.e.
micropores, mesopores and macropores. Then:
SSA = SBET = Smicropores + Smesopores + Smacropores
However, the nitrogen adsorption analyses do not allow macropores measurement which can only be calculated by means of Hg porosimetry. Therefore in this case, it turns out that:
SBET = Smicropores + Smesopores
Because BHJ method has been developed for mesoporous materials [15, 16], the comparison between the specific surface calculated by BET (SBET) and the adsorption cumulative area of pores calculated by BHJ (Smesopores = SBJH) can highlight the
mesoporous or microporous tendency of the material. If SBET > SBJH then the solid shows microporosity. If SBET SBJH then the
solid is essentially mesoporous. The results of surface area calculated by both methods are shown in 4. From these results, it can be concluded that microporosity is significant for GPM and Surf-Free, these also being the materials with the highest specific surface.
Table 4. Comparative specific surface calculated by means of BET and BJH model
As-Synth PEO GPM Surf-Free
SS BET (m²/g) 8,5 0,1 122,9 0,8 375,4 0,8 612,3 1,35
BJH adsorption cumulative area (m²/g)
9,6 0,1 135,4 0,8 250,2 0,8 479,5 1,3
Moreover, in the Fig.5B, one can notice that the differential pore volume adsorbed remains important for pores smaller than 2 nm for both hybrids and Surf-Free. This behaviour indicates the presence of microporosity in these materials.
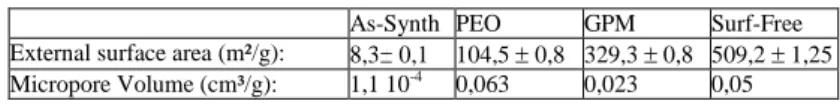
The microporous properties of the materials can be assessed by the method proposed by Kruk - Jaroniec -Sayari (KJS method). This method is similar to the V -alpha method proposed by Sing but uses a different reference sample. The micropore volume and external surface area have been estimated with this method and the results are listed in 5. The micropore volume of the As-Synth sample is very low and its external surface area is closed to the BET specific surface. There is therefore no sign of microporosity observed for this sample. The external surface area as well as the difference between this surface area and the BET SSA increases in the same order than observed before for the different samples. The micropore volume increases when the surfactant is replaced by the silanes and is maximum for the non-silanated sample without surfactant, exhibiting the highest specific surface area.
Table 5. Micropore volume and specific surface area calculated with the KJS method.
As-Synth PEO GPM Surf-Free
External surface area (m²/g): 8,3 0,1 104,5 0,8 329,3 0,8 509,2 1,25
Micropore Volume (cm³/g): 1,1 10-4 0,063 0,023 0,05
4. Discussion
Four lamellar inorganic silica samples with different organic molecules between the platelets have been prepared. The As-Synth silica has a quaternary ammonium surfactant bearing two long alkyl chains linked to the surface by hydrogen bonding. The GPM and PEO silicas have different silanes covalently attached to the platelet surface. Finally, in the Surf-Free silica, the initial surfactant template has been extracted and isopropanol has been covalently grafted to the lamellae surface. The XRD analyses show that the platelet periodic stacking is preserved for all samples. The samples before and after silanization or surfactant extraction exhibit great differences of specific surface area or SBET as it has been shown by nitrogen adsorption. It has been shown
previously that the lamellar morphology and size of the platelets were similar for all samples [12]. The great difference of specific surface area between these samples can therefore only be explained by the opportunity for nitrogen to access the interlamella r spaces and the presence of pores at the lamellae surface. The difference of specific surface a nd micropore volume for GPM and
PEO samples indicates that this access depends on the molecules present on the silica surface. The results and trends highlighted
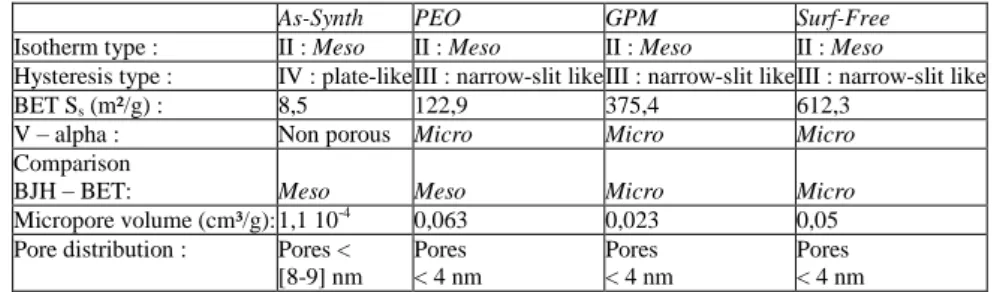
by nitrogen adsorption analyses are listed in Table 6. Clearly, all the samples exhibit mesopores as noticed with the type 4 isotherm. The samples can however be divided in two categories depending on the types of hysteresis and the pore size distribution: the As-Synth sample has very low specific surface area, plate-like particles type hysteresis loop and mesopores smaller than 8 - 9 nm. After surfactant extraction or silanization combined to surfactant extraction, the samples exhibit specific surface area twelve to seventy times higher than the As-Synth sample and narrow-slit like pore hysteresis with pore sizes lower than 4 nm. The very high specific surface area of the Surf-Free sample shows here the main advantage of surfactant extraction in isopropanol compared to the extraction by combustion, which lead to very low specific area material due to the collapsing of the lamellae stacking [17]. In addition, the analysis of the data has revealed the presence of micropores after surface modificat ion or surfactant extraction. The volume occupied by the micropores indeed increases along with the specif ic surface area of these samples. Three categories of pore size have been therefore noticed in the samples: micropores, mesopores between 2 – 5 nm and some mesopores around 8 – 9 nm for the As-Synth sample.
Table 6. Results and trends highlighted by nitrogen adsorption analyses. ―Micro‖ and ―Meso‖ means that microporous and mesoporous trends have been respectively highlighted by the analysis.
As-Synth PEO GPM Surf-Free
Isotherm type : II : Meso II : Meso II : Meso II : Meso
Hysteresis type : IV : plate-like III : narrow-slit like III : narrow-slit like III : narrow-slit like
BET Ss (m²/g) : 8,5 122,9 375,4 612,3
V – alpha : Non porous Micro Micro Micro
Comparison
BJH – BET: Meso Meso Micro Micro
Micropore volume (cm³/g): 1,1 10-4 0,063 0,023 0,05
Pore distribution : Pores <
[8-9] nm Pores < 4 nm Pores < 4 nm Pores < 4 nm
It has been indicated in previous article that the thickness of the silica sheets is approximately 1 nm [13], therefore significantly lower than the mesopore sizes highlighted in the present study. Taking this into account, the structure and organization of t he silica sheets may be explained in the following way and as suggested on Fig. 6. In the As-Synth initial substrate, the lamellae are well packed and organized as seen by XRD, with the surfactant well organized in the all -trans form between the silica sheets [17, 18], therefore the nitrogen is only adsorbed on the external surface of the silica stacking. The high anisotropy of the silica sheets prepared here can explain the plate-like particles hysteresis observed for this sample. After silanization for GPM and PEO samples, or after surfactant extraction for Surf-Free sample, these well-organized molecules are removed or replaced by the corresponding silane. At this point, nitrogen can be adsorbed between the silica sheets and the specific surface area accessi ble to nitrogen greatly increases. The narrow-slit like pores between 2-4 nm put forward by isotherm analyses are attributed to the pores between the silica lamellae. Finally, the micropores noticed should be located inside the silica lamellae: they are probably resulting from TEOS condensation during As-Synth preparation. The specific surface area as well as the micropore volume are the highest for the Surf-Free sample. These parameters are also higher for GPTMS than for PEOTMS grafting. This indicates the coverage of micropores by silanes and also suggests that the surface covered by PEOTMS is greater than GPTMS, which is in agreement with the respective size of the silanes.
As mentioned in the introduction, layered lamellar material can be interesting materials for catalysis applications, especial ly if they exhibit great specific surface area [6]. It is therefore interesting to compare the BET surface area of the present silicas to the specific surface of the other lamellar materials described in the literature. By exchanging the initial calcium ion of a natu ral montmorrillonite, Lee et al have measured a maximum BET specific surface of 173,5 m²/g [19]. The BET specific surface of a potassium montmorrillonite studied by Elm’Chaouri et al was 125 m²/g [20]. Lamellar mesostructured silica was also synthesized by templating with a maximum BET surface area of 674 m²/g after calcinations [21]. A combined lamellar and wormhole-like mesostructured silica with a maximum of 630 m²/g was prepared by Fujimoto et al [22]. Liquid crystal templating was also used by Kluson et al to prepare lamellar sheets of titania, exhibiting a BET surface of 320 m²/g [23]. The values of BET specific surface area obtained in the present study are therefore very high compared to natural lamellar clays and they are similar to the best mesostructured lamellar silica found in the litterature. In our previous study, similar BET specific surface were obtained by calcination of the As-Synth silica [13], but the surfactant extraction method presented here requires less energy and a combined silanization can be performed simultaneously to surfactant extraction if desired. These silica particles also offer the advantage of combining meso and microporosity, which make them interesting materials for catalysis application. Their anisotropy and the possible surface adjustment by silanization make them also appropriate fillers for nanocomposites.
5. Conclusions
Synthetic lamellar silica and lamellar hybrid silica were prepared and characterized by different methods including nitrogen adsorption. The ordered layering of the silica sheets is preserved for all samples, with the initial surfactant and after surfactant extraction and/or silanization. The specific surface increases significantly after surfactant extraction and/or silanization. The models used to analyse the data have highlighted signs of microporosity for the high specific surface samples. In order to e xplain the results, a representation of the porous structure of the samples has been proposed. They can be classified in two categories: the initial well-ordered lamellar silica exhibits very low specific surface area and the samples resulting from this latter sample modification show high specific surface area. The results suggest that nitrogen cannot access interlamellar spaces in the As-Synth sample. Three types of pores were revealed for the different materials: a few mesopores around 8 -9 nm are located between the well-ordered stacks of particles, narrow slit-like mesopores smaller than 4 nm can be assigned to the interlamellar spaces, and micropores are located in the silica lamellae. The silane chains actually cover the micropores after surface modification. The values of BET specific surface area are very high compared to natural lamellar clays and they are similar to the best mesostructured lamellar silica found in the litterature. Moreover, the lamellar silica prepared combine micro and mesopores, which make them interesting materials for further catalysis application.
6. Acknowledgements
The authors would like to thanks the ―Fonds National pour la Recherche Scientifique‖ for the mobility funding in the frame of this study.
7. References
[1] C.T. Kresge, M.E. Leonowicz, W.J. Roth, J.C. Vartuli, J.S. Beck, Ordered mesoporous molecular sieves synthesized by a liquid-crystal template mechanism, Nature, 359 (1992) 710-712.
[2] N. Nishiyama, A. Koide, Y. Egashira, K. Ueyama, Mesoporous MCM-48 membrane synthesized on a porous stainless steel support, Chemical Communications, 19 (1998) 2147.
[3] R. Burch, N. Cruise, D. Gleeson, S.C. Tsang, Surface-grafted manganese–oxo species on the walls of MCM-41 channels—a novel oxidation catalyst, Chemical Communications, (1996) 951-952.
[4] IUPAC, Reporting physisorption data for gas/solid systems with special reference to the determination of surface area and porosity, Pure and Applied Chemistry, 57 (1985) 603-619.
[5] A. Corma, Studies in surface science and catalysis, 49 (1989) 49.
[6] A. Corma, From microporous to mesoporous molecular sieve materials and their use in catalysis, Chemical Reviews, 97 (1997) 2373-2419.
[7] K. Lourvanij, G. Rorrer, Application of Al-pillared clay minerals as catalytic carriers for the reaction of NO with CO, Applied Catalysis A: General 109 (1994) 147.
[8] A. Weiss, Replication and evolution in inorganic systems, Angewandte Chemie International Edition, 20 (1981) 850. [9] C. Volzone, Hydroxy-chromium smectite; influence of Cr added Clays and clay minerals, 43 (1995) 377.
[10] M.S. Tzou, T.J. Pinnavaia, Cromia Pillared Clay, Catalysis Today, 2 (1988) 243.
[11] M.P. McDaniel, K.S. Collins, E.A. Benham, T.H. Cymbaluk, The activation of Phillips Cr/silica catalysts V. Stability of Cr(VI), Applied Catalysis A: General, 335 (2008) 252-261.
[12] G. Toussaint, M. Brisbois, J. Grandjean, C. Henrist, R. Cloots, Hybrid lamellar silica: Combined template extraction and hydrophilic silanation, Journal of Colloid and Interface Science, 329 (2009) 120-126.
[13] C. Henrist, I.G. Cano, M.A. Rodriguez, A.H. de Aza, R. Cloots, A. Rulmont, C. Vogels, Structural evolution of lamellar surfactant - silica hybrids upon calcination, Composites Science and Technology 63, (2003) 1131.
[14] D.L. Bish, J.E. Post, Modern Powder Diffraction, Mineraal Society of America, Washington, 1989.
[15] IUPAC, recommendations for the characterization of porous solids, Pure and Applied Chemistry, 66 (1994) 1739-1758.
[16] E.P. Barret, L.G. Joyner, P.P. Halenda, The determination of pore volume and area distributions in porous substances, I - Computation from nitrogen isotherms, Journal of the American Chemical Society, 73 (1951) 373-380.
[17] S. Borsacchi, M. Geppi, L. Ricci, G. Ruggeri, C.A. Veracini, Interactions at the surface of organophilic-modified laponites: a multinuclear solid-state NMR study, Langmuir, 23 (2007) 3953-3960.
[18] K. Okuyama, Y. Soboi, K. Hirabayashi, A. Harada, A. Kumano, M. Kaziyama, Single crystals of totally synthetic amphiphiles, dialkyldimethylammonium bromides, Chemistry letters, (1984) 2117-2120.
[19] J.F. Lee, C.K. Lee, L.C. Juang, Size effect of exchange cation on the pore structure and surface fractility of montmorillonite, Journal of Colloid and Interface Science, 217 (1999) 172-176.
[20] A.E. Chaouri, M.H. Simonot-Grange, Donnees experimentales et modelisation d'adsorption des systemes N 2 (g) / montmorillonite potassique de Camp-Berteau et N2 (g) / hydrotalcite carbonatee Thermochimica Acta, 399 (1999) 117 - 123.
[21] H. Zhang, Z. Jin, X. Wang, A new synthesis of lamellar-mesostructured silica by using poly(ethylene glycol) disearate as template, Materials research bulletin, 43 (2007) 7.
[22] Y. Fujimoto, A. Shimojima, K. Kuroda, Surfactant-free synthesis of lamellar and wormhole-like silica mesostructures by using 1-alkynyltrimethoxysilanes, Journal of Materials Chemistry, 16 (2006) 986-994.
[23] P. Kluson, H. Luskova, O. Solcova, L. Matejova, T. Cajthaml, Lamellar micelles-mediated synthesis of nanoscale thick sheets of titania, Materials Letters, 61 (2007) 2931-2934.
Figures
Graphical abstract :
Fig. 1. Reaction scheme of samples preparation :
« As-Synth » lamellar silica Water
HCl
SiO2
SiO2
Si(OCH2CH3)4 + R4N+Cl
-« PEO » lamellar silica GPTMS SiO2 SiO2 PEOTMS «GPM » lamellar silica SiO2 SiO2
«Surf Free » lamellar silica
SiO2