HAL Id: inserm-00906769
https://www.hal.inserm.fr/inserm-00906769
Submitted on 20 Nov 2013HAL is a multi-disciplinary open access archive for the deposit and dissemination of sci-entific research documents, whether they are pub-lished or not. The documents may come from teaching and research institutions in France or abroad, or from public or private research centers.
L’archive ouverte pluridisciplinaire HAL, est destinée au dépôt et à la diffusion de documents scientifiques de niveau recherche, publiés ou non, émanant des établissements d’enseignement et de recherche français ou étrangers, des laboratoires publics ou privés.
MYEOV is a prognostic factor in multiple myeloma.
Jérôme Moreaux, Dirk Hose, Amélie Bonnefond, Thierry Rème, Nicolas
Robert, Hartmut Goldschmidt, Bernard Klein
To cite this version:
Jérôme Moreaux, Dirk Hose, Amélie Bonnefond, Thierry Rème, Nicolas Robert, et al.. MYEOV is a prognostic factor in multiple myeloma.. Experimental Hematology, Elsevier, 2010, 38 (12), pp.1189-1198.e3. �10.1016/j.exphem.2010.09.002�. �inserm-00906769�
MYEOV is a prognostic factor in Multiple Myeloma
Moreaux J*‡, Hose Dº&, Bonnefond A‡, Reme T*‡, Robert N*, Goldschmidt Hº&, Klein B*†‡
* CHU Montpellier, Institute of Research in Biotherapy, Montpellier, FRANCE; ‡
INSERM, U847, Montpellier, F-34197 France; º
Medizinische Klinik und Poliklinik V, Universitätsklinikum Heidelberg, Heidelberg, Germany
†
Université MONTPELLIER1, UFR Médecine, Montpellier, France; &
Nationales Centrum für Tumorerkrankungen, Heidelberg, Germany
Corresponding author: Pr. Bernard KLEIN, PhD
Institute for Research in Biotherapy CHU Montpellier, Hopital St Eloi Av Augustin Fliche 34285 MONTPELLIER Cedex 5 FRANCE Phone: +33 4 67 33 01 90 Fax: + 33 4 67 33 79 05 e-mail: [email protected] http://irb.chu-montpellier.fr/
Abstract word count: 217 words Text word count: 3057 words
Abstract
Objective
Multiple myeloma (MM) is a plasma cell neoplasm characterized by the accumulation
of malignant plasma cells within the bone marrow. This disease still remains
incurable, despite major treatment improvements. However, gene expression
profiling of multiple myeloma cells (MMC) may lead to the identification of new
therapeutic targets.
Methods
Using Affymetrix microarrays, we identified the overexpression of the MYEOV gene
in MMC of 171 patients with newly-diagnosed multiple myeloma, compared to normal
plasma cells.
Results
The MYEOV gene was present (Affymetrix call) in 79% of MMC and in 15% of
normal plasma cells. MYEOV gene is not expressed in cells of the patients’ bone
marrow (BM) environment. The down-regulation of MYEOV gene reduced the growth
of a MYEOVpresent myeloma cell line, unlike a MYEOVabsent one. Patients with
MYEOVabsent MMC have an increased event free survival compared to patients with
MYEOVpresent MMC, after high-dose therapy and stem cell transplantation and a trend
for increased overall survival. In a Cox-proportional-hazard model, MYEOV
expression in MMC is predictive for EFS for patients independently of ISS stage,
t(4;14) translocation, albumin or B2M serum levels. A knock out of MYEOV
significantly reduced the growth of MMC.
Conclusion
Thus, MYEOV expression is a prognositic factor for patients with MM, in part through
Keywords
Multiple Myeloma, prognostic factor, therapeutic target, tumor growth, gene
Introduction
Multiple myeloma (MM) is a plasma cell neoplasm characterized by the accumulation
of malignant plasma cells within the bone marrow (BM). Several autocrine or
paracrine factors can promote multiple myeloma cell (MMC) survival and proliferation
[1-4] and inhibition of MMC growth factors may have clinical applications in
combination with other drugs[5-7].
In order to identify new therapeutic targets in MM, we compared gene expression
profiles (GEP) of MMC with those of normal plasma cells, normal plasmablasts and
normal peripheral blood B cells. We identified that MYEOV gene (for Myeloma
overexpressed gene) was expressed in malignant plasma cells in 79% of
newly-diagnosed patients with MM. The MYEOV gene was originally isolated by the
application of the NIH/3T3 tumorigenicity assay with DNA from a gastric carcinoma.
The chromosomal region 11q13 is frequently associated with genetic rearrangements
in a large number of human malignancies, including B cell malignancies[8-10] and
overexpression of MYEOV is frequently observed in breast tumors and oral and
esophagal squamous cell carcinomas[11]. Although MYEOV is expressed in a
subset of human myeloma cell lines (HMCLs) with t(11;14)(q13;q32)
translocation[12], MYEOV expression is rarely related with t(11;14) in MM[13].
Recently, Janssen et al. demonstrated MYEOV gene expression is transcriptionally
silenced by a DNA-methylation mechanism in esophageal squamous cell
carcinomas[14].
The presence of functional domains such as RNP-1 (motif typical of RNA binding
protein) and the studies of the short hydrophobic regions and of the C-terminal
leucine/isoleucine tail showed that MYEOV might be directed to the membrane[12].
that MYEOV siRNA decreased proliferation of gastric cancer cells and colon cancer
cell lines in vitro[15, 16].
In this study, we demonstrate that MMC of 79% of the patients with newly-diagnosed
MM express MYEOV gene. For patients treated with high dose chemotherapy (HDC)
and autologous hematopoietic stem cell transplantation (ASCT), MYEOV gene
expression is a prognostic factor for EFS independent of ISS stage, HRS, t(4;14)
translocation, albumin or β2M serum levels.
Materials and methods Cell samples
XG human myeloma cell lines were obtained as described[17-20]. SKMM, OPM2,
LP1 and RPMI8226 HMCLs were purchased from ATTC (LGC Promochem, France).
MMC were purified from 171 patients with newly-diagnosed MM after written
informed consent was given in accordance with the Declaration of Helsinki and IRB
approval of the University hospitals of Heidelberg (Germany) or Montpellier (France).
These 171 patients were treated with high dose therapy (HDC) and autologous stem
cell transplantation (ASCT) and were termed in the following Heidelberg-Montpellier
(HM) series. Patients’ characteristics are indicated in Supplementary Table S1. The
obtaining and purification of MMC, normal bone marrow (BM) plasma cells (BMPC),
memory B cells, polyclonal plasmablasts, osteoclasts, BM stromal cell lines, BM
CD34 cells, BM CD3 T cells, BM monocytes and BM polymorphonuclear neutrophils
were performed as previously described[21]. We also used Affymetrix data of a
cohort of 208 purified MMCs from previously untreated patients from the University of
Arkansas for Medical Sciences (UAMS, Little Rock, AR). These patients were treated
publicly available through online Gene Expression Omnibus (Gene Expression
Profile of Multiple Myeloma, accession number GSE2658.
http://www.ncbi.nlm.nih.gov/geo/. Accessed June 1, 2006). Publicly available data
from LR-TT2 cohort were not used because these patients were treated with
thalidomide[23] and this information is not publicly available.
Preparation of complementary RNA (cRNA) and microarray hybridization
RNA was extracted using the RNeasy Kit (Qiagen, Hilden, Germany). Biotinylated
cRNA was amplified with a double in vitro transcription reaction and hybridized to the
Affymetrix HG U133 set of Gene Chips, according to the manufacturer’s instructions
(Affymetrix, Santa Clara, CA). Microarray data have been deposited in the
ArrayExpress public database, under accession numbers E-MEXP-2360 for BMPC
[24] and E-TABM-937 for B cells, PPC, MMC and BM environment samples.
Real-time RT-PCR
Total RNA was converted to cDNA using the Superscript II reverse transcriptase
(Invitrogen, Cergy Pontoise, France). The assays-on-demand primers and probes
and the TaqMan Universal Master Mix were used according to the manufacturer’s
instructions (Applied Biosystems, Courtaboeuf, France). The measurement of gene
expression was performed using the ABI Prism 7000 Sequence Detection System
and analyzed using the ABI PRISM 7000 SDS Software. For each primer, serial
dilutions of a standard cDNA were amplified to create a standard curve, and values
of unknown samples were estimated relative to this standard curve in order to assess
the PCR efficiency. Ct values were obtained for GAPDH and the respective genes of
interest during log phase of the cycle. Gene of interest levels were normalized to
the values obtained for a known positive control using the following formula 100/2δδCt
where ddCt = dCt unknown – dCt positive control.
5-Aza-2’ –deoxycytidine (5-azadC) treatment
The human MM cell lines XG-6, L363, and LP1 were cultured in RPMI 1640
supplemented with 10% fetal bovine serum. Cells (2 x 10⁵/mL) were treated either
with 0.5 µmol/L Aza-dC or with no drug (control) for 7 days.
Study of apoptosis
After 4 days of culture, cells were washed twice in PBS and apoptosis was assayed
with FITC-conjugated annexin V labeling (Boehringer). Fluorescence was analyzed
on a FACScan flow cytometer (Becton Dickinson).
Cell cycle analysis
DNA was stained with propidium iodide (PI). Cells were washed in PBS, suspended
in 1 mL of 75% ethanol/25% water at room temperature for 2 minutes and washed
again. 500 µl of PBS containing PI (40 µg/mL) and RNAse (100 µg/mL) (both from
Sigma, St Louis, MO, USA) were added to each sample. Cells were incubated for 30
minutes at 37 °C and stored at 4 °C in the dark before analysis with a FACScan flow
cytometer using Cell Quest software. The cell cycle was analyzed with the ModFit LT
software (Verity Software House, Topsham, ME, USA).
Western blot analysis
Cells were lysed in 10 mM Tris-HCl (pH 7.05), 50 mM NaCl, 50 mM NaF, 30 mM
sodium pyrophosphate (NaPPi), 1% triton X-100, 5 µM ZnCl2, 100 µM Na3VO4, 1
mM DTT, 20 mM β-glycerophosphate, 20 mM p-nitrophenolphosphate (PNPP), 20
µg/ml aprotinin, 2.5 µg/ml leupeptin, 0.5 mM PMSF, 0.5 mM benzamidine, 5 µg/ml
pepstatin, and 50 nM okadaic acid. Lysates were resolved on 12% sodium dodecyl
nitrocellulose membrane (Schleicher and Schuell, Kassel, Germany). Membranes
were blocked for 2 hours at room temperature in 140 mM NaCl, 3 mM KCl, 25 mM
Tris-HCl (pH 7.4), 0.1% Tween 20 (TBS-T), 5% non-fat milk and human Ig (1 mg/ml),
and then immunoblotted with a rabbit anti-MYEOV (Proteintech Group, Chivago, IL).
As a control for protein loading, we used a mouse monoclonal anti-β-actin antibody
(Sigma, St Louis, MO). The primary antibodies were visualized with goat anti-rabbit
(Sigma) or goat anti-mouse (Bio-Rad, Hercules, CA) peroxidase-conjugated
antibodies by an enhanced chemiluminescence detection system. Blots were
quantified by densitometry using acquisition into Adobe Photo Shop (Adobe
Systems, San Jose, CA), and analyzing with the NIH Image software (National
Institutes of Health, Bethesda, MD, USA).
siRNA transduction
The MYEOV siRNA smart pool (M-016553-00) (Dharmacon Inc, IL, USA) was
transduced by electroporation (Amaxa, Köln, Germany) using nucleofaction. We also
used Dharmacon’s negative control siRNA (ON-TARGETplus siCONTROL
Non-Targeting siRNA) as a control. RPMI8226, XG-7 and LP1 HMCLs were
electroporated using respectively the T solution and programs T-001 or A-023
according to manufacturer’s instructions[25]. After electroporation, HMCLs were
cultured for 4 days in 96-well flat-bottom microtiter plates in serum-free culture
medium Syn H (ABCell-Bio, Montpellier, France) without cytokine as previously
described[3].
Statistical analysis
Gene expression data were normalized with the MAS5 algorithm and analyzed with
http://amazonia.montp.inserm.fr/)[26, 27] or the SAM (Significance Analysis of
Microarrays) software[28].
Survival curves were plotted using the Kaplan-Meier method. The statistical
significance of differences in event free or overall survivals between groups of
patients was estimated by the log-rank test. Univariate analyses were done to screen
for prognostic variables by using Cox proportional hazards regression. The Cox
model was also used for multivariate analysis to identify the most significant variables
related to survival. A P value ≤ .05 was considered significant in all statistical
analyses. Statistical comparisons were done with R (http://www.r-project.org/) or
SPSS11 (SPSS Chicago, IL) software. The biological functions and pathways
encoded by a gene list was analyzed with Ingenuity software (Ingenuity® Systems,
Results and Discussion
MYEOV gene expression was investigated in purified MMC from 171 patients and 20
HMCLs using Affymetrix microarrays. Of the 5 MYEOV probe sets, the 227342_s_at
probe set was the most strongly correlated with real time RT-PCR data (r = .86, P <
.001) on the 20 HMCLs (Figure 1A). The use of present or absent Affymetrix call
determined by the MAS5 algorithm was also validated for this probe set since only
the 9 real-time RT-PCR+ HMCLs had an Affymetrix present call (Figure 1 A). In the
following, the present and absent Affymetrix call of 27342_s_at probe set was used
to combine microarray data from different patients’ cohort performed with A+B or
U133 plus 2.0 microarrays. MYEOV gene was expressed (present call) in 9/20
HMCLs and in 131 of 171 purified MMCs of newly-diagnosed patients.
MYEOV gene expression was also confirmed at protein level in 9 HMCLs and
primary MMCs from 4 patients using western blot (Figure 1 B & C). Normalized
MYEOV protein expression was significantly correlated with MYEOV Affymetrix
expression (r = .9, P = .001) (Figure 1 B). The western blot analysis of MYEOV
expression was not easy since only 2 antibodies are commercially available and they
were not validated in previous peer-reviewed publications. The antibody we used
provided a specific but weak signal after incubation with the anti-MYEOV antibody.
MYEOV gene expression in primary MMCs was compared to that in normal BM
plasma cells, normal plasmablasts or normal memory B cells. Whereas MYEOV
27342_s_at probe set had a present call (MYEOVpresent) in 9/20 HMCLs and 131/171
primary MMCs, it had rarely a present call in BMPC (1/7) and was absent
(MYEOVabsent) in normal plasmablasts (0/7) or memory B cells (0/7) (Figure 2). Of
note, MYEOV probe set had a present call in purified plasma cells from 6/7 patients
plasma cells from individuals with the premalignant phase of MM is appealing. Such
observation was already done for CD200 that is not expressed in normal plasma
cells, aberrantly expressed in MMCs in association with a poor prognosis and also
expressed in MGUS plasma cells[29]. A likely explanation is that cancer disease is a
multi hit disease. MYEOV overexpression could be one oncogenic hit that requires
additional hits, occurring in myeloma cells, to be able to promote tumor formation
and/or drug resistance.
MYEOV gene expression was investigated in the BM environment from patients with
MM. MYEOV gene was not expressed in CD14 monocytes, CD15 polynuclear cells
and CD3 T cells purified from the BM of 5 newly-diagnosed patients. It is also not
expressed in 7 osteoclast samples, in BM stromal cells and in CD34+ hematopoietic
stem cells from 5 patients with MM (Figure 2 and Supplementary Table S3). These
data were validated by real-time RT-PCR (Supplementary data, Figure S1).
MYEOV gene expression in MMCs delineates a subset of patients with specific
clinical characteristics. The frequencies of patients with lambda-light chain MM, with
C-reactive protein level ≥ 5 mg/liter, LDH ≥ 240 IU/liter, or chromosome 13 deletion
are increased in patients with MYEOVpresent MMCs (Supplementary data Table S2).
Patients with MYEOVabsent MMC had a better event free survival (55 months)
compared to patients with MYEOVpresent MMC (26 months) (Figure 3 A) and a trend
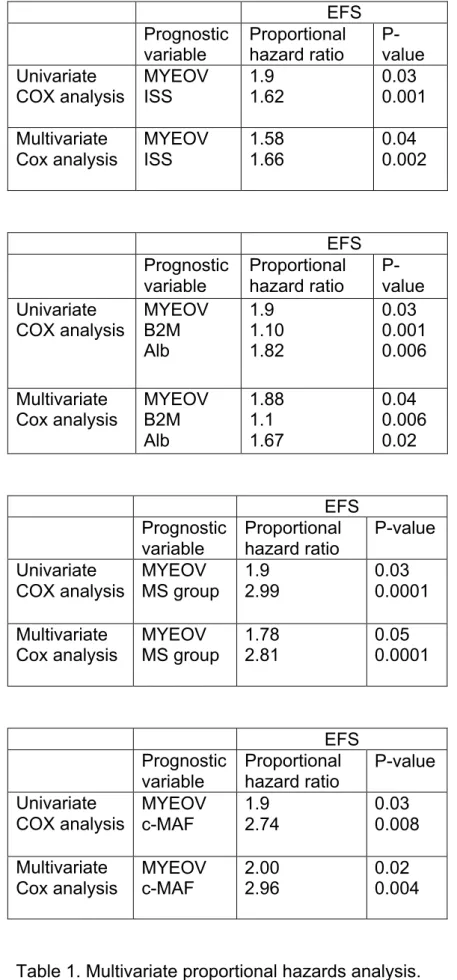
for better overall survival (P = .06) (Figure 3 B). In a Cox-proportional-hazard model,
the absence or presence of MYEOV (P = 0.01, hazard ratio = 1.9) and ISS-stage (P
= 0.001, hazard ratio = 1.6) are independently predictive for EFS (P = 0.04 and P =
0.002 respectively) (Table 1). If MYEOV expression is tested together with classical
prognostic factors, i.e. serum albumin and serum β2M, MYEOV expression (P =
factors. MYEOV expression (P = .05) is an independent prognostic factor of spiked
MMSET expression, that is an indicator of t(4;14) translocation (P = .0001) [3] and of
a spiked c-MAF expression, that is an indicator of t(14;16) translocation (P = .004)
[30] (Table 1). We also looked for the prognostic value of MYEOV expression in
MMCs in publicly available data from LR-TT3 series. MYEOV had a “present” call in
MMCs of 73% of these patients. Patients with MYEOVabsent MMCs had a significant
better overall survival in the LR-TT3 cohort (P = .04) (Figure 3 C). EFS data for the
LR-TT3 cohort were not publicly available. A comparison of MYEOV prognostic value
with those of other prognostic factors (ISS, genetic abnormalities) could not be done
because these data are not publicly available.
MYEOV expression was previously described in a subset of HMCLs with
t(11;14)(q13;q32) translocation[12]. No correlation between MYEOV expression and
t(11;14)(q13;q32) translocation was found in primary MMCs (Supplementary data
Table S2). Specht, et al also reported that MYEOV expression is rarely related with
t(11;14) in MM [13]. Since MYEOV has been shown to be transcriptionally silenced
by a DNA-methylation mechanism in esophageal squamous cell carcinomas, [14], we
investigated such an epigenetic regulation of MYEOV gene in MMCs. A treatment
with 5-aza-2’ –deoxycytidine of 2 MYEOVabsent HMCLs (XG-6 and LP1) induced
MYEOV expression without affecting that in the MYEOVpresent L363 HMCL (Figure 4).
Recently, a knock out of MYEOV RNA (siRNA) has been shown to decrease
proliferation of gastric cancer cells and colon cancer cell lines in vitro [15, 16]
suggesting a role of MYEOV in cancer proliferation and invasion. The shorter EFS
and OAS in patients with MYEOVpresent MMC could be explained by a role of MYEOV
in MMC proliferation. MYEOV siRNA downregulated MYEOV gene expression by
the growth of these 2 HMCLs by 40% and 65% respectively (P = .006 and P = .001,
n=5) (Figure 5A&C). The MYEOV siRNA could also knock down MYEOV protein
(Figure 5B). The growth of the MYEOVabsent HMCL LP1 was not affected by the
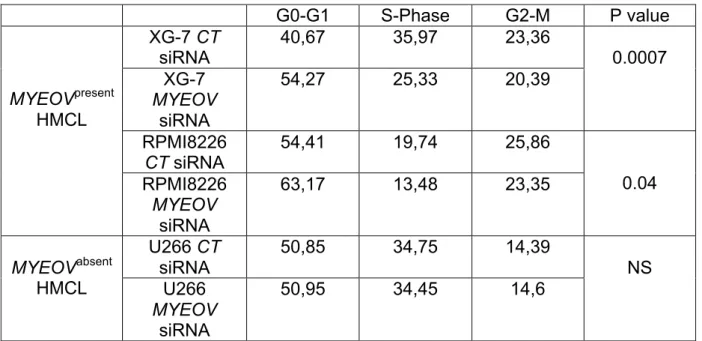
MYEOV siRNA (Figure 5C). MYEOV siRNA did not significantly induce apoptosis in
RPMI 8226 and XG-7 HMCLs, but it blocked the cell cycle entry into the S phase
(Figure 5D&E and Table 3).
In order to identify genes that are co-regulated with MYEOV gene, gene expression
of MYEOVpresent MMCs and MYEOVabsentMMCs of newly-diagnosed patients were
compared using SAM supervised analysis. Probe sets with a present call in less then
3 out of all patients and a variation coefficient ≤ 100 were excluded from the analysis,
yielding to 7073 probe sets. 25 unique genes were differentially expressed between
MYEOVpresent and MYEOVabsentMMCs (2 fold ratio, 1000 permutations and false
discovery rate (FDR) < 5 %) (Table 2). MYEOVpresent MMCs overexpressed
MAGE-A6 cancer testis antigen. In agreement with the bad prognostic factor of MYEOV
expression and its control of MMC proliferation, MAGE-A6 expression is associated
with a shorter event free survival in patients with MM[31] and MAGE-A3/6 protein is
associated with elevated proliferation in MMCs[32].
MYEOVpresent MMCs expressed more weakly the CD81 tetraspanin. The CD81 gene
downregulation in MYEOVpresent MMCs was validated by quantitative RT-PCR
(Supplementary Figure S2). A low CD81 expression may be also involved in
treatment resistance since CD81 can inhibit the adhesion, migration, invasion, and
viability of MMCs [33]. The anti-myeloma effect of CD81/CD82 involves a
down-regulation of Akt, activation of FoxO transcription factors and a decrease in active
mTOR and mTOR/rictor[34]. MYEOVpresent MMCs overexpressed Homer1 gene.
TRAIL activation kills Homer1-positive cells unlike Homer1-negative cells[35].
Homer1 is generally more expressed in cancer cells than their normal counterpart
suggesting it may confer on tumor cells the possibility to be killed by TRAIL
activation[35]. A comprehensive analysis of the biological functions or pathways of
the proteins encoded by these 25 genes using Ingenuity did not reveal more
information.
In conclusion, we have identified that MYEOV expression by MMC is a new factor of
poor prognosis in patients with MM, in part through a role of MYEOV in the control of
EFS Prognostic variable Proportional hazard ratio P-value Univariate COX analysis MYEOV ISS 1.9 1.62 0.03 0.001 Multivariate Cox analysis MYEOV ISS 1.58 1.66 0.04 0.002 EFS Prognostic variable Proportional hazard ratio P-value Univariate COX analysis MYEOV B2M Alb 1.9 1.10 1.82 0.03 0.001 0.006 Multivariate Cox analysis MYEOV B2M Alb 1.88 1.1 1.67 0.04 0.006 0.02 EFS Prognostic variable Proportional hazard ratio P-value Univariate COX analysis MYEOV MS group 1.9 2.99 0.03 0.0001 Multivariate Cox analysis MYEOV MS group 1.78 2.81 0.05 0.0001 EFS Prognostic variable Proportional hazard ratio P-value Univariate COX analysis MYEOV c-MAF 1.9 2.74 0.03 0.008 Multivariate Cox analysis MYEOV c-MAF 2.00 2.96 0.02 0.004
Genes overexpressed in MYEOVpresent MMCs
Chip Probeset Gene Localization Ratio Description
U133P 214612_x_at MAGEA6 Xq28 5.9 melanoma antigen family A; 6
U133P 223629_at PCDHB5 5q31 4.9 protocadherin beta 5
U133P 227342_s_at MYEOV 11q13 4.1 myeloma overexpressed gene (in a subset of t(11;14) positive multiple myelomas)
U133P 205413_at MPPED2 11p13 3.5 metallophosphoesterase domain containing 2
U133P 235228_at KIAA1912 2p16.1 2.9 KIAA1912 protein
U133P 1553698_a_at C1orf96 1q42.13 2.9 chromosome 1 open reading frame 96
U133P 207191_s_at ISLR 15q23-q24 2.9 immunoglobulin
superfamily containing leucine-rich repeat
U133P 205968_at KCNS3 2p24 2.6 potassium voltage-gated channel;
delayed-rectifier; subfamily S; member 3
U133P 217147_s_at TRAT1 3q13 2.5 T cell receptor associated
transmembrane adaptor 1
U133P 242260_at MATR3 5q31.2 2.4 Matrin 3
U133P 213793_s_at HOMER1 5q14.2 2.3 homer homolog 1 (Drosophila)
U133P 225904_at C1orf96 1q42.13 2.2 chromosome 1 open reading frame 96
U133P 203895_at PLCB4 20p12 2.0 phospholipase C; beta 4
U133P 229363_at --- --- 2.0 CDNA FLJ32121 fis; clone PEBLM1000083
Genes overexpressed in MYEOVabsent MMCs
Chip Probeset Gene Localization Ratio Description U133P 201131_s_at CDH1 16q22.1 4.1 cadherin 1; type
1; E-cadherin (epithelial) U133P 209602_s_at GATA3 10p15 2.8 GATA binding
protein 3 U133P 222116_s_at TBC1D16 17q25.3 2.8 TBC1 domain
family; member 16
U133P 1560652_at --- --- 2.7 MRNA; cDNA DKFZp686L0310 (from clone
DKFZp686L0310) U133P 227915_at ASB2 14q31-q32 2.7 ankyrin repeat
and SOCS box-containing 2 U133P 211648_at IGHG3 14q32.33 2.6 Immunoglobulin
heavy constant mu
U133P 212486_s_at FYN 6q21 2.2 FYN oncogene related to SRC; FGR; YES U133P 233255_s_at BIVM
13q32-q33.1
2.1 basic;
immunoglobulin-like variable motif containing
U133P 200675_at CD81 11p15.5 2.1 CD81 antigen (target of antiproliferative antibody 1) U133P 203761_at SLA
8q22.3-qter|8q24
2.0 Src-like-adaptor
U133P 210105_s_at FYN 6q21 2.0 FYN oncogene related to SRC; FGR; YES
Table 2 : 25 unique genes differentially expressed between MYEOVpresent and MYEOVabsentMMCs of newly diagnosed patients (SAM analysis, 2 fold ratio, 1000 permutations and false discovery rate (FDR) < 5 %).
G0-G1 S-Phase G2-M P value MYEOVpresent HMCL XG-7 CT siRNA 40,67 35,97 23,36 0.0007 XG-7 MYEOV siRNA 54,27 25,33 20,39 RPMI8226 CT siRNA 54,41 19,74 25,86 0.04 RPMI8226 MYEOV siRNA 63,17 13,48 23,35 MYEOVabsent HMCL U266 CT siRNA 50,85 34,75 14,39 NS U266 MYEOV siRNA 50,95 34,45 14,6
Table 3 : After electroporation with MYEOV siRNA or siRNA CT, RPMI8226, XG-7
and U266 myeloma cells were cultured at 105 cells/ml. Cells were recovered after 3 days of culture, DNA was labelled with PI and cells were analyzed on a FACScan apparatus. The percentage of cells in the G0-G1, S and G2-M phases of the cell cycle is indicated and was determined using the ModFit LT software. Results are representative of three experiments.
Figure legends
Figure 1. Validation of MYEOV expression.
(A) Gene expression of MYEOV in 20 HMCLs was assayed with real time RT-PCR
and normalized with GAPDH expression. The arbitrary value of 100 was assigned to
XG-7 positive control. The coefficient of correlation between Affymetrix and real-time
RT-PCR values was determined.
(B) Expression level of MYEOV protein in HMCLs using western blot and correlation
with MYEOV gene expression Affymetrix signal value. For each cell line, the ratios of
MYEOV and beta actin proteins were determined in order to compare MYEOV
protein expression between cell lines.
(C) MYEOV protein expression in purified primary myeloma cells using western blot
analysis.
Figure 2. MYEOV gene expression in myeloma cells from patients with MM and
normal cells.
Affymetrix MYEOV gene expression in normal memory B cells, normal polyclonal
plasmablasts, normal BM plasma cells (BMPC), purified myeloma cells from patients
with multiple myeloma (MM), human myeloma cell lines, bone marrow (BM) CD34
cells, BM stromal cells, purified BM CD15, CD14 and CD3 cells and osteoclasts.
Figure 3. Association of MYEOV gene expression and survival of newly-diagnosed
patients with MM.
(A) Kaplan-Meier plot of the event-free survival in patients with MYEOVpresent and
MYEOVabsent MMCs in the HM cohort of 171 patients.
(B) Kaplan-Meier plot of the overall survival in patients with MYEOVpresent and
(C) Kaplan-Meier plot of the overall survival in patients with MYEOVpresent and
MYEOVabsent MMCs in the LR-TT3 cohort of 208 patients from the University of
Arkansas School of Medical Sciences.
Figure 4. Epigenetic regulation of MYEOV gene in MMCs.
Gene expression of MYEOV in XG-6, LP1 and L363 HMCLs was assayed with real
time RT-PCR. Cells (2 x 10⁵/mL) were treated either with 0.5 µmol/L Aza-dC or with
no drug (control) for 7 days. For each experiment, the expression of MYEOV in
myeloma cells was compared to that of untreated myeloma cells which was assigned
an arbitrary value. Data are mean values of five independent experiments.
Figure 5. Inhibition of MYEOV gene expression and myeloma cell growth by a
MYEOV siRNA.
(A) Inhibition of MYEOV gene expression by a MYEOV siRNA. For each
experiment, the expression of MYEOV in myeloma cells treated with MYEOV siRNA
was compared to that of myeloma cells treated with control siRNA, which was
assigned the arbitrary value of 100. Results are the mean MYEOV gene expression
in five independent experiments. * The mean value is statistically significantly
different from that obtained with a non-targeting control siRNA (siRNA CT) using
Student’s t-test for pairs (P ≤.05).
(B) Inhibition of MYEOV protein expression in MMC using MYEOV siRNA.
RPMI8226 myeloma cells were treated for 4 days with MYEOV or control siRNA and
MYEOV protein was assayed by western blot.
(C) After electroporation with MYEOV siRNA or siRNA CT, LP1, RPMI8226 and
XG-7 HMCLs were cultured in serum-free culture medium for 4 days. Results are the
mean ± SD values of the RLU fluorescence determined on sextuplet culture wells.
is statistically significantly different from that obtained with siRNA CT using Student’s
t-test (P ≤.05).
(D) After electroporation with MYEOV siRNA or siRNA CT, RPMI8226 and XG-7
myeloma cells were cultured at 105 cells/ml. Cells were recovered after 3 days of
culture and apoptotic cells were detected by annexin V staining. Results are those of
one experiment representative of three.
(E) DNA was labelled with PI and cells were analyzed on a FACScan apparatus.
The percentage of cells in the S phase of the cell cycle is indicated and was
determined using the ModFit LT software. Results are from one experiment
representative of three.
Acknowledgments
This work was supported by grants from the Ligue Nationale Contre le Cancer
(Equipe Labellisée 2009)(Paris, France) and Institut National du Cancer (R07001FN),
the Hopp-Foundation, Germany, the University of Heidelberg, Heidelberg, Germany,
the National Center for Tumor Diseases, Heidelberg, Germany, and the
References
[1] De Vos J, Hose D, Reme T, et al. Microarray-based understanding of normal and malignant plasma cells. Immunol Rev. 2006;210:86-104.
[2] Mahtouk K, Hose D, De Vos J, et al. Input of DNA microarrays to identify novel mechanisms in multiple myeloma biology and therapeutic applications. Clin Cancer Res. 2007;13:7289-7295.
[3] Sprynski AC, Hose D, Caillot L, et al. The role of IGF-1 as a major growth factor for myeloma cell lines and the prognostic relevance of the expression of its receptor. Blood. 2009;113:4614-4626.
[4] Moreaux J, Sprynski AC, Dillon SR, et al. APRIL and TACI interact with syndecan-1 on the surface of multiple myeloma cells to form an essential survival loop. Eur J Haematol. 2009;83:119-129.
[5] Bataille R, Barlogie B, Lu ZY, et al. Biologic effects of anti-interleukin-6 murine monoclonal antibody in advanced multiple myeloma. Blood. 1995;86:685-691.
[6] Klein B, Wijdenes J, Zhang XG, et al. Murine anti-interleukin-6 monoclonal antibody therapy for a patient with plasma cell leukemia. Blood. 1991;78:1198-1204. [7] Rossi JF, Moreaux J, Hose D, et al. Atacicept in relapsed/refractory multiple myeloma or active Waldenstrom's macroglobulinemia: a phase I study. Br J Cancer. 2009;101:1051-1058.
[8] de Almeida RA, Heuser T, Blaschke R, Bartram CR, Janssen JW. Control of MYEOV protein synthesis by upstream open reading frames. J Biol Chem.
2006;281:695-704.
[9] Gaudray P, Szepetowski P, Escot C, Birnbaum D, Theillet C. DNA
amplification at 11q13 in human cancer: from complexity to perplexity. Mutation research. 1992;276:317-328.
[10] Gollin SM. Chromosomal alterations in squamous cell carcinomas of the head and neck: window to the biology of disease. Head & neck. 2001;23:238-253.
[11] Janssen JW, Cuny M, Orsetti B, et al. MYEOV: a candidate gene for DNA amplification events occurring centromeric to CCND1 in breast cancer. Int J Cancer. 2002;102:608-614.
[12] Janssen JW, Vaandrager JW, Heuser T, et al. Concurrent activation of a novel putative transforming gene, myeov, and cyclin D1 in a subset of multiple myeloma cell lines with t(11;14)(q13;q32). Blood. 2000;95:2691-2698.
[13] Specht K, Haralambieva E, Bink K, et al. Different mechanisms of cyclin D1 overexpression in multiple myeloma revealed by fluorescence in situ hybridization and quantitative analysis of mRNA levels. Blood. 2004;104:1120-1126.
[14] Janssen JW, Imoto I, Inoue J, et al. MYEOV, a gene at 11q13, is coamplified with CCND1, but epigenetically inactivated in a subset of esophageal squamous cell carcinomas. Journal of human genetics. 2002;47:460-464.
[15] Leyden J, Murray D, Moss A, et al. Net1 and Myeov: computationally identified mediators of gastric cancer. Br J Cancer. 2006;94:1204-1212.
[16] Moss AC, Lawlor G, Murray D, et al. ETV4 and Myeov knockdown impairs colon cancer cell line proliferation and invasion. Biochem Biophys Res Commun. 2006;345:216-221.
[17] Zhang XG, Gaillard JP, Robillard N, et al. Reproducible obtaining of human myeloma cell lines as a model for tumor stem cell study in human multiple myeloma. Blood. 1994;83:3654-3663.
[18] Rebouissou C, Wijdenes J, Autissier P, et al. A gp130 interleukin-6 transducer-dependent SCID model of human multiple myeloma. Blood. 1998;91:4727-4737.
[19] Tarte K, Zhang XG, Legouffe E, et al. Induced expression of B7-1 on myeloma cells following retroviral gene transfer results in tumor-specific recognition by
cytotoxic T cells. J Immunol. 1999;163:514-524.
[20] Gu ZJ, Vos JD, Rebouissou C, et al. Agonist anti-gp130 transducer monoclonal antibodies are human myeloma cell survival and growth factors. Leukemia. 2000;14:188-197.
[21] Moreaux J, Cremer FW, Reme T, et al. The level of TACI gene expression in myeloma cells is associated with a signature of microenvironment dependence versus a plasmablastic signature. Blood. 2005;106:1021-1030.
[22] Barlogie B, Anaissie E, van Rhee F, et al. Incorporating bortezomib into upfront treatment for multiple myeloma: early results of total therapy 3. Br J Haematol. 2007;138:176-185.
[23] Barlogie B, Pineda-Roman M, van Rhee F, et al. Thalidomide arm of Total Therapy 2 improves complete remission duration and survival in myeloma patients with metaphase cytogenetic abnormalities. Blood. 2008;112:3115-3121.
[24] Jourdan M, Caraux A, De Vos J, et al. An in vitro model of differentiation of memory B cells into plasmablasts and plasma cells including detailed phenotypic and molecular characterization. Blood. 2009;114:5173-5181.
[25] Moreaux J, Hose D, Jourdan M, et al. TACI expression is associated with a mature bone marrow plasma cell signature and C-MAF overexpression in human myeloma cell lines. Haematologica. 2007;92:803-811.
[26] Assou S, Le Carrour T, Tondeur S, et al. A meta-analysis of human embryonic stem cells transcriptome integrated into a web-based expression atlas. Stem Cells. 2007;25:961-973.
[27] Reme T, Hose D, De Vos J, et al. A new method for class prediction based on signed-rank algorithms applied to Affymetrix microarray experiments. BMC
bioinformatics. 2008;9:16.
[28] Cui X, Churchill GA. Statistical tests for differential expression in cDNA microarray experiments. Genome Biol. 2003;4:210.
[29] Moreaux J, Hose D, Reme T, et al. CD200 is a new prognostic factor in multiple myeloma. Blood. 2006;108:4194-4197.
[30] Zhan F, Huang Y, Colla S, et al. The molecular classification of multiple myeloma. Blood. 2006;108:2020-2028.
[31] Condomines M, Hose D, Raynaud P, et al. Cancer/testis genes in multiple myeloma: expression patterns and prognosis value determined by microarray analysis. J Immunol. 2007;178:3307-3315.
[32] Jungbluth AA, Ely S, DiLiberto M, et al. The cancer-testis antigens CT7 (MAGE-C1) and MAGE-A3/6 are commonly expressed in multiple myeloma and correlate with plasma-cell proliferation. Blood. 2005;106:167-174.
[33] Tohami T, Drucker L, Shapiro H, Radnay J, Lishner M. Overexpression of tetraspanins affects multiple myeloma cell survival and invasive potential. FASEB J. 2007;21:691-699.
[34] Lishner M, Zismanov V, Tohami T, Tartakover-Matalon S, Elis A, Drucker L. Tetraspanins affect myeloma cell fate via Akt signaling and FoxO activation. Cell Signal. 2008;20:2309-2316.
[35] Shin JN, Piya S, Yun CW, et al. Homer1 regulates the susceptibility to TRAIL. Exp Cell Res. 2009;315:2249-2255.