Prof. W. A. Rosenblith Prof. M. A. B. Braziert Prof. M. Eden Prof. M. H. Goldstein, Jr. Prof. W. T. Peake Prof. W. M. Siebert Dr. A. E. Albert Dr. J. S. Barlowl W. A. Clark** Dr. B. G. Farley** Dr. G. L. Gerstein Dr. R. D. Hall Dr. N. Y-S. Kiangtt Dr. T. T. Sandel** Dr. D. C. Teas
Dr. Eda Berger Vidale
Dr. T. Watanabett J. A. Aldrich J. Allen R. M. Brown S. K. Burns R. R. Capranica Eleanor Chance R. J. Clayton A. CristTf T. H. Crystal J. W. Davis P. R. Gray J. L. Hall II F. T. Hambrecht J. G. Krishnayya R. G. Mark P. Mermelstein C. E. Molnar$$ Donna A. Molnar R. R. PfeiffertT Cynthia Pyle C. E. Robinson E. N. Robinson D. M. Snodderly, Jr. R. B. Stein G. Svihula Aurice V. Weiss T. F. Weiss J. R. Welch M. L. Wiederhold G. Wilde
A. EVIDENCE FOR LOCALIZED IN THE COCHLEA
RESPONSES TO ELECTRICAL STIMULATION
Woolsey and Walzl, 1 and Tunturi2 - 4 have demonstrated that responses can be evoked in the auditory cortex of cats and dogs by electrical stimulation of the cochlea. Since shocks to different regions of the spiral lamina mapped onto different regions of the cortex, their work also indicated that the electric stimuli acted on somewhat localized portions of the eighth-nerve endings. The cochlea was damaged considerably in order to place the stimulating electrodes near the nerve endings, hence it was not possible with this technique to study responses to acoustic and electrical stimulation of the same cochlea. Kiang and Peake5 demonstrated interaction of electric and acoustic stimuli in the cat, but their electrical stimulation was applied at the internal auditory meatus and there was no attempt to stimulate selectively different portions of the eighth nerve. In the work reported on here electric stimuli were delivered through fine wire elec-trodes placed in the cochleas of guinea pigs. The interaction of cortical responses to these intracochlear shocks and to acoustic stimuli was studied for different placements of the stimulating electrodes to determine whether or not the shocks were stimulating
"locally" in the cochlea.
*This work was supported in part by the National Science Foundation (Grant G-16526); and in part by the National Institutes of Health (Grant MH-04737-02).
Visiting Professor in Communication Sciences from the Brain Research Institute, University of California at Los Angeles.
SResearch Associate in Communication Sciences from the Neurophysiological Labo-ratory of the Neurology Service of the Massachusetts General Hospital.
**Staff Member, Lincoln Laboratory, M. I. T.
"Also at the Massachusetts Eye and Ear Infirmary. "tStaff Associate, Lincoln Laboratory, M.I. T.
TRIGGER FOR STIMULUS 2 TRIGGER FOR STIMULUS I CORTICAL ELECTRODE
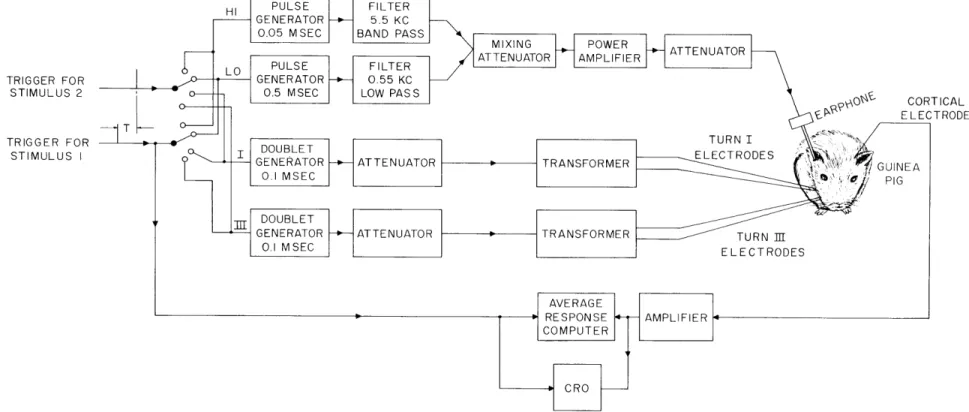
Fig. XV- 1. Schematic diagram of stimulating and recording equipment. The two trigger pulses indicated on the left were repeated at a rate of I/sec. The time delay T between the first and second pulses was variable. Each pulse triggered one of four possible stimuli. The two channels at the top, labeled HI and LO, repre-sent the acoustic stimuli; one pulse was passed through a bandpass filter cen-tered at 5.5 kc, and the other pulse was passed through a 550-cps lowpass filter. The electric stimuli were applied through isolation transformers to pairs of electrodes in turn I or turn III of the cochlea.
1. Methods
Young guinea pigs (200-350 grams) were anesthetized with Dial (50 mg/kg) or Nem-butal (30 mg/kg) administered intraperitoneally. A small hole was drilled through the
6
skull over the auditory area of the cortex. A wire electrode was inserted into the hole to make contact with the surface of the dura; the wire was cemented to the skull. Cor-tical responses were recorded between this wire and a reference electrode placed on the scalp wound. The bulla was then opened and holes were drilled in the cochlea with the aim of placing electrodes in scala tympani and scala vestibuli of turn I and/or turn III. The cochlear electrodes and their arrangement were identical with the tech-nique that has been used extensively for recording cochlear responses.? The cochlear microphonic and auditory nerve responses obtained from the intracochlear electrodes were observed in order to determine thresholds for acoustic stimuli; the polarity of the
cochlear microphonic (CM) potentials was observed to determine whether the electrodes were in the proper scalae.7 The intracochlear electrodes were then connected for elec-trical stimulation, as shown schematically in Fig. XV-1. The electric stimuli were doublets made up of two adjacent 0. l-msec pulses of opposite polarity.8 The resulting current and voltage waveforms at the electrode terminals are shown in Fig. XV-2.
The arrangement for producing the acoustic stimuli is also indicated in Fig. XV-1. Two impulsive stimulus waveforms that had different spectral compositions were
STIMULUS WAVEFORMS
EARPHONE INPUT
ELECTRIC
L O
VOLTAGE AT
ATTENUATOR
INPUT
VOLTAGE AT
HI
,ovI
ELECTRODE
TERMINALS
IMAI
ELECTRODE
CURRENT
-- IMSEC-
I
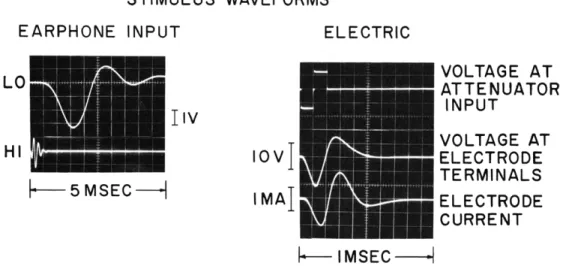
Fig. XV-2. Stimulus waveforms at 0 db. The waveforms on the left represent the input voltage to the earphone for the two acoustic stimulus con-figurations. The waveforms on the right represent waveforms associated with the electric stimulus. There is some variability in the amplitudes of the voltage and current at the electrodes for dif-ferent electrodes, so that the amplitudes shown here are only approximate for any preparation.
(XV. COMMUNICATIONS BIOPHYSICS)
generated. These were chosen with the aim of stimulating maximally in the first turn with the high-frequency stimulus (HI) and maximally in the third turn with the low-frequency stimulus (LO). The acoustic stimulus waveforms and amplitudes are shown in Fig. XV-2.
The stimuli were presented in pairs to observe the differences in the effects of various preceding stimuli on the response to the second stimulus. The time interval T
between stimuli was one of the experimental variables. The cortical responses were averaged on the ARC-1 computer.9
2. Results
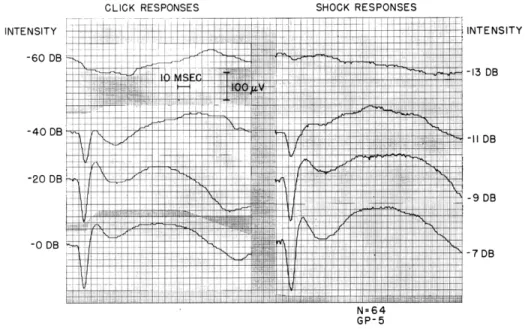
Averaged cortical responses to acoustic clicks and to shocks applied in turn I of the cochlea are illustrated in Fig. XV-3 for several stimulus intensities. These response waveforms are typical of those seen in 20 guinea pigs. The growth of the responses to clicks with increasing intensity is similar to that seen in anesthetized cats10 and guinea pigs.6 However, there seem to be some consistent differences between our cortical responses and those reported by Mark.6 (a) The surface negative (upward) deflection (peak latency, 20-35 msec) is not as large relative to the initial surface positive (down-ward) deflection in our animals. (b) The variability in the response amplitude in our
CLICK RESPONSES SHOCK RESPONSES
INTENSITY -60 DB -40 DB -20 DB -0 DB INTENSITY -13 DB -II DB -9 DB -7 DB N=64 GP-5
Fig. XV-3. Average cortical responses to acoustic clicks and to electric shocks applied through electrodes in scala tympani and scala vestibuli of turn I. Clicks were generated by applying 0.l-msec rectangular pulses to the earphone. Reference level (0 db): for the pulses, 4 volts; for the shocks, ~10 volts at the electrodes (see Fig. XV-2). Number of responses averaged, 64.
animals was greater and the absolute amplitude of the responses smaller than those found by Mark.6 Even with high-intensity stimuli (clicks or shock) that gave very large averaged responses, there were many single traces in which responses were not detect-able. There was also considerable variability in the responses recorded from the coch-lear electrodes, both in the auditory nerve components and the cochcoch-lear microphonic potentials. Spontaneous movements of the eardrum could be observed under the micro-scope. These resulted apparently from the spontaneous contractions of the middle-ear muscles which are often seen in anesthetized guinea pigs.12 The differences in behavior of the cortical responses that we obtained and those reported by Mark are probably asso-ciated with differences in level of anesthesia. We were not able to obtain the conditions that Mark describes in which withdrawal reflexes to pinches on the feet disappeared. Our animals generally gave a strong reflex to pinches anywhere on the body. Attempts
to deepen the anesthesia usually resulted in death. In several cases strong withdrawal reflexes to pinches on the feet were obtained even when the guinea pig had ceased breathing. Some animals that required artificial respiration continued to have strong withdrawal reflexes and their cortical responses were highly variable. In the few
instances in which this great variability was diminished the animal died very quickly. Hence, we conclude that the large variability in cortical responses, which results partly from action of the middle-ear muscles, is very difficult to eliminate in a live guinea pig with the drugs that we used (Dial and Nembutal).
In addition to this variability from one response to the next, we also encountered considerable variability in sensitivity of the responses. Particularly in animals in which holes had been drilled and electrodes placed in the cochlea, we often found rather large
changes in threshold for both acoustic and electrical stimulation. In some cases the threshold for electrical stimulation improved (that is, decreased) as much as 6 or 7 db,
and it often changed 1-2 db in half an hour. Acoustic thresholds usually increased some-what as the experiments progressed, but in some cases they decreased. Since there was so much individual variability in the cortical responses and in the averaged
responses, it was difficult to obtain quantitative data for a range of stimulus conditions. The data presented in this report are the most stable that were obtained. In some cases examples are given to indicate the amount of variability encountered.
Our attempts to measure all of the interactions of HI and LO acoustic stimuli with shocks to turns I and III in the same preparation were unsuccessful. The combination of drilling 4 holes in the cochlea and stimulating electrically, along with the great variability present in the cortical response, made it difficult to obtain a preparation that gave consistent responses over a time long enough to allow any systematic measurements. The data that follow represent all of the pos-sible combinations of the 4 stimuli, but with various combinations obtained in dif-ferent animals.
(XV. COMMUNICATIONS BIOPHYSICS)
a. Interaction of Shocks to Turns I and III
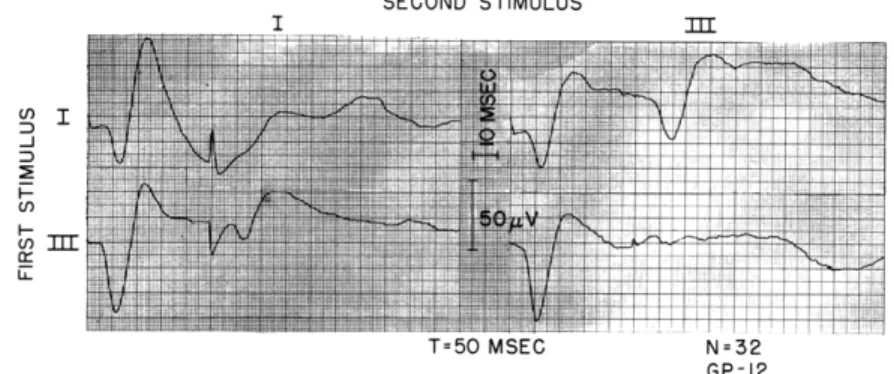
Often the acoustic thresholds became very much elevated after the placing of 4 elec-trodes in the cochlea. In these cases it was still possible to measure responses to shocks to turns I and III. Figure XV-4 illustrates averaged responses to the 4 possible pairs of these two stimuli with T = 50 msec. For this condition there is little, if any, response to the second stimulus for the pairs I-I and III-III, but the second response is prominent for the pairs I-III and III-I, in agreement with the results that Tunturi3'4
obtained with dogs. The recovery curves shown in Fig. XV-5 indicate, however, that the shocks delivered to different turns can affect each other at shorter time intervals.
The differences in interaction (between I-III and III-III combinations, for instance) are most easily observed with T between 25 and 75 msec. For this reason, most of the data presented below were taken in this range.
SECOND STIMULUS U I _1 U, I-LL I =bU MSEG N=G32 GP-12
Fig. XV-4. Interaction of shocks to turn I and Intensities same as indicated in responses averaged, 32.
to turn III. T = 50 msec.
Fig. XV-5. Number of I(100% =80 /1 V) 0 25 50 75 100 T(MSEC) 100 80 60 S(00oo% = Ioo LV) 40 - 20 / j 0 II I 150 0 25 50 75 100 150 T(MSEC') -8 FIRST STIMULUS I
A----, FIRST STIMULUS II
INTENSITIES
S- I DB = 3 DB RE VDL
GP-12
Fig. XV-5. Amplitude of response to the second stimulus vs T for shocks to turns I and III. Amplitude of responses to shocks to I are plotted on the left; to III, on the right. (In this and in Figs. XV-6 to XV-9 the response amplitudes are normalized with respect to an average of all of the amplitudes of the response to the given stimulus when it was presented first or alone.)
b. Interaction of HI and LO Acoustic Stimuli
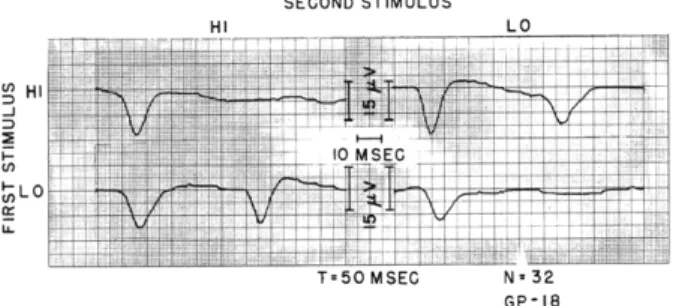
An example of the interaction of responses to the HI and LO stimuli is shown in Fig. XV-6. The stimulus intensities and the time intervals were carefully chosen so that with a repetition of the same stimulus (stimulus pair HI-HI and LO-LO) no detect-able response appears after the second stimulus, whereas with the pairs of spectrally
SECOND STIMULUS
HI LO
GP-18
Fig. XV-6. Example of the interaction of responses to the HI and LO acoustic stimuli for T = 50 msec, taken from the series plotted in Fig. XV-7a. The stimulus intensities are -10 db above the level at which a response waveform can be detected in an average of 32 responses (AVDL). Note that there is a slight difference in calibration of the vertical scales. Number of responses averaged, 32.
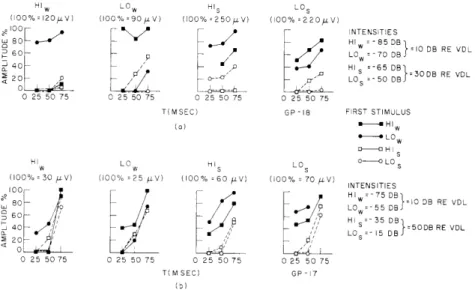
different stimuli (HI-LO and LO-HI) the response to the second stimulus is affected very little. The plots of Fig. XV-7a indicate the way in which the response amplitude for the second response depends on the interstimulus interval T and stimulus intensity; two stimulus intensities were used for each of the acoustic stimuli. The weaker stimuli
(LOw and HI ) were approximately 10 db above AVDL and the stronger stimuli (LO s and
HIs) were 20 db more intense. Averaged responses were taken for all 16 possible ordered pairs of stimuli. In each plot the amplitude of the response to one of the stim-uli (LOw, HIw , LO s, HIs) is plotted as a function of T; the first stimulus is the
param-eter. Several observations can be made from these data. (a) The low-intensity stimuli (HIw and LOw ) interact very little with each other over the range of T examined, whereas
(b) with the high-intensity stimuli (HIs and LOs) there is considerable reduction in the
amplitude of the responses to the second stimulus. (c) With respect to the reduction of the second response, an intensity difference of 20 db can (for some conditions) outweigh the difference in spectral composition of the HI and LO stimuli. For instance, the response to HIs is reduced more when it is preceded by LO s than when HIw is the first
stimulus. The conclusion to be drawn from these results obtained with acoustic stimu-lation alone is that the degree of interaction of stimuli with different spectral distribu-tions depends on the stimulus intensities; in order to obtain responses that have little interaction with each other (for example, HI and LO in Fig. XV-7a) very low
(XV. COMMUNICATIONS BIOPHYSICS)
intensities must be used.
Fig. XV-7b shows results obtained from another preparation. The stimulus levels used were 10 db and 50 db above VDL. These data are similar to those of Fig. XV-7a except that the curves indicate a tendency for more rapid recov-ery even though the strong stimuli (HIs and LOs) in Fig. XV-7b are 20 db more
HIw LO0 HI s LOS (100% 120i.V) (100% =90 V) (100% =250pV) (100% =220/V) 100 NTENSITIES HIW -85 DBr' RE VO. o60 Lo =- 70D =10 DB RE VDL 40 HI =-65 DB 20 - LO =-50 DB =30DB RE VDL 0 25 50 75 0 25 50 75 0 25 50 75 0 25 50 75
T(MSEC) GP -18 FIRST STIMULUS
(a) H HI w H-o HI I LO HIs LO o-- LOs (100% = 30 /±V) (100% :25 lV) (100% 60 iLV) (100% = 70 4 V) INTENSITIES 100 HI 7509 O80 55 D 10 DB RE VDL 80 L =- 5 DB 40 H - 5 DB =50DB RE VDL 40 LO s=15 DS 20 20 0 25 50 75 0 25 50 75 0 25 50 75 0 25 50 75 T(MSEC) GP -17 (5)
Fig. XV-7. Interaction of HI and LO stimuli at two intensity levels in two preparations. In both cases the bulla was not opened. Amplitude of the response to the second of two stimuli is plotted against the time interval T between stim-uli. The stimulus is the same for all points in any one plot. The first stimulus is the parameter in each plot. (a) Weaker stimuli HI and LO
w w
are 10 db above AVDL; stronger stimuli HI and LO are 30 db above AVDL.
s s
(b) Results from another preparation in which HI and LO = 10 db, HI
and LO s = 50 db re AVDL. w w s
intense (re threshold) than those in Fig. XV-7a. This difference in rate of recov-ery may result from a difference in the level of anesthesia in the two animals (in both cases Nembutal was used). Throughout the period in which the data for Fig. XV-7b were taken the guinea pig reacted to pinches on the feet with strong quick withdrawal reflexes. Also, there was a good deal of shivering, and the cortical responses were quite variable. (This "lightly anesthetized" state was typical of that obtained in most of our preparations.) In the case illustrated in Fig. XV-7a, the animal showed rather slow and weak reflexes to pinches on the feet and the variability in the individual responses was much less than that for the animal in Fig. XV-7b. Slower recovery of responsiveness in more deeply anesthetized animals has been previously reported by several other workers.11
(XV. COMMUNICATIONS BIOPHYSICS)
c. Interaction with Shocks to Turn I
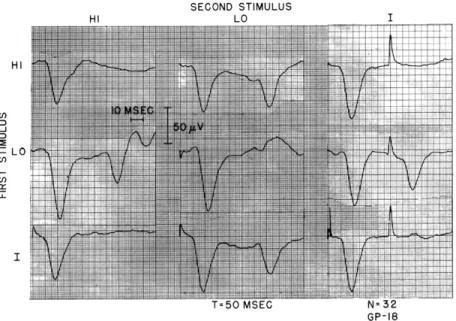
Figure XV-8 shows examples of interactions obtained between HI and LO acoustic stimuli, and shocks applied between scala tympani and scala vestibuli of turn I. For the low-intensity stimuli used, a repetition of the same stimulus (HI-HI, LO-LO or I-I) produces very little response to the second stimulus. This also occurs when shock and the high-frequency stimulus are paired (HI-I or I-HI). However, the second responses are only moderately reduced when I and LO are paired.
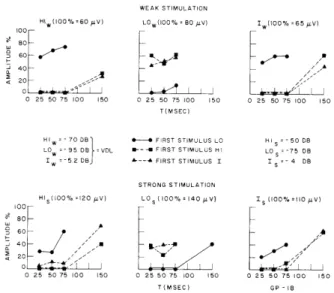
The plots of Fig. XV-9 illustrate the interaction of these stimuli as a function of T for two sets of stimulus intensities. For the upper set, all of the stimuli are near VDL; for the lower set, the acoustic stimuli are 20 db above VDL, and the electric stimulus is 1.2 db above VDL. The stimulus intensities in any one set were chosen to give roughly the same response amplitudes to HI, LO, and shock. In all of the plots illustrated in Fig. XV-9 there is a striking similarity in the recovery curves following the HI and I stimuli, and a distinct difference between these curves and those following the LO stim-uli. This similarity suggests that similar neural populations are being stimulated by the HI and I stimuli.
The data of Figs. XV-8 and XV-9 are among the most clear-cut obtained in our studies, probably as a result of the state of the preparation when these data were
SECOND STIMULUS HI LO LO HI IJ I GP-18
Fig. XV-8. Interaction of responses to the HI and LO acoustic stimuli and shocks to turn I for T = 50 msec. All of the stimulus intensities
are approximately VDL. The guinea pig was being given artificial respiration and was probably in a moribund state when these data were taken. Number of responses averaged, 32.
(XV. COMMUNICATIONS BIOPHYSICS)
WEAK STIMULATION
HIW(100%=60 LV) LOw(100%= BO 4V) Iw(o0% =65 IV)
100 80 60- /a 40 20 , 0 25 50 75 100 150 0 25 50 75 100 150 0 25 50 75 100 150 T(MSEC) HI = 70 0B FIRST STIMULUS LO HI S 50 DB
LOw =95 DB -VDL --- FIRST STIMULUS HI LO S 75 08
I = - 5
2 DB A-- FIRST STIMULUS I I S = - 4 DB STRONG STIMULATION HIs(00% =120 (V) L0 5 (100% 140 V) Is (100% I 10 /V) 100 80 60 -40- U *x
/
0 25 50 75 100 150 0 25 50 75 100 150 0 25 50 75 100 150 T(MSEC) GP -18Fig. XV-9. Response amplitude for second stimulus vs T. As in Fig. XV-5, each plot gives amplitudes of responses to the stimulus indicated at the top of the plot.
obtained. There were several indications that the animal was in a moribund condition. (a) Artificial respiration was required. (b) No withdrawal reflexes could be detected. (c) The background activity from the cortical electrode was very low. (d) The cortical responses had a somewhat unusual waveform; the latencies were somewhat longer and the duration of the surface positive deflection was larger than those observed earlier from the same preparation. However,, responses from the cochlear electrodes indicated that the ear was still quite sensitive to acoustic stimuli.
d. Interaction with Shocks to Turn III
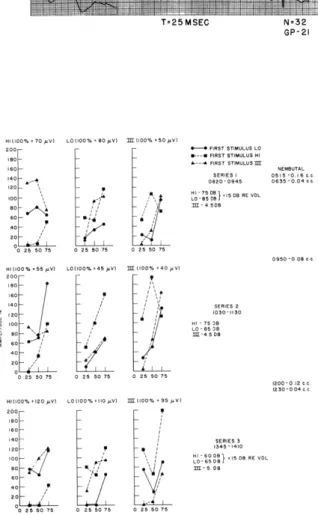
Figure XV-10 shows examples of interactions of responses to the HI and LO acoustic stimuli (both approximately 5 db above VDL) and shocks applied between scala tympani and scala vestibuli of turn III. These data were taken from an animal that was in the usual "lightly anesthetized" state, and the responses were extremely variable, as shown by the rather wide variations in the averaged responses to the first stimulus of a pair. In spite of this variability, these records clearly show that the LO acoustic stimulus interacts more with the turn III shock than the HI stimulus does. Figure XV-11 con-sists of plots of the response amplitude vs T which were obtained from another animal that was also in a lightly anesthetized state. The complete series was run 3 times on the same preparation. Between recording sessions the guinea pig was given additional anesthesia (Nembutal) with the hope that the variability might be reduced. There were, however, no signs that the animal ever went into a more deeply anesthetized state. In spite of the variability, the data generally indicate a much stronger interaction of LO
SECOND STIMULUS
HI LO II
Fig. XV-10 HI
Interaction of responses to the HI and LO acoustic stimuli and shocks
LO to turn III for T = 25 msec. Acoustic
Sstimuli, approximately 5 db above
LL AVDL (both at -90 db); shock
inten-m sity, -5 db. Number of responses
averaged, 32. T=25MSEC N=32 GP-21 Fig. XV-11 HI(100% = 70 0V1 LO (100io%O 80 V) (100% 50 V 0 200 - FIRST STIMULUS LO
60-" FIRST STIMULUS .M Interaction of the HI and LO acoustic
. 800-0945 635 -0:04 stimuli with a shock in turn III. In this
Hoo .15 508 RE VDL preparation three series of data were
.o 458 taken; additional anesthesia was given
4 between the series. The times of the
07 series and times and doses of anesthesia
50 75 25 50 75o are indicated. The intensities of the
1100% .. Looo.45 ... ) oo..40
pVI
stimuli were the same in series 1 and 2, S0 - ,. but they were increased in series 3 ino - I SERIES 2 order to maintain the response
magni-S 10oI 5 O tudes at a reasonable level. From all
:L , So1:. signs, the animal was lightly
anesthe-40 tized throughout all of these series, and
02 i there was a great deal of variability in
25 50 75 25 55 the size of the averaged responses. In
HI(100..20pV L0(I00% ...0pY) .00 95p V) several cases the control response
am-0- - plitudes varied over a range of ±50 per
10 0. - ....41 tions, it was necessary to normalize each
oo 1
I-
-6); O I15DBRE VDL point with respect to the amplitude of thes S single averaged response taken
imme-20- diately before or after, rather than
aver-002575 02575 aging over all of the control response
M.SEC) GP-O22 amplitudes. Amplitudes plotted are the
(XV. COMMUNICATIONS BIOPHYSICS)
and III than of HI and III, or HI and LO, although there are a few data points that contradict this statement.
3. Conclusions
We feel that, in spite of the difficulties encountered, these data clearly indicate that it is possible for electric stimuli to act locally in the cochlea. Since this technique leaves the cochlea relatively intact, it is possible to study interactions of electric and acoustic stimuli. However, to answer more quantitative questions about this kind of stimulation (for example, how broad a section of the cochlea is stimulated?) the prob-lem posed by the extreme variability must be solved. Two possibilities for improving the situation can be suggested. (i) The peculiar behavior of guinea pigs under anes-thesia seems to be characteristic of the species. Perhaps another animal that also has its cochlea placed so that intracochlear electrodes can be inserted relatively easily would help with this problem. We have worked with chinchillas and they seem to be promising. (ii) If a technique could be developed for reducing the shock artefact in the recording channels so that the auditory nerve responses could be measured, interpre-tation of the action of the electric stimulus would be greatly simplified.
W. T. Peake, D. C. Teas, R. R. Capranica References
1. C. N. Woolsey and E. M. Walzl, Topical projection of nerve fibers from local regions of the cochlea to the cerebral cortex of the cat, Bull. Johns Hopkins Hospital 71, 315-344 (1942).
2. A. R. Tunturi, Audio frequency localization in the acoustic cortex of the dog, Am. J. Physiol. 141, 397-405 (1944).
3. A. R. Tunturi, Further afferent connections to the acoustic cortex of the dog, Am. J. Physiol. 144, 389-394 (1945).
4. A. R. Tunturi, A study of the pathway from the medial geniculate body to the acoustic cortex in the dog, Am. J. Physiol. 147, 311-319 (1946).
5. N. Y-S. Kiang and W. T. Peake, Studies of the auditory nervous system by using combined acoustic and electric stimulation, Quarterly Progress Report, Research Laboratory of Electronics, January 15, 1958, pp. 124-128.
6. R. G. Mark, Cortical Responses to Auditory Stimuli in the Guinea Pig, S. B. Thesis, Department of Electrical Engineering, M. I. T., 1960.
7. I. Tasaki, H. Davis, and J. Legouix, The space-time pattern of the cochlear microphonics (guinea pig) as recorded by differential electrodes, J. Acoust. Soc. Am. 24, 502-5 19 (1952).
8. J. C. Lilly, Jr., J. R. Hughes, E. C. Aloord, and T. W. Galkin, Brief non-injurious electric waveform for stimulation of the brain, Science 121, 468-469 (1955).
9. W. A. Clark, R. M. Brown, M. H. Goldstein, Jr., C. E. Molnar, D. F. O'Brien, and H. E. Zieman, The average response computer (ARC): A digital device for com-puting averages and amplitude and time histograms of electrophysiological responses,
10. W. A. Rosenblith, Some electrical responses from the auditory nervous sys-tem, Proc. Symposium on Information Networks, edited by J. Fox, (Polytechnic Insti-tute of Brooklyn, New York, 1955), pp. 223-247.
11. M. R. Rosenzweig and W. A. Rosenblith, Responses to auditory stimuli at the cochlea and at the auditory cortex, Psych. Monogr., Vol. 67, pp. 1-20, 1953.
12. H. Wiggers, The functions of the intra-aural muscles, Am. J. Physiol. 120,
77 1-780 (1937).
B. ERRATA
In Quarterly Progress Report No. 66 (pages 306-315), in the report entitled "Some Response Characteristics of Single Units in the Cochlear Nucleus to Tone-Burst Stimu-lation," the last sentence of paragraph one, page 306, should read:
"In particular, for a majority of the units studied, the responses to tone-burst stim-ulation exhibit preferred times of firing relative to the onset of the stimulus time."
The first sentence of paragraph two, page 306, should read:
"Figure XIX-5 shows PST2 histograms for eight different units in response to tone bursts."
The fourth sentence of paragraph six, page 314, should read:
"The interpeak interval and the latency decrease monotonically with increases in stimulus intensity, and increase monotonically with increases in stimulus duration or stimulus repetition rate."