Publisher’s version / Version de l'éditeur:
Journal of ASTM International, 4, Nov/Dec. 10, pp. 1-15, 2007-11-01
READ THESE TERMS AND CONDITIONS CAREFULLY BEFORE USING THIS WEBSITE.
https://nrc-publications.canada.ca/eng/copyright
Vous avez des questions? Nous pouvons vous aider. Pour communiquer directement avec un auteur, consultez la
première page de la revue dans laquelle son article a été publié afin de trouver ses coordonnées. Si vous n’arrivez pas à les repérer, communiquez avec nous à [email protected].
Questions? Contact the NRC Publications Archive team at
[email protected]. If you wish to email the authors directly, please see the first page of the publication for their contact information.
Archives des publications du CNRC
This publication could be one of several versions: author’s original, accepted manuscript or the publisher’s version. / La version de cette publication peut être l’une des suivantes : la version prépublication de l’auteur, la version acceptée du manuscrit ou la version de l’éditeur.
For the publisher’s version, please access the DOI link below./ Pour consulter la version de l’éditeur, utilisez le lien DOI ci-dessous.
https://doi.org/10.1520/JAI101027
Access and use of this website and the material on it are subject to the Terms and Conditions set forth at
Pilot study on wind uplift resistance of adhesive applied low slope roofing systems
Baskaran, B. A.; Murty, B.; Tanaka, H.
https://publications-cnrc.canada.ca/fra/droits
L’accès à ce site Web et l’utilisation de son contenu sont assujettis aux conditions présentées dans le site LISEZ CES CONDITIONS ATTENTIVEMENT AVANT D’UTILISER CE SITE WEB.
NRC Publications Record / Notice d'Archives des publications de CNRC:
https://nrc-publications.canada.ca/eng/view/object/?id=50c01240-a338-4553-ab10-2ee902c2753f https://publications-cnrc.canada.ca/fra/voir/objet/?id=50c01240-a338-4553-ab10-2ee902c2753f
P i l o t s t u d y o n w i n d u p l i f t r e s i s t a n c e o f
a d h e s i v e a p p l i e d l o w s l o p e r o o f i n g s y s t e m s
N R C C - 5 0 0 5 5
B a s k a r a n , B . A . ; M u r t y , B . ; T a n a k a , H .
A version of this document is published in / Une version de ce document se trouve dans:
Journal of ASTM International, v. 4, no. 10, Nov/Dec. 2007, pp. 1-15 doi:
10.1520/ JAI 101027
The material in this document is covered by the provisions of the Copyright Act, by Canadian laws, policies, regulations and international agreements. Such provisions serve to identify the information source and, in specific instances, to prohibit reproduction of materials without written permission. For more information visit http://laws.justice.gc.ca/en/showtdm/cs/C-42
Les renseignements dans ce document sont protégés par la Loi sur le droit d'auteur, par les lois, les politiques et les règlements du Canada et des accords internationaux. Ces dispositions permettent d'identifier la source de l'information et, dans certains cas, d'interdire la copie de documents sans permission écrite. Pour obtenir de plus amples renseignements : http://lois.justice.gc.ca/fr/showtdm/cs/C-42
Pilot Study on Wind Uplift Resistance of Adhesive Applied Low Slope Roofing
Systems
Bas A. Baskaran Ph.D, P.Eng1*, Bona Murty, M.Eng2 and Hiroshi Tanaka Ph.D P.Eng3 1
Group Leader, National Research Council, 1200 Montreal Road, Ottawa, ON, Canada, K1A OR6 2
PhD Student and 3 Professor, Department of Civil Engineering, University of Ottawa, Ottawa, ON, Canada, K1N 6N5
Abstract
A new generation of Built-Up Roofs, known as Adhesive Applied Roofing Systems (AARS), is gaining popularity in North America for low slope application. AARS use no fasteners for components attachment and all components (e.g., insulation board, cover board and membranes) are integrated by application of adhesives. Since there are no metal fasteners, AARS can offer advantages of reduction in moisture migration and thermal bridging. Moisture in the roof envelope can lead generally to material deterioration, structural integrity problems, and the growth of mould. Even though AARS are in commercial use, there is no existing test standard to quantify their wind uplift performance. A new project, “Development of Wind Uplift Standard
for Adhesive Applied Low Slope Roofing Systems”, has been initiated in collaboration with
industries, university and the Canadian Government. The project has three major tasks: experimental investigation, formulation of a numerical model and development of wind design guide and standard. Task 1 completes preliminary investigations by constructing eight mockups. All mockups had steel deck and polyisocyanurate insulation and varied in adhesives (type, quantity and application method), cover boards and membranes. Mockups were subjected to both static and dynamic wind loading conditions. Experimental data showed similarity in failure modes and variations in wind uplift ratings. Data show that among the mockups, the weakest link varied depending on the type of adhesives used and component arrangements. This paper presents and discusses the data from this ongoing experimental investigation.
Keywords: Adhesive, Steel Deck, Vapour Barrier (Retarder), Insulation Board, Cover Board, Base Sheet and Cap Sheet, Pressure, Failure, Wind Uplift Resistance
Introduction
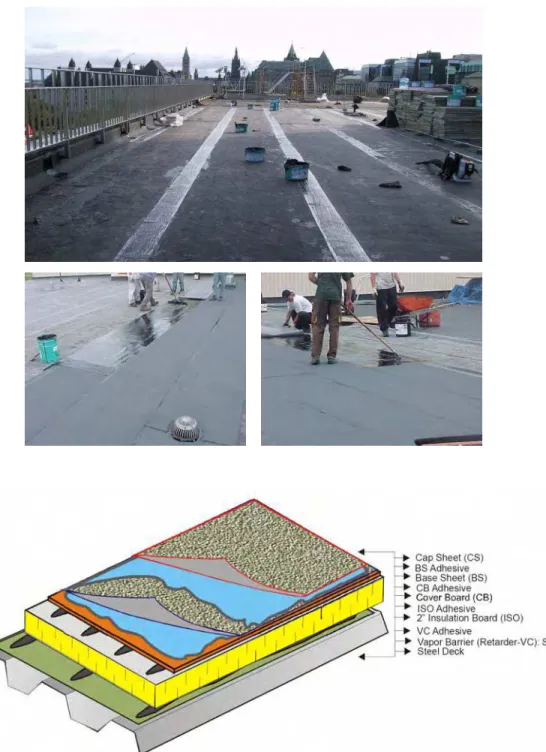
In a conventional roof assembly, the waterproofing components, namely the roof membranes, are placed above the insulation and exposed to the environmental forces such as wind and rain. When components are fixed using fasteners to form a system, it can be classified as Mechanically Attached Roofing Systems (MARS). As an alternative to the MARS, Adhesive Applied Roofing Systems (AARS) are gaining popularity in the North America. AARS are a new generation of built-up roofs that use adhesives to integrate all components such as insulation board, cover board and membranes to form a compact roof system. Figure 1 illustrates a typical isometric diagram and field photographs of AARS with modified bituminous membrane as the roof cover
Figure 1. Field Photographs and Typical Isometric Diagram of AARS
AARS offer several advantages compared to that of MARS (Table 1). Since metal fasteners are not used in the system, thermal bridging and moisture migration can be minimized. In any building envelope, moisture can lead to material deterioration, structural integrity problems, and excessive mould growth. The existence of the moisture travel path, such as fastener holes, is critical for moisture transport into the building envelope. Studies carried out by Hens et al. (1995) explain the mechanism of moisture development phenomena. AARS can also eliminate corrosion problems that occur on metal fasteners in the MARS, which may cause premature roof failure. Thereby, this creates a serious concern for the entire roofing industry (Phalen, 1993). Other than those aforementioned advantages, AARS also offer less thermal bridging and air leakage problems compared to that of MARS. Thermal bridging problem in the MARS is caused by the fasteners, if they are made from metal (generally carbon or nickel steel) that has the coefficient of thermal conductivity, k, in the order of 40 W/m K. This k coefficient is about 1300
times larger than the k value of the insulating medium. Therefore, with this high conductivity, fasteners possess the ability to short-circuit the heat flow and influence of the thermal resistance of the insulation (Phalen, 1993). When the MARS are subjected to wind pressures, there is a greater chance of air intrusion into the assembly. This is because the MARS components are solely integrated in places by localized fasteners, while the AARS components are adhered together using adhesive. AARS are not free from disadvantages such as labour intensive (a quality assurance and quality control during AARS application), slippage (e.g. Adhesive can soften at elevated temperature), UV sensitive (surface protection is required) and relatively longer curing time (most of manufactures recommends a minimum of 21 days) compared to that of MARS. Table 1 compares the advantages and disadvantages of AARS and MARS.
Table 1. AARS and MARS – Advantages and Disadvantages
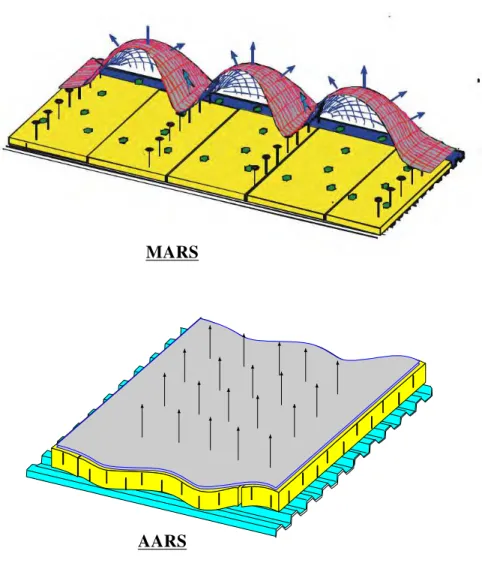
AARS and MARS respond differently in the presence of wind uplift forces. The AARS wind uplift performance can be classified as phonemic load transfer in which all components unite together and share the wind uplift forces. For the MARS, the performance can be classified as structural load transfer or linear load path in which most of membrane tensions are transferred to the structural deck through fasteners. Figure 2 shows a force dissipation diagram between AARS and MARS. In the AARS, wind loads are distributed over a roof area. As results of this response variation, one should apply different methodology to determine the wind uplift resistance. For the case of the MARS, design resistances can differ between field, edge and corner zones of a roof area.
Although AARS have been commercially in use in the North American roofing market, there is no existing test standard to quantify their wind uplift resistance performance. Advancement of adhesives technology also favours the AARS market. These advancements warrant a need for wind uplift resistance evaluation. Therefore, a collaborative research project for a comprehensive study of the AARS wind uplift resistance performance is currently in progress at the National Research Council of Canada (NRC). This is a joint project with NSERC (Natural Sciences and Engineering Research Council) that involves NRC, University of Ottawa, Roofing Manufacturers and Contractors. The main objective of the research is to establish an acceptable wind uplift standard for the AARS. To achieve this objective, the following tasks have been identified:
• TASK 1: Experimental investigation
• TASK 2: Formulation of a numerical model using finite element analysis • TASK 3: Development of wind design guide and standard
This paper presents preliminary experimental observations, including mock-up preparations; experimental set-up and installation, test method as well as static and dynamic wind uplift resistance data.
Experimental Set-Up
Mock Up Preparation and Installation
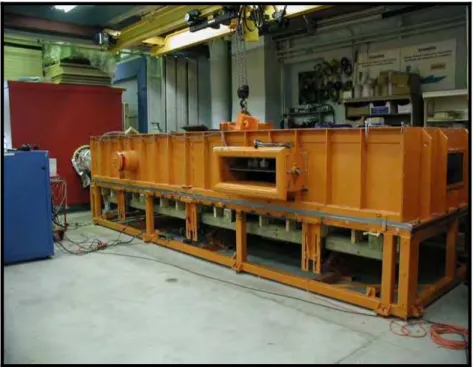
Mocks up were prepared at the Dynamic Roofing Facility (DRF) at the NRC. DRF consists of a bottom frame of adjustable height upon which the roof specimens are installed and a removable top chamber (Figure 3). The design allows for the installation and study of roof assemblies of different thicknesses up to 500 mm (18 in) as well as the evaluation of sloped roofs. The bottom
frame and top chamber are 6100 mm (240 in) long and 2200 mm (86 in) wide and 800 mm (32 in) high. The top chamber is equipped with six windows for allowing visual mockup inspection, and a gust simulator, which consists of a flap valve connected to a stepping motor through a timing belt arrangement. A 37 kW (50 HP) fan with a flow rate of 2500 L/s (5300 cfm) produces pressure suction as high as 10 kPa (209 psf) over the roof assembly. A computer, using feedback signals, controls the operation of the DRF. The computer regulates the fan speed in order to maintain the required pressure level in the chamber. Operation of the flap valve simulates gusting in the form of uniform cyclic pressure loading over the surface of the roofing system. Closing the flap valve allows pressure to build in the chamber, while opening the valve bleeds the pressure. Also, the test facility has instrumentation for measuring the dynamic response for the specimen. More information of the DRF features is outlined in Baskaran et al. (1997).
Figure 3. Dynamic Roofing Facility
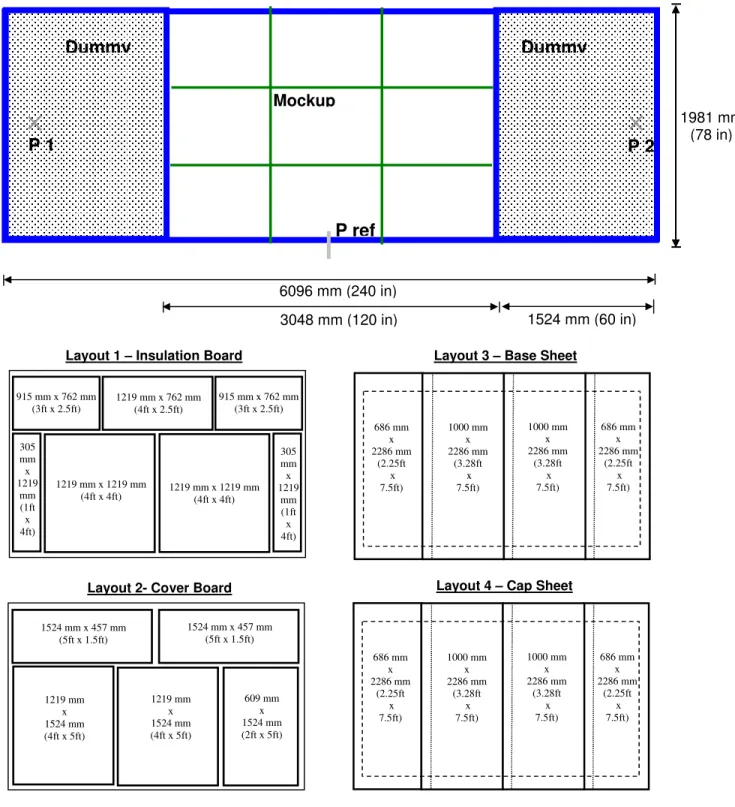
Mock-ups were 1981 mm x 3048 mm (78 in x 120 in) in size and were placed in the centre of the DRF bottom frame (Figure 4). Since the length of the testing table was two times that of the mockup length, two dummies, with the size of 1981 mm x 1524 mm (78 in x 60 in), were fabricated and located on both sides of the table as illustrated in the top diagram of the Figure 4. The top surface of the mockup was divided into nine segments of equal area with an approximate size of 660 mm x 1016 mm (26 in x 40 in) for each segment. These divisions were made to identify failure location during testing. There are four major components that comprise the AARS. They are vapour barrier (retarder), insulation board, cover board and membranes. The membrane consists of a base sheet and a cap sheet. Layout 1 shows the arrangement of the insulation boards for the mockup. The dimension of the insulation board is 1219 mm x 1219 mm (48 in x 48 in) with the 51 mm (2 in) thickness. As shown in layout 1, insulation boards were cut
and arranged accordingly to fit into the mockup size. This layout was chosen to create staggered positions when combined with other AARS components. The same concept was also applied to the cover boards, which have a size of 1219 mm x 1524 mm (48 in x 60 in) and were arranged as shown in layout 2. Base and cap sheets were bonded as shown in layout 3 and layout 4 respectively. The base and cap sheets have the same width, which is 1001 mm (39.4 in). They were laid overlapping each other. The size of the overlapping is about 76 mm (3 in). A 152 mm (6 in) overhang condition in all directions of the mockup size was maintained as shown in layout 3 and 4. The thicker dashed lines in layout 3 and layout 4 identify the mockup size. This effort was made for preventing air leakage on the mockup sample during testing.
Figure 4. Mockup and Component System Layouts on the DRF Table
In total, eight mockups were constructed from four different sources, which represent four different roofing manufacturers. Each source used its own application methodology for constructing two mock-ups that were tested under static and dynamic loading conditions. As a preliminary experimental study, the authors would study all possibilities that might affect the wind uplift performance of the AARS due to variation in the application methodology from one source to another. This was the reason why the authors did not consider uniformity at this stage in the mock-up construction process and components used.
Figure 5 shows step-by-step mock-up preparation and construction. Steel decks were profiled as 22-gauge with nominal thickness of 0.76 mm (0.03 in), overall depth of 38 mm (1.5 in) and 914 mm (36 in) in width and cut to 3048 mm (120 in) length as shown in the top left corner photo. Two full sheets and one quarter of the third sheet of the steel deck were used. Sheets were attached to the metal joists using deck screws with a span of 1829 mm (72 in). At the deck level, primer and / or adhesive were applied to attach the vapour barrier (retarder) to the steel deck as
shown in the top right hand corner photo. In general, the adhesive application follows either ribbon format or full coverage format. In the ribbon method, adhesives were applied with a distance of about 305 mm (12 in) from center of one adhesive line to another adhesive line. Full coat means that the adhesives were uniformly spread over the surface. Insulation boards used were polyisocyanurate (ISO) with paper facer. Once ISO boards were adhered, the cover board and membranes (base and cap sheet) were also laid in sequence to form the mockup as explained previously (Figure 4). These components layouts arrangements were also established to reflect the field application. Table 2 summarizes the roofing component configurations and methodologies that were used by the different sources. After completion of the mockup construction, the mockups were allowed to cure for 21 days prior to testing in the storage room conditions (200C ± 3, 65% RH).
Figure 5. Mockup Preparation and Installation
Table 2. Mock-Up Configurations
To minimize any externally induced stresses, mockups were transported using crane and placed at the DRF. A portable hydraulic jack was also used to accommodate the mockup samples with the DRF edges. To quantify the system response, three pressure taps were used, one installed on each dummy panel and another attached on the chamber as reference pressure. Once the mockup was in place, the top chamber of the DRF was closed as shown in right bottom photo of the Figure 5, indicating that the mockup was ready for testing.
Load Cycles
The AARS wind uplift performances were evaluated under two different loading environments: static and dynamic. The static and dynamic tests were conducted according to the FM (4470-2005) and CSA (123.21-04) test methods respectively. The same size of mockup, 1981mm x 3048 mm (78 in x 120 in), was used for both test methods. Summary of these tests protocols are presented below.
Static Test Method
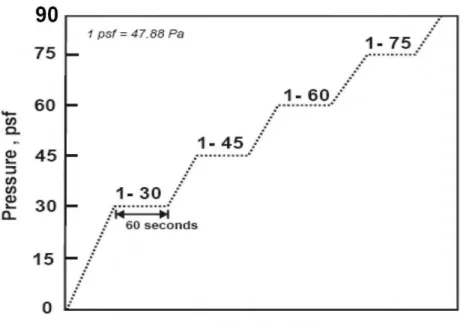
In the static load cycle, an initial pressure of 1.44 kPa (30 psf) was applied and maintained for 60 seconds (Figure 6). The pressure was then increased at the rate of 0.72 kPa (15 psf) per minute until failure of the test mockup occurred. Four mockups were tested in accordance with this method. The static classification was established when the mock up successfully reached a certain pressure level and being maintained for 60 seconds in that particular level. The static load cycle is simple and takes minimal amount of time to complete an evaluation. However, the static procedure differs significantly from wind-induced pressures on roofs.
Figure 6. Static Load Cycle
Dynamic Test Method
The dynamic loading condition was created through the operation of the flap valve on the DRF chamber, which simulated gusting in the form of uniform cyclic pressure loading over the mockup. A summary of the load cycle is as follows:
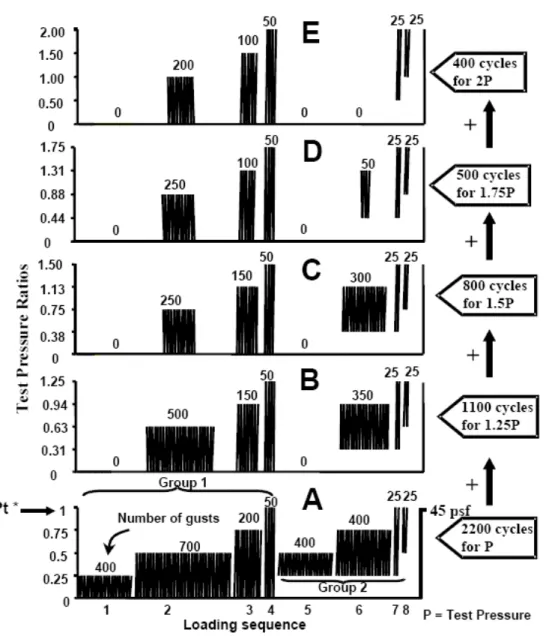
• As shown in Figure 7, the CSA dynamic protocol has five rating levels (A to E). To evaluate a roof assembly for a specific wind resistance, all the gusts corresponding to Level A should be applied.
• Each level consists of eight load sequences with different pressure ranges, depicted in Figure 7. The eight load sequences are divided into two groups. Group 1 represents wind-induced suction over a roof assembly. It consists of four sequences, where the pressure level alternates between zero and a fixed pressure. Group 2 represents the effects of exterior wind fluctuations combined with a constant interior pressure on a building. Internal pressure variations are explicitly codified in the recent North American wind standards (ASCE 7-2004, NBCC 2005). The CSA test protocol accounts for such variations. (Baskaran et al. 1999a)
• The test pressure ratios (y-axis) can be calculated from the design pressure, in accordance with local building codes or wind standards. The pressures for each load sequence are calculated as percentages of the test pressure. For the present study a target pressure (Pt) of either 2.15 kPa (45 psf) or 1.44 kPa (30 psf) was selected
• To evaluate the ultimate strength of the roofing assembly, testing should be started at Level A and should be continued when moving from one level to another. To obtain a rating, all specified numbers of gusts in each level must be completed without any resistance link failure.
Figure 7. Dynamic Wind Load Cycle
Failure Criteria
As illustrated in Figure 2, there are differences in the response between AARS and MARS in term of wind uplift, so as the failure modes. For example, in the MARS ballooning of the membrane is an allowable performance and it is not considered as a sign of system failure. However, for this present study, deciding at what level the mockup has failed is a major
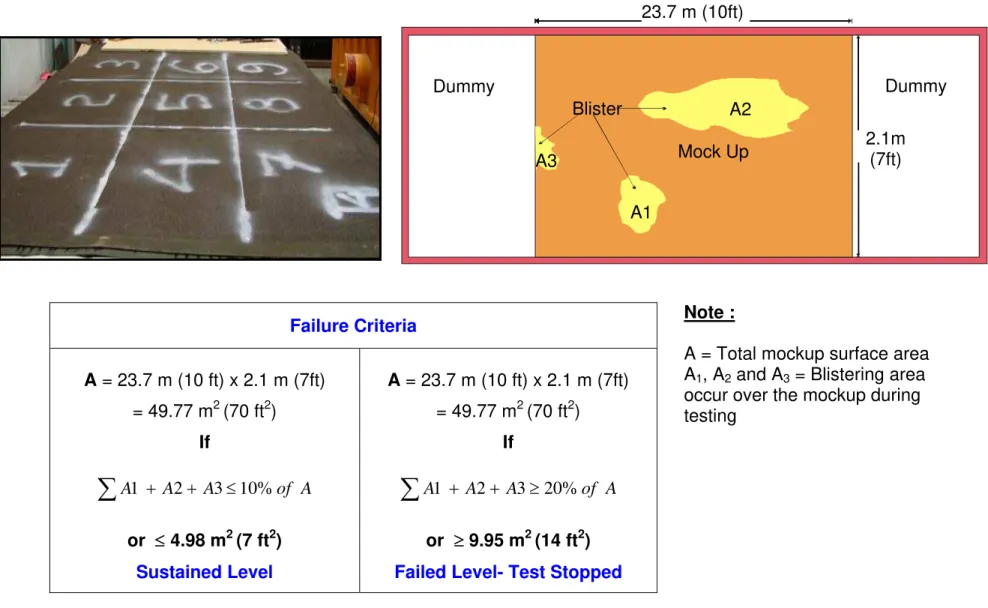
challenge. During the MARS wind testing, a DRF operator observes the system’s failure. This occurs when fasteners pull out from the deck or seam delamination and /or membrane tearing. For AARS, it is rather difficult because the failure is mostly obscure and progressive and does not follow a certain pattern or does not happen at a discrete location. In order to maintain a consistency of failure determination, a failure criterion was developed and used in this study that was agreed by all involved parties. The failure criterion was determined based on the same operator by estimating the percentage of the blistering area to the total mockup surface area. Figure 8 describes how the failure criterion of the AARS is determined. As mentioned in experimental set-up section that nine equal segments were created on mock-up surface before testing by using color marker to better estimate the percentage of the blistering area (Figure 4) so later if the total blistering observes to be equal to about the size of one segment it is measured about 10% of the total surface area (A). For example, let us consider three blisters occur and their areas are labelled as: A1, A2 and A3. Then the summation of the blistering area is
(A1+A2+A3). When the ratio of the (A1+A2+A3) over A equals to or exceeds 10% then the
corresponding pressure level is classified as “Sustained wind uplift rating”. The sustained pressure is recorded and the test is continued. The system is considered failed and the test is stopped when the (A1+A2+A3) over A equals to or exceeds 20%.
Note that the number of blister occurrences on a mockup does not affect the failure criteria rather the summation of blister area is critical. It means that the blister numbers can vary among the mockups. For the present study, the 10% blistering area was observed in one or several locations depending on the mockups. As this present study failure criterion is based on observation, the same operator monitored all mockups performances during the testing. It is emphasized that the AARS failure criteria used in this study are subject to discussion by the involved parties of the
research project. Further research investigation is needed to determine a suitable failure criterion for the AARS.
Figure 8. Failure Criteria Used During AARS Wind Testing
Results and Discussions
Wind Uplift Resistance under Static Loading Condition
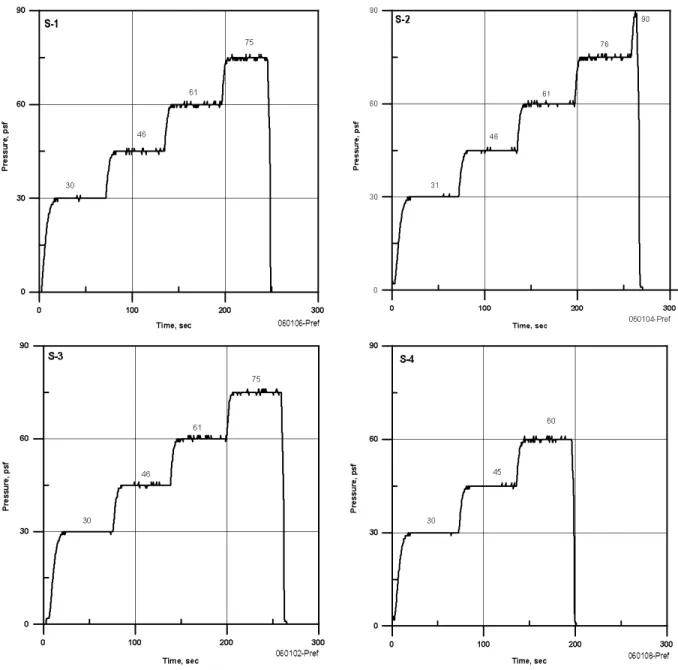
Figure 9 shows pressure time histories for the four mockups tested under static loading. The Y-axis gives pressure values that are achieved by the respective mockups as function of time (X-axis). S-1 and S-3 successfully sustained 2.87 kPa (60 psf) and failed at 3.59 kPa (75 psf). S-2 achieved the highest wind uplift resistance rating under static loading as 3.59 kPa (75 psf), while the lowest pressure rating achieved was 2.15 kPa (45 psf) by S-4. The pressures in the graphs are called as reference pressure (Pref) that was measured using pressure tap located in the middle of the DRF top chamber (Figure 4). Other two measured pressures (P1 and P2) located at the dummies are having the same reading that acts as control pressure to the Pref.
Figure 9. Static Pressure Time Histories
Wind Uplift Resistance under Dynamic Loading Condition
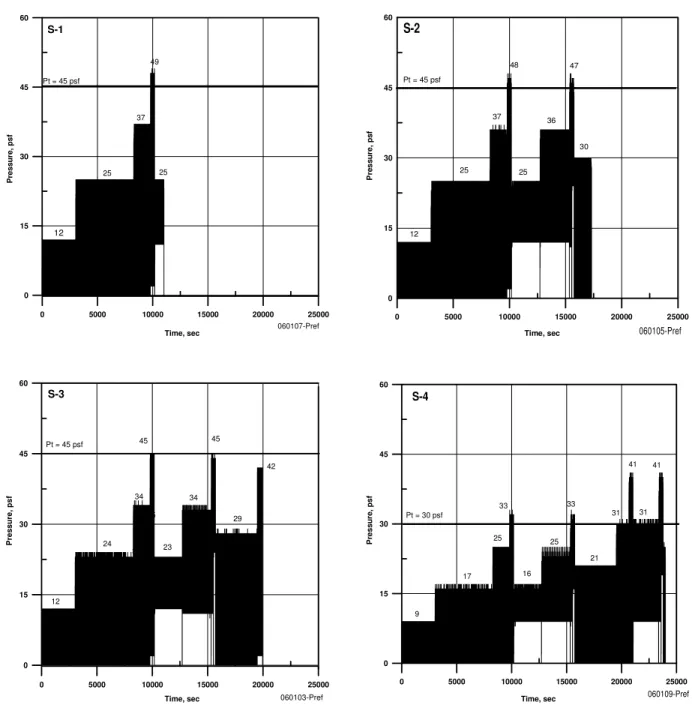
Four graphs of dynamic pressure time history were plotted in Figure 10. The Y-axis in the graph shows dynamic wind uplift resistance pressure for the corresponding time on the X-axis. As in static, the Y-axis pressures show only the dynamic reference pressure (Pref) from the test. The dynamic classification in accordance with CSA A123.24 standard is different from the static classification. For dynamic classification (refers to Figure 7), mock-up tested should complete all eight sequences of Level A. If failures were noticed before completing all sequences in the Level A, then no classification is assigned. This was experienced by S-1 as shown in Figure 10.
However it can be mentioned that S-1 failed at Level A, sequence 5. Both S-2 and S-3 were classified as sustained 2.15 kPa (45 psf) and failed at Level B, sequence 2 and sequence 3 respectively. Based on the S-1 performance which has no rating in term of dynamic test because it was failed before completing level A, a lower test pressure of 1.44 kPa (30 psf) was selected for the evaluation of 4. Note that the Y-axis values vary based on the selected test pressure. S-4 passed all necessary sequences of Level A and Level B. This indicates that the S-S-4 was sustained 1.82 kPa (38 psf) and failed at Level C sequence 2.
Figure 10. Dynamic Pressure Time Histories
Performance of Static VS Dynamic Loading
Comparisons of the static wind uplift ratings with that of dynamic wind uplift ratings indicate that the static test overestimates the wind uplift ratings. This is due to the fact that the static test does not simulate the actual wind uplift forces over the roof assembly. The dynamic test induces the necessary wind fatigue on the system through gust variations in the load cycle (Baskaran et al. 1999b). Similar observation have also been noticed during the comparative studies of MARS (Baskaran and Smith, 2005).
Figure 11 shows typical failure investigation steps. During the testing, the mockup was closely observed to identify the failure location. In order to achieve this, the mockup top surface was divided into nine segments of equal squares through colour marking. The approximate size of each segment was 660 mm x 1016 mm (26 in x 40 in). Note that the total mockup area was 1981 mm x 3048 mm (78 in x 120 in). The nine segments drawn over the mockup surface help the examiner (DRF operator) to observe failure criteria determination. Once the 20% failure criterion was observed, the test was stopped and the top chamber was removed as shown in
Figure 11. The test cut was made at the observed failure location to identify the weakest link on the system. For the mockup shown in Figure 11, the system failed due to adhesive failure between the base sheet and the cover board. This has been classified as failure #1. Further deep cuts were made up to steel deck level to verify the integration of other components. If a failure is noted then it is labeled as failure # 2. Note that by doing so, it does not mean that failure #1 has occurred before failure #2. In other words, it only showed the sequence of failure investigation. During the AARS failure investigation, authors had difficultly in isolating which component failed first. This challenge can be addressed at a future stage of this ongoing research.
Figure 11. Mockups Typical Failure Investigation
Static and dynamic failure modes are illustrated and compared in Tables 3 to 6. Tables have photographs showing the test cut from the respective mockup and also illustrative diagrams on the right hand side. Dynamic test failure modes were found similar to that of static test failure mode for the case of the S-1, S-2 and S-4 as shown in Table 3, Table 4 and Table 6, respectively. Failure mostly occurred at adhesive level either it happened between base sheet and cover board and ISO or a combination of them. Interestingly, S-3 had different failure mode than others as shown in Table 5, meaning that the dynamic test failure mode was different compared to that of the static test failure mode. This might be caused by the adhesive application methodology, which was manually applied using ribbon format for this mockup. As results of this, the amount of adhesive applied was difficult to control and was inconsistent from one beading to another (Table 5). Other failure modes observed were ISO top facer delamination and uncured adhesives at certain places. It is also noted that in all mockup cuts, the condition of uncured adhesive was found in several locations. This indicates that the curing time (21 days) used by the present study
is not sufficient and needs to be modified in the future investigations. Eliminating this condition can affect the wind uplift resistance performances of the AARS.
Table 3. Static and Dynamic Failure Investigation Photos and Diagrams: Source 1
Table 4. Static and Dynamic Failure Investigation Photos and Diagrams: Source 2
Table 5. Static and Dynamic Failure Investigation Photos and Diagrams: Source 3
Table 6. Static and Dynamic Failure Investigation Photos and Diagrams: Source 4
Concluding Remarks
This ongoing investigation provided a broader overview of the AARS wind uplift performance under static and dynamic loading conditions. Based on this study, the following conclusions can be drawn:
• Wind uplift performances of the adhesive applied roof systems are different from that of the mechanically attached roofing systems.
• Using a common experimental set-up and application methodology, AARS assemblies were evaluated, for the first time, under both static and dynamic loading conditions.
• In comparison to the dynamic test protocol that simulates the fatigue effects on systems, the static test protocol overestimates the wind uplift resistance performance, due to the fact that it does not simulate the real wind loading behaviour over the roofing systems.
• The majority of the failure modes were found similar irrespective of the test protocols used.
Acknowledgement
The authors acknowledge the financial support provided by the Natural Sciences and Engineering Research Council (NSERC) project under Grant # CDR 305819 and Roofing
manufacturers: SOPREMA Inc., BAKOR Inc., TREMCO Inc. and IKO Industries Ltd. and Roofing Contractor Association of British Columbia (RCABC).
References
American Society of Civil Engineering (2004), Minimum Design Loads for Building and Other Structures, SEI/ASCE 7-04, New York, USA 10017-2398.
Baskaran, A., Murty, B. and Tanaka, H. (2006), Wind Uplift Resistance Data for Fully Adhered Low Slope Roofing Systems: Preliminary Experimental Study, Internal Report- IRC-NRC. pp. 1-41, February 2006 (in Press).
Baskaran, A. and Smith, T.L. (2005), A Guide for the Wind Design of Mechanically Attached Flexible Membrane Roofs, Institute for Research in Construction, National Research Council of Canada, Ottawa, Canada K1A OR6, ISBN 0-660-19518-6.
Baskaran, A., Lei, W. and Richardson C. (1999a), Dynamic Evaluation of Thermoplastic Roofing Systems for Wind Performance, Journal of Architectural Engineering, ASCE, vol. 5, No 5, pp. 16-24.
Baskaran, A., Chen, Y., Vilaipornsawai, U. (1999b), A New Dynamic Wind Load Cycle to Evaluate Flexible Membrane Roofs, Journal of Testing and Evaluation, 27, (4), July, pp. 249-265.
Baskaran, A. and Lei, W. (1997), A New Facility for Dynamic Wind Performance Evaluation of Roofing Systems, Proceedings of the Fourth International Symposium on Roofing Technology, NRCA/NIST, Washington, D.C., U.S.A., pp. 168 -179.
Canadian Standard Association (2004), Standard Test Method for the Dynamic Wind Uplift Resistance of Mechanically Attached Membrane Roofing Systems, CSA 123.21-04, Toronto.
Factory Mutual Research (2005), Approval Standard: Class1 Roof Covers (4470), Norwood, Massachusetts, USA.
Phalen Jr, Thomas E. (1993), Design & Analysis of Single Ply Roof Systems, Prentice Hall
Publishing, Englewood Cliffs, NJ 07632, Jan., pp. 1-624.
Hens, H., Janssens, A. and Silberstein, A. (1995), A Study of Parameters Influencing the Hydric Behavior of Insulated Sloped Roofs Without Air Barrier, Thermal Envelopes Conference, Vol.1, pp.729-739.
National Research Council Canada (2005), National Building Code of Canada User’s Guide – Structural commentaries (Part 4), Ottawa, Ontario, Canada, K1A 0R6.
Figure 2. Force Dissipation Diagram of AARS and MARS (Dwgs not to Scale)
MARS
Figure 4. Mockup and Component Layouts on the DRF Table
Mockup Dummy P 1 P 2 P ref 1981 mm (78 in) Dummy 3048 mm (120 in) 6096 mm (240 in) 1524 mm (60 in) 1219 mm x 1219 mm (4ft x 4ft) 305 mm x 1219 mm (1ft x 4ft)
Layout 1 – Insulation Board
1219 mm x 1219 mm (4ft x 4ft) 305 mm x 1219 mm (1ft x 4ft) 915 mm x 762 mm (3ft x 2.5ft) 1219 mm x 762 mm (4ft x 2.5ft) 915 mm x 762 mm (3ft x 2.5ft)
Layout 3 – Base Sheet
686 mm x 2286 mm (2.25ft x 7.5ft) 1000 mm x 2286 mm (3.28ft x 7.5ft) 686 mm x 2286 mm (2.25ft x 7.5ft) 1000 mm x 2286 mm (3.28ft x 7.5ft)
Layout 2- Cover Board
1219 mm x 1524 mm (4ft x 5ft) 1219 mm x 1524 mm (4ft x 5ft) 609 mm x 1524 mm (2ft x 5ft) 1524 mm x 457 mm (5ft x 1.5ft) 1524 mm x 457 mm (5ft x 1.5ft)
Layout 4 – Cap Sheet
686 mm x 2286 mm (2.25ft x 7.5ft) 1000 mm x 2286 mm (3.28ft x 7.5ft) 686 mm x 2286 mm (2.25ft x 7.5ft) 1000 mm x 2286 mm (3.28ft x 7.5ft)
Figure 5. Mockup Preparation and Installation
Figure 8. Failure Criteria Used During AARS Wind Testing Failure Criteria A = 23.7 m (10 ft) x 2.1 m (7ft) = 49.77 m2 (70 ft2) If A of A A A1 + 2+ 3≤10%
∑
or ≤ 4.98 m2 (7 ft2) Sustained Level A = 23.7 m (10 ft) x 2.1 m (7ft) = 49.77 m2 (70 ft2) If A of A A A1 + 2+ 3≥20%∑
or ≥ 9.95 m2 (14 ft2)Failed Level- Test Stopped
A2 2.1m (7ft) A1 A3 Dummy Dummy Mock Up Blister 23.7 m (10ft) Note :
A = Total mockup surface area A1, A2 and A3 = Blistering area
occur over the mockup during testing
0 5000 10000 15000 20000 25000 0 15 30 45 60 P ress u re, ps f Time, sec Pt = 45 psf 12 25 37 49 25 S-1 060107-Pref 0 5000 10000 15000 20000 25000 0 15 30 45 60 P res su re , p s f Time, sec Pt = 45 psf 12 25 37 48 25 36 47 30 S-2 060105-Pref 0 5000 10000 15000 20000 25000 0 15 30 45 60 12 34 45 45 29 42 34 23 P ress u re, p s f Time, sec Pt = 45 psf S-3 060103-Pref 24 24 45 34 23 0 5000 10000 15000 20000 25000 0 15 30 45 60 P ress u re, p s f Time, sec Pt = 30 psf 9 17 25 33 16 25 33 21 31 41 31 41 S-4 060109-Pref 17 16 21 31 33
Figure 11. Mockups Typical Failure Investigation
Deep Cut Mockup up to Steel Deck Test Cut Being Made
Mock-Up During Testing Mock-Up After Testing
Adhesive Failure Between BS and CB Adhesive Failure Between BS and CB
Table 1. AARS and MARS – Advantages and Disadvantages
AARS Features
Advantages Disadvantages
- Less moisture transport
- No fastener corrosion and penetration problems
- Less thermal bridging - Less air intrusion
- Labour intensive (QA and QC) - Blistering
- UV sensitive (in term of using Granule) - Slippage / Components movements - Adhesive application needs curing time
MARS Features
Advantages Disadvantages
- Relatively faster in application
- Less dead weight due to components arrangement
- Less labour intensive due to use of robotic welders (QA and QC)
- No slippage - No curing time
- Moisture problem
- Fastener corrosion and penetration problems
- Thermal bridging
- Intrusion issue due to membrane ballooning
Table 2. Mock Up Configurations
Roofing Components Source 1 Source 2 Source 3 Source 4
1) Steel Deck 22 Ga Steel deck 22 Ga Steel deck 22 Ga Steel deck 22 Ga Steel deck
Primer 3
Deck Adhesive Primer 1 none Steel Deck 3 Adhesive
(Ribbon)
Steel Deck 4 Adhesive (Ribbon)
2) Vapour Barrier (Retarder-VC) VC 1 (Self Adhered) VC 2 (Self Adhered) VC 3 VC 4
VC Adhesive VC 1Adhesive (Ribbon) VC 2 Adhesive (Ribbon) VC 3 Adhesive (Ribbon) VC 4 Adhesive (Full Coat)
3) Insulation Board (ISO) 2” ISO 2” ISO 2” ISO 2” ISO
ISO Adhesive ISO 1 Adhesive (Ribbon) ISO 2 Adhesive (Ribbon) ISO 3 Adhesive (Ribbon) ISO 4 Adhesive (Full Coat)
4) Cover Board (CB) CB 1 CB 2 CB 3 CB 4
CB Adhesive CB 1Adhesive (Full Coat) CB 2 Adhesive (Full Coat) CB 3 Adhesive (Full Coat) CB 4 Adhesive (Full Coat)
5) Base Sheet (BS) BS 1 BS 2 BS 3 BS 4
Mem Adhesive BS 1Adhesive (Full Coat) BS 2 Adhesive (Full Coat) BS 3 Adhesive (Full Coat) BS 4 Adhesive (Full Coat)
Table 3. Static and Dynamic Failure Investigation Photos and Diagrams (Not to scale): Source 1
Test
Protocol Failure Investigation (S-1)
Static (060106) Failure # 1 Failure # 2 Dynamic (060107) Adhesive Failure Between Cover Board and ISO Board
Cover Board
Facer Delamination
Adhesive Failure Between Cover Board and ISO Board
Table 4. Static and Dynamic Failure Investigation Photos and Diagrams (Not to scale): Source 2
Test
Protocol Failure Investigation (S-2)
Static (060104) Failure # 1 Failure # 2 Dynamic (060105) Adhesive Failure Between Cover Board and ISO Board
Cover Board Base Sheet
Adhesive Failure Between Base Sheet and Cover Board
Base Sheet
Adhesive Failure Between Base Sheet and Cover Board
Table 5. Static and Dynamic Failure Investigation Photos and Diagrams (Not to scale): Source 3
Test
Protocol Failure Investigation (S-3)
Static (060102) Failure # 1 Failure # 2 Dynamic (060103) Adhesive Failure Between Cover Board and ISO Board
Cover Board Base Sheet
Adhesive Failure Between Base Sheet and Cover Board
Table 6. Static and Dynamic Failure Investigation Photos and Diagrams (Not to scale): Source 4
Test
Protocol Failure Investigation (S-4)
Static (060108) Dynamic (060109) Base Sheet Adhesive Failure Between Base Sheet and Cover Board
Base Sheet
Adhesive Failure Between Base Sheet and Cover Board