Airborne monitoring system for in-season
agriculture: operational considerations and image
processing for wide-area sensing
by
Mark N. Jeunnette
Submitted to the Department of Mechanical Engineering
in partial fulfillment of the requirements for the degree of
Doctor of Philosophy in Mechanical Engineering
at the
MASSACHUSETTS INSTITUTE OF TECHNOLOGY
September 2018
@
Massachusetts Institute of Technology 2018. All rights reserved.
Signature redacted
A u th o r
...
...
Dep
irnent of Mechanical Engineering
-A ugust 20, 2018
,Signature
redacted7
Certified by....
...
Douglas P. Hart
Professor of Mechanical Engineering
Thesis Supervisor
Signature redacted
A ccepted by ...
MASSACHUSETTS INSTITUTE
Rohan Abeyaratne
OF TECHNOLOGY
Chairman, Committee on Graduate Students
OCT 022018
MITLibraries
77 Massachusetts Avenue
Cambridge, MA 02139 http://Iibraries.mit.edu/ask
DISCLAIMER NOTICE
The pagination in this thesis reflects how it was delivered to the
Institute Archives and Special Collections.
The Table of Contents does not accurately represent the
page numbering.
Airborne monitoring system for in-season agriculture:
operational considerations and image processing for wide-area
sensing
by
Mark N. Jeunnette
Submitted to the Department of Mechanical Engineering on August 20, 2018, in partial fulfillment of the
requirements for the degree of
Doctor of Philosophy in Mechanical Engineering
Abstract
Remote sensing, in particular multispectral imagery, can measure crop health and detect in-season disturbances such as pests and diseases before they are visible to the naked eye, but it is inaccessible to small-plot farmers, especially in developing countries. So-called eExtension services provide up-to-date, reliable information for small-plot farmers, but struggle to collect the plot-specific crop health information on which to base personalized recommendations. This thesis addresses this issue using novel ideas in remote sensing system understanding, image processing, and geospatial workflow to develop the Airborne Monitoring System for In-Season Agriculture
(AM-SISA) and make remotely sensed crop health data accessible and useful for small-plot
farmers.
A simulation of platform performance characteristics shows that manned aircraft
are the better aerial remote sensing platform, given current performance and regu-latory realities. The time-series aerial remote sensing (TSARS) approach allows a reduction in spatial resolution to dramatically reduce survey costs and enable fre-quent updates for better monitoring performance. This allowance for plot-resolution (but not finer) data and minimal cost per hectare over a large area leads to the devel-opinent of a model to optimize the data collected per plot based on survey altitude, heading, and camera properties. Imagery collected using a custom camera setup aboard a manned aircraft in Maharashtra, India is used to test and verify the models. Surveying at a spatial resolution near the size of farm plots on the ground requires precise registration of remotely sensed images to ensure accurate crop reflectance measurements. Current and novel multi-modal image registration techniques are tested and found to be inadequate for this application. Instead, a technique using known fiducials is presented to achieve the required registration precision.
Thesis Supervisor: Douglas P. Hart
Acknowledgments
This work would not have been possible without the support of my committee mem-bers, Doug Hart, Sanjay Sarma, and Jim Bales. I am deeply appreciative of their feedback and support, and putting up with my jokes.
The work was supported financially by the MIT Tata Center for Technology and Design, and I am especially grateful for being given the freedom from the beginning to define a project that was meaningful to me and with potential for positive impact in the world.
I have received intellectual and emotional support from so many people throughout
this thesis that it is impossible to name them all. I would in particular like to thank Thanasi Athanassiadis for his reliable feedback and solid friendship, and to the rest of my labmates... Jonny, Jorge, Brandon, Kelsey, Mark, Alban, Jason, Peter, and Laureen. May you continue to carry on the tradition of pranks on Doug after I'm gone.
To my family and friends, thank you for the tireless support over the years of this thesis. They haven't always been easy, but this achievement belongs to you as well.
Contents
1 Introduction 23
1.1 Small-plot agriculture in the developing world . . . . 24
1.2 Agriculture extension services . . . . 25
1.2.1 eExtension services . . . . 25
1.3 A M SISA . . . . 26
1.4 Structure of thesis . . . . 28
2 Background 29 2.1 eExtension services . . . . 29
2.2 Precision agriculture (PA) . . . . 29
2.3 Remote sensing . . . . 32
2.3.1 Remote sensing challenges in India . . . . 33
2.3.2 Multispectral imaging . . . . 37
2.4 Remote sensing of agriculture . . . . 37
2.4.1 Plant reflectance . . . . 37
2.4.2 Crop indices . . . . 42
2.5 Multispectral image registration . . . . 43
3 Platform choice 45 3.0.1 Remote sensing platform options . . . . 45
3.1 Design requirements . . . . 47
3.2 Area and cost simulations . . . . 48
3.2.2 Analytical model . . . . 50
3.2.3 Numerical model . . . . 51
3.2.4 Cloud base and wind influence . . . . 58
3.2.5 Simulation results . . . . 59
3.2.6 Discussion . . . . 61
4 Time series aerial remote sensing (TSARS) 63 4.1 Benchmark: snapshot crop sensing . . . . 63
4.2 TSARS - "right resolution" aerial remote sensing . . . . 64
4.2.1 Workflow . . . . 66
4.3 Survey altitude optimization . . . . 69
4.3.1 Buffon's Pixel analysis . . . . 71
4.3.2 Real-world plot shape simulation . . . . 81
4.4 D iscussion . . . . 85
5 Registration precision 93 5.1 Small-plot agriculture imagery . . . . 95
5.2 Direct registration approaches . . . . 98
5.2.1 Image pre-processing . . . . 98 5.2.2 Image-based methods . . . . 100 5.2.3 Feature-based methods . . . 111 5.3 Commercial codes . . . . 117 5.4 Fiducial-based approaches . . . . 120 5.4.1 Photogrammetric precision . . . . 121
5.5 Concurrent Localization and Mapping . . . . 123
5.6 Discussion . . . . 123
6 Conclusion 125 6.1 AMSISA . . . . 126
6.1.1 Data collection . . . . 126
6.2 TSARS .... ... . ... ... .. . . . .. .. .. 127 6.3 Registration precision. . . . . 127 6.4 Future work . . . . 128 A Data collection 129 A.1 Instrumentation . . . . 129 A.1.1 HSMMCA . . . . 129
A.2 Flying in India . . . . 130
List of Figures
1-1 AMSISA proposes to (a) collect multispectral imagery using an aerial platform, (b) process that imagery into useful crop data and pass it to an eExtension service, which then (intreprets the data and uses it to advise farmers about decisions in their field. To defray or eliminate the survey costs for the farmers, the data can be sold in aggregate to industry and government entities (d). . . . . 27
2-1 Aerial imagery from Google Maps shows farmland in West Bengal, In-dia. On the left, orange bars indicate lengths of 20m, showing field sizes of less than 20Gm2
(0.02ha). On the right, a single farmer's landholding is highlighted in white. The three fields are separated by approximately 800m . . . . . 34
2-2 Three multispectral cameras used in aerial surveys. (a) Micasense Red-EdgeM, (b) high speed multispectral multi camera array (HSMMCA), constructed by the author, and (b) Leica RCD30. . . . . 38
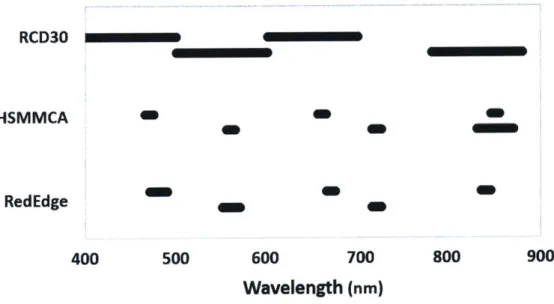
2-3 Wavebands available in each of the cameras shown in Figure 2-2 . . . 39
2-4 Nitrogen deficiency appears as a yellowing of the leaf, shown on the left in a soybean leaf [431. . . . . 40
2-5 Spectral signatures of tea grown under various conditions. Note in particular the red (healthy) and yellow (diseased) tracks [481. . . . . . 41
2-6 Image registration is the alignment of two images relative to one an-other. In this case, (a) a source image captured in a 780nm waveband (near infrared) is registered to (b) a panchromatic satellite target im-age, to create (c) an output image in which the features from the input image are aligned in the reference frame of the target image. . . . . . 44
3-1 Three platform types to consider for wide-area small-plot remote sens-ing: (a) satellites, (b) manned aircraft, and (c) UAVs. Images from http://landsat.usgs.gov/, Frank Schwichtenburg (Creative Commons Attribution-Share Alike 3.0 Unported), and http://www.sensefly.com/, respectively. . . . . 46
3-2 Comparison of purchase price to cruise velocity of civilian UAVs and light manned aircraft. Filled markers represent UAVs, open markers show manned aircraft, and platforms are listed on the right in order of increasing Vcruise. Data collected from Jane's All the World's Aircraft and manufacturers' and retailers' websites.[9 . . . . 51 3-3 Sketch of a simple lawnmower pattern shows turn distance, field of
view, and side overlap. . . . . 54 3-4 Sketch descriptions of UAV survey operations. (a) A single UAV goes
through five steps for each flight. (b) Four UAVs each perform one flight over adjacent areas, making up one mission. They are then transported
by van to the next survey area, and so forth. . . . . 57
3-5 Simulation results show the area covered per day vs. AGL. It is clear the multiple UAVs have the potential to cover more area than a manned aircraft for moderate AGL. Unfortunately, current regulations constrain UAVs to 400 ft AGL, which is at the far left edge of the plot. 59 3-6 As expected, the cost per area reduces with the amount of area covered
(accomplished by the platform flying higher). Stars indicate the points at which the Cessna becomes competitive with each set of UAVs. . . . 60
4-1 Large-plot/small-pixel data for industrialized agriculture is used to compare different parts of the field to each other, in order to deter-mine how treatments should be spatially varied across the field.[5J . . 65
4-2 TSARS workflow in schematic form . . . . . 67
4-3 In the TSARS workflow (a) high-resolution panchromatic satellite im-agery is acquired for the survey area and established as a basemap, (b) plot outlines are identified from the satellite imagery and stored in a parametric shapefile, (c) each multispectral image is coarsely located on the basemap image using camera location and orientation meta-data, (d) the image is warped using camera calibration data and finely registered to the basemap image using computer vision techniques, (e) the pixels in the multispectral image which fall within the plot outlines are selected and all other pixels are masked, (f) within each plot, the collection of valid pixel values is averaged to create a single reflectance value for the plot in the current waveband, (g) the process is repeated for each multispectral image in that waveband (here, 780nm), and (g) reflectance signals are combined to calculate a crop index for each plot (here, N D V I). . . . . 70
4-4 (a) Buffon's Needle problem asks for the probability that a needle of length 1 crosses one of an array of lines spaced d apart. (b) Buffon's Pixel overlays a grid of square pixels (of width 1) on a plot of width d, and asks how many pixels lie entirely inside the plot (the green-filled pixels). . . . . 72
4-5 Location and orientation of one-half of a pixel inside one-quarter of a plot. The center 0 of the pixel (black) is located at position (xpixei, ypixel)
inside the plot (green) of width d, and rotated at angle 0 greater than zero. ... ... 74 4-6 Location and orientation of one-half of a pixel inside one-quarter of a
plot. The center 0 of the pixel (black) is located at position (upixe6 , Vpixei) inside the plot (green) of width d, and rotated at angle 0 less than zero. 75
4-7 For values of 1 > there are some angles for which the pixel will not fit in the plot at all. . . . . 77
4-8 (a) P* evaluated over all possible 1 . Note results increasing >
which is incorrect. (b) Piecewise function Po showing the zero-value probability for some 0 when 1. (c) A close-up of PO(1, 0) for 1 > 79
4-9 Results of the Monte Carlo simulation of pixels landing inside of plots. For some size ratios x and heading angles 0, the probability of a pixel landing inside the plot is zero, highlighted on the left. . . . . 81
4-10 Comparison of theoretical probability (black lines) with simulation re-sults (green point cloud). . . . . 82
4-11 The maximum number of pixels inside a plot does not always occur when 0 equals zero. . . . . 86
4-12 Percent decrease in expected value of the number of landed pixels at
0 = 1 relative to 0 = 0. . . . .4 87
4-13 1251 farm plots were manually outlined from 0.5 m panchromatic satel-lite im agery. . . . . 87
4-14 Area distribution of farm plots in project area in Dhule, Maharashtra, In d ia. . . . . 88
4-15 Histogram of headings at which the bounding box around a plot is at its narrow est. . . . . 89
4-16 Plot outline and pixel area coverage ratio for plot number 111. In the middle plot, the black line shows the shape of the surface for a particular size pixel (in this case, a 20 m pixel). The plot on the right shows the profile of the black line from the middle plot in more detail. 90
4-17 Plot outline and pixel area coverage ratio for plot number 199. The black line in the middle plot shows the shape of the surface for a pixel size of 11.5m (approximately 1/5 of the minimum pixel width). ... 91
4-18 Average coverage ratio across all plots vs. pixel size and heading. As the pixel size increases, the effect of heading becomes more pronounced. 91
4-19 Histogram of the heading at which the maximum number of pixels land in a plot. Similar peaks compared to Figure 4-15 suggest that the minimum-width heading is a valid proxy for determining optimum heading. . . . . 92
4-20 The proportion of 'successful' plots in the survey area, given a mini-mum expected value of five landed pixels per plot. The variation across the heading axis suggests an optimum heading for the survey. .... 92
5-1 Uncertainty in pixel location reduces the number of landed pixels in a plot. In this schematic, a single pixel is located inside a plot (a).
If the location of that pixel is uncertain by a distance ua,the pixel
is effectively enlarged by 2oa, (b). Equivalently, the plot boundary is reduced in size by a buffer of width og, (c). In either case, the pixel shown is no longer entirely contained inside the plot. . . . . 94
5-2 Imagery from the Dhule, Maharashtra, India survey area: (a) panchro-matic 0.5 m basemap satellite image, (b) 780 nm narrow-waveband aerial image, and (c) 670 nm narrow-waveband aerial image. For each image, the waveband of light included in the image is illustrated be-neath it on a nominal healthy plant reflectance spectrum. . . . . 95 5-3 An example registration in which the narrow-waveband image
(fore-ground) lays precisely on top of the panchromatic image (back(fore-ground). The alignment is easiest to see around the edges, where roads, rivers, and plot boundaries cross from one image onto the other. . . . . 96
5-4 Three patches cropped from the same images as in Figure 5-2 illustrate the primary challenge for multispectral image registration. Each image shows three adjacent farm plots. The panchromatic image (a) shows the topmost plot as the darkest of the three, the 780 nm waveband image (b) the bottom most plot appears darkest than the other two, and in the 670 nm waveband image (c) the middle plot reflects less light (is darker) than the other two plots. . . . . 97
5-5 Each imager within the multispectral camera is calibrated using im-ages of a target of known shape and dimensions. In this case, a flat chessboard of known dimensions is photographed multiple times from different angles (a). By extracting the corners of the chessboard and knowing that the actual chessboard is flat, an image transformation can be found to correct subsequent images taken with that camera. A raw 780 nm image is shown in (b) with its corrected version in (c). . . 99 5-6 The undistorted image (a) undergoes a perspective transformation to
simulate a nadir view (b), and is rotated so that north in the image is pointing upwards in the image(c). . . . . 100 5-7 The basic Mean Squared Error image-based metric. The position of
the dark spot in the result image (c) indicates the minimum error, or where the source image (b) best aligns with the target image (a). . . 102
5-8 The basic Mean Squared Error image-based metric does not produce a single best match point from the multispectral imagery, but instead gives an ambiguous result. (a) target image from the panchromatic basemap, (b) source image cropped from a pre-processed aerial image, (c) the resulting image showing the value of MSE at each possible over-lay location. (d) shows the same result image, but histogram equalized, which makes it easier to see that there is no clear position where the
M SE is at a minimum. . . . . 103
5-9 Two sets of windows illustrating the SSIM process. A window from the basemap image ("BM Window") is extracted based on the multisepc-tral image window's (MS Window's) expected location from GPS and
IMU data. A heatmap is generated via the SSIM error metric, and the
maximum point in the heatmap is used to identify BM Win Shifted. Sequence (a) was successful in that the BM Win Shifted appears to match the original MS Window, despite the heatmap appearing incon-clusive. Sequence (b) was not successful in shifting the BM Window. 105
5-10 For each window in the multispectral image (a), its corresponding
ex-pected location (based on GPS and IMU data) was identified in the panchromatic basemap (b). After SSIM analysis, the revised basemap window is then added in (c). . . . . 106 5-11 A segment of the panchromatic basemap (BM Window) is cross
cor-related in the Fourier Domain with one channel of the multispectral image (MS Window). The resulting map of correlations (Pixel offset) did have a relative peak at a shift of [-288,128] pixels. . . . . 107 5-12 A multispectral image (a) was positioned using GPS and IMU data
as the blue rectangle in the panchromatic basemap image (b). The detected shift from Fourier domain phase correlation was then applied to position the yellow rectangle on (b). . . . . 108 5-13 Two consecutive images taken with the same camera (a) and (b) exhibit
a rigid lateral translation. The phase correlation method shows a clear hot spot at the pixel offset [-1,-151], which matches the translation. . 109
5-14 A different view of Figure 5-13, in which the position of image(a) in the reference frame of image (b) is successfully displayed in (c). . . . 110 5-15 SIFT keypoints on a panchromatic image (left) and a narrow-waveband
multispectral image(right). Note there is little correspondence between keypoint locations in the two images. . . . . 112
5-16 While SURF generates a very large number of keypoints (blue circles),
the descriptors are not consistent enough between wavebands to allow effective matching. Green lines connect matches, which in this case could not lead to a single transformation. . . . . 113 5-17 The ORB algorithm produces fewer keypoints than SIFT or SURF,
but the matches are also incorrect. . . . . 113 5-18 The Canny edge detector is a well-known algorithm for identifying the
edges in an image. Pre-processing the imagery with a Canny edge de-tector before applying ORB led to a seemingly random set of keypoint m atches. . . . . 114
5-19 Because the multispectral camera has multiple wavebands across the
visible spectrum, an attempt was made to simulate a panchromatic im-age by registering the narrow-waveband multispectral imim-ages to each other and stacking them on top of one another. Even when the align-ment between the narrow wavebands was done manually, the resulting image did not closely enough approximate the panchromatic basemap to allow ORB to find correctly matching keypoints. . . . . 115
5-20 In the intersection feature transform, line segments are extracted from
both multispectral (a) and panchromatic basemap (b) imagery. For each pair of line segments within a certain radius, their intersection is treated as a keypoint and a descriptor is constructed based on other intersections within a certain radius (c). . . . . 116
5-21 When keypoint matches are limited to only the areas within 30 pixels
of their expected locations (based on GPS and IMU data) (a), the number of matches drops significantly and multiple source keypoints are tied to the same target keypoint (b). . . . . 116
5-22 Method - circumferential path: For a candidate keypoint (a), the
in-tensity around a circumference of radius r is taken as a ID signal and analyzed to determine if it depicts a regular 90' intersection (b) . . . 117
5-23 When the algorithm was used to identify intersections in a
panchro-matic basemap (a) and a narrow waveband multispectral image (b), none of the identified intersections matched between the two images. . 118
5-24 Result of an auto-registration attempt by the commercial software package ArcGIS Pro on the Dhule imagery. The colored points in-dicate the manually entered keypoint pairs before auto-registration. . 119
5-25 Result of a guided auto-registration attempts by the commercial
soft-ware package ENVI on the Dhule imagery. (a) The original rectan-gular image, located using GPS and IMU data, auto-registered using
(b) a cross-correlation algorithm, (c) a Harris edge detector, and (d)
Moravec operator. The results were inconsistent and none aligned the multispectral image especially well from visible inspection. . . . . 119 5-26 A typical photogrammetric block includes the primary tracks as well as
one cross track on either end, and requires four ground control points for georeferencing . . . . . 122
A-1 The HSMMCA camera contained 7 panchromatic imagers with
narrow-waveband notch filters. . . . . 130 A-2 Survey flight path in Dhule, Maharashtra, showing multiple passes at
different altitudes and headings. . . . . 131 A-3 The author controlled the camera from a laptop while sitting in the
copilot seat. . . . . 131
A-4 The camera was fixed to the wheel strut of the Cessna 172 using a custom yoke attachment. . . . . 132 A-5 The umbilical for power and data was fed into the cabin via an air vent. 132 A-6 The downwelling light sensor was mounted on top of the aircraft, and
a USB cable fed into the cabin via the same air vent. . . . . 133 A-7 Inside the cabin, IMU and power modules were mounted behind the
pilot's seat, and a laptop computer was used to monitor and control the cam era system . . . . 133 A-8 The mounted camera had a clear view of the ground thanks to its low
List of Tables
2.1 Some eExtension services and their implementation forms . . . . 30 3.1 Design parameters uncovered during user research of Indian
small-holder farmers. Each value is described as a limit, to indicate the minimum performance necessary. . . . . 47
3.2 Parameters and symbols used to estimate cost and performance of different platform and camera configurations. . . . . 52
Chapter 1
Introduction
Simallholder farmers around the world face increasing challenges in managing their crops, and are in need of better in-season information about crop pests and diseases. Innovative so-called "eExtension systems" have been developed to provide farmers this information, but their effectiveness is limited by their incoming data stream about crop conditions on the ground. Technology, in the form of satellites, aerial cameras, and drones, already exist to serve industrialized agriculture with effective crop remote sensing data. These tend to be either limited in performance or very expensive, how-ever, and are thus not applicable in developing world small-plot agriculture settings. This thesis describes an analysis of the important parameters of remote sensing for small-plot agriculture, and the development of an approach to solving this information bottleneck, called the Airborne Monitoring System for In-Season Agriculture
(AM-SISA). AMSISA has been designed to collect and process high-frequency plot-specific
aerial multispectral remote sensing imagery over large areas at a cost of 0.50 USD per ha per season. Coupled with a broad-reaching eExtension program, this system could have a significant impact on the ability of small-holder farmers to respond to the risks and uncertainty inherent in their operations, and help them improve their yields and their income.
The process of developing AMSISA has involved interviews with farmers and other stakeholders in the small-holder agriculture in India, as well as design and construction of a multispectral camera, aerial data collection in Dhule, Maharashtra,
India, theoretical analysis of the aerial remote sensing context, and development of image processing software to make wide-area sensing of small plot agriculture possible.
The primary contributions are (1) a system understanding of the small-plot remote sensing context which can be used to assess the utility of improvements in airframes and sensors as well as energy storage and propulsion systems; (2) the Time-Series Aerial Remote Sensing approach, which allows for a lower image resolution in order to reduce the cost of data collection; and (3) image registration and pixel placement precision models which allow operators to ensure minimum cost while maintaining
useful data.
1.1
Small-plot agriculture in the developing world
Globally, approximately 2.5 billion people are involved in smallholder agriculture work either full- or part-time, managing an estimated 500 million small farms.[22j From variable weather to pests and diseases, volatile produce markets to lack of reliable best practice information, the risks undertaken by a typical smallholder farmer are very high. Particularly somewhere like India, where the average landholding is less than 1.2ha per family and 50% of the population is dependent on agriculture for their livelihood, any factors that reduce crop yield can have a devastating effect on family income.[16] Research in the recent farmer suicide epidemic in India cites failed harvest and debt as the leading causes of farmer suicide.
119]
Yet, despite this need, crop yields in India are far below those of other similar countries. National average rice yield, for example, is approximately 3,700kg/ha in India, but 25% higher in neighboring Bangladesh (4,619kg/ha) and 87% higher (6,932kg/ha) in China.[11] This discrepancy has many causes but, as evidenced by developments in industrialized agriculture in places like the US, better and more timely information can make a big difference in farmers' yields and livelihoods. [4911.2
Agriculture extension services
In many countries, including India, agriculture extension services are funded by fed-eral and state governments in order to serve this need by farmers for information on the latest and most effective crop management strategies. With over 100 million small and marginal landholdings (defined as less than 2 ha in area), however, the cost of providing personalized information to those farmers has been prohibitive. [101 The result in India is that, according to a 2009 study, only 4.8% of farmers operating on farms of less than 2ha accessed information from government extension workers.[14
Noticing the limitations in the reach of government extension services, independent organizations, both for-profit and non-profit, have taken the next step to develop and implement so-called eExtension services in the last decade. These services take full advantage of information and communication technologies (ICT) in order to better serve farmers' information needs.
1.2.1
eExtension services
eExtension services range in implementation from farmer-accessible computer kiosks, to smartphone apps, to a digital back-end supporting live extension agents. In each case, they have created a channel with the opportunity to personalize the data pro-vided to each farmer. Similar to many other sectors disrupted by ICTs, it is this personalization over a large user base which offers the greatest promise of impact.
In order to give effective advice to a farmer, an eExtension service must have background information on the farmer and his fields. At the moment, if a pest or disease arrives in a farmer's field, the eExtension service has only one way to find out about it: the farmer. The farmer has to notice that there is a problem, and only then can he or she contact the eExtension service to find a remedy. If the farmer is fortunate enough to have a phone with a camera on it, he or she can take and send an image of the problem to the eExtension service, but even that image is limited in that it only captures visible light. The extent of the information on which the eExtension service can base its recommendation is limited to what the farmer or his or her camera
can observe. The strength of the eExtension channel -that an individual field agent doesn't need to visit the field -is also its limitation.
From this need for better flow of information from the farm plot to the eExtension service comes the goal of this thesis: the creation of a system for collecting crop health information over the large geographical areas covered by an eExtension service, but at a high enough resolution to be able to provide plot-specific data, and inexpensive enough to be financially sustainable in a place like rural India.
1.3
AMSISA
Remote sensing technology is already used in agriculture, in the form of satellites, crewed aircraft, and unmanned aerial vehicles (UAVs), but it is currently not afford-able for smallholder famers. AMSISA reduces costs by (a) maximizing survey area coverage while minimizing cost per area covered, and (b) use low-cost imaging equip-ment that has recently become available off the shelf. The vision for how the AMSISA would be implemented is illustrated in Figure 1-1. Multispectral imagery is captured over a wide area of crops (>100,000ha), and processed into plant reflectance and crop indices for each individual farm plot. This data is then passed to an eExtension agency, which combines the crop health data with other data streams, to inform its updates and recommendations to farmers. These farmers then use their own knowl-edge and the advice from the eExtension service to make decisions about how to manage their crops. In addition, the data produced from AMSISA may be of value to other players in the agriculture space, namely government agencies, commodities traders, and agriculture insurance companies. Sold in aggregate form, this data may be able to defray or eliminate the cost to farmers for data collection.
Ab
c d
Figure 1-1: AMSISA proposes to (a) collect multispectral imagery using an aerial platform, (b) process that imagery into useful crop data and pass it to an eExtension service, which then (intreprets the data and uses it to advise farmers about decisions in their field. To defray or eliminate the survey costs for the farmers, the data can be sold in aggregate to industry and government entities (d).
1.4
Structure of thesis
This thesis describes the development of the Airborne Monitoring System for In-Season Agriculture (AMSISA) to meet this need for low-cost data collection for eEx-tension services. The academic contributions consist of image processing techniques to make it possible, the time-series based operational mode, and the system-level understanding required to optimize operation of such a data collection system.
Background information on eExtension services, Precision Agriculture (PA), re-mote sensing of agriculture, and multispectral camera hardware is covered in chapter 2. Chapter 3 discusses the choice of platform on which to carry a remote sensing cam-era for agriculture, and a method for deciding which is best suited to the case at hand. To design a low-cost small-plot agriculture monitoring system, some performance re-quirements must be relaxed relative to existing technologies designed for large-field industrialized agriculture. Chapter 4 describes the Time Series Aerial Remote Sens-ing (TSARS) approach, which allows for lower-resolution data and higher frequency of data collection while still providing useful information for small-plot farmers. One outcome of the TSARS approach is a need for precise image alignment across spectral wavebands. Questions of spatial precision in the assembly of the images into data are described in chapter 5. Finally, Chapter 6 concludes and discusses future work.
Chapter 2
Background
2.1
eExtension services
As described in Section 1.2, agriculture extension services support farmers by being a conduit for new research and techniques for improved agriculture. In a place like India, however, government extension offices have struggled to serve their entire customer base. The eExtension services listed in Table 2.1 have been developed to reduce the cost of getting information to the farmer. All of them offer "push" information, in which the service sends updates to the farmer without the farmer having to request it (such as weather updates) and some form of "pull" information, in which the farmer requests particular data or advice on a particular issue.
2.2
Precision agriculture (PA)
Typical field crop farming practices in the twentieth century involved planting row crops with consistent even spacing in a field, and then applying inputs (water, fer-tilizer, pesticides, etc.) as evenly as possible across the field as the crop grew. As much as agriculturalists tried to model farms on factories in their consistent inputs, especially as agriculture grew to incorporate industrialized machinery, the techniques failed to take into account the natural variability in soil nutrients, water holding ca-pacity, and available sunlight within a single field. Precision Agriculture (PA) is a
Table 2.1: Some eExtension services and their implementation forms name eChoupal aAQUA Digital Green DEAL IKisan Namma Raitha mKRISHI eSagu. Nutrient Expert
Kisan Call Center Sowing App developed by ITC Ltd IIT Bombay Digital Green IIT Kanpur Nagarjuna Group eKisaan Foundation TCS IlT Hyderabad IPNI Government of India Microsoft implementation
farmer-accessible computer kiosks
web portal for responding to farmer ques-tions
teaching videos by farmers for farmers digital knowledge base accessed by village level agriculture extension centers
web portal with detailed crop information and access to agricultural inputs
mobile tablet-based portal with training, expert advice, and interactive support fea-tures
mobile app and in-person agents with dig-ital back-end, providing crop advice, mar-ket information, and planning support web portal backed by live experts, who re-spond to farmer text and photo messages with personalized advice
Extension agent-run tool to make fertil-izer recommendations based on plot his-tory and yield
web portal, live-agent call center, and
SMS- and IVRS-based advice service
Al-backed SMS service to suggest the op-timum time for farmers to sow a particular set of crops
relatively recent name for the recognition of and accommodation for this variability.
By planting seeds and varying inputs across a field, farmers can take advantage of
the different conditions in different parts of their fields, reduce their input quantities (and therefore cost), and increase yields and/or profits.
The most cited description of PA is offered by Robert, et al., [44] and consists of three "R"s: the Right time, Right amount, and Right place for nutrient application in a field. Since then, two additional "R"s have been added to the list: Right source, and Right manner by Khosla.[31] While much of PA consists of new technologies such as auto-drive tractors (to, e.g., avoid overlapping rows of nutrient sprays), yield mon-itors (to produce yield maps to help in subdividing a field into "management zones"), and tractor-mounted crop sensors (to detect weeds for precise herbicide application), Khosla emphasizes that PA does not require high technology and that in the devel-oping world, where plots are much smaller and industrialized machinery is less often used, the basis of PA - the spatial and temporal variability in soil and crop factors
-can still be applied.
One important part of Precision Agriculture is the early detection of in-season disturbances to crop growth. Tracking crop health can help farmers make decisions about how best to remedy those disturbances, and increases the chances of a successful harvest. In addition, the earlier a pest or disease is identified, the lower the cost of intervention, whether a smaller amount of chemicals is required per plant or a smaller area needs to be treated.
2.3
Remote sensing
Remote sensing is the utilization of sensor technology to detect relevant properties of a subject from afar. In the case of crop agriculture, that subject is a field of plants during the growing season, and the sensor is an optical camera. The camera is carried on a platform, most often a ground vehicle, UAV, manned aircraft, or satellite. The platform determines how far away from the subject the camera is during operation and, combined with the camera parameters, how much crop area can be sensed in each
produced image. A platform which operates further from the subject (e.g., higher off the ground) allows a wider field of view in the camera at the expense of image detail. Ground sampling distance (GSD) is the distance between the centers of two image pixels on the ground, and determines the minimum size of feature that can be resolved in the image.
Since the 1970s, researchers have been aware that plants reflect sunlight differ-ently at different wavelengths in the electromagnetic spectrum. In particular, wave-lengths in the near infrared spectrum (800-1000nm) are reflected significantly more than wavelengths in the visible spectrum (400-800nm). Early experiments with satel-lite imagery led to the development of the Normalized Difference Vegetation Index
(NDVI) as a way to measure plant vitality from remotely sensed reflectance images
taken via satellite.[46 Multispectral cameras are designed to capture multiple im-ages of the same scene, each one showing the intensity of reflected light in a specific waveband. These wavebands are applied in some algebraic combination to create vegetation indices, which represent a particular crop property.
NDVI, as an example, is the normalized difference of the reflectance values in the
near infrared (REsoo at wavelength 800nm) and red (RE68o at wavelength 680nm):
NDVI = RE800 - RE680
RE80 0 + RE680
For plants, NDVI typically ranges between 0 and 1, and has been shown to corre-late to plant vitality and chlorophyll activity.
2.3.1
Remote sensing challenges in India
Providing farmers in India with remote sensing data in a useful form is challenging. The structure of Indian agriculture makes implementing remote sensing technologies developed for farming in highly industrialized nations impractical and cost prohibitive. These challenges include:
Plot size: Average size of landholding in India is 1.16 hectares (2.87 acres),
I
Figure 2-1: Aerial imagery from Google Maps shows farmland in West Bengal, India. On the left, orange bars indicate lengths of 20m, showing field sizes of less than 200m2 (0.02ha). On the right, a single farmer's landholding is highlighted in white. The three fields are separated by approximately 800m.
whole story. The average landholding size has reduced in size every time data was taken since the beginning of the Indian Agriculture Census (1970).[37] In addition, landholdings are often divided into even smaller plots for reasons of land profile (e.g., terraces), soil suitability, or inheritance practices. This leads to actual plot sizes as small as 200m2
or smaller. Finally, different plots owned by the same farmer are rarely adjacent to each other, and are often separated by considerable distances (see Figure 2-1).
Field variability: Because adjacent plots are often owned by different farmers,
they are also planted at different times and with different crops. This makes it more difficult for a crop-specific pest or disease to move across a landscape. However, smaller plots make infestation of a farmer's entire field occur faster and allows less time to take countermeasures. This means that a pest or disease can infect an entire plot much faster, and the robustness to disturbances is generally lower than for a larger field. Thus disturbances must be detected more quickly in order to be useful to farmers. Coupled with the proportion of a typical farmer's income represented by each plot, the speed of disease spreading suggests a high update frequency is critical for any type of disturbance detection method for Indian smallholder farmers.
for smallholder farmers. By the nature of the varied crops and planting times in adjacent fields, diseases may have to "jump" across larger distances to infest the next field of its chosen crop. A coordinated wider view of more fields would allow advance notice to be given to famers whose plots are within a susceptible distance of currently-infected fields. This would allow for preventive measures to be taken, reducing risk of excessive losses.
Capital spending: Even though agriculture in India contributes 14% to the
coun-try's GDP of 1.9 trillion USD, and 11% of its exports, on the individual farm scale, the amount of money available for investment is too small for a farmer to purchase and operate his or her own remote sensing system.[16] Farmers earn an average of only 6,426 INR (108 USD) per month and, after consumptive expenses, retain only
513 INR (8.61 USD) per month for net investment in productive assets.[38 This
sug-gests that some form of collective method of financing, whether based in a public organization or private business, would be most suited to collecting, processing, and interpreting remote sensing data, and serving it to individual farmers.
Information needs: Indian farmers require a different approach to remote sensing
than farmers of larger fields in industrialized countries. Precision agriculture, as it is implemented on farms in industrialized countries, utilizes yield monitors, variable rate technologies, and remote sensing to allow a farmer to divide his or her large field into smaller management zones, and vary crop treatments over that large field.149] These techniques are used to optimize yield after the best advice for scouting, seeding, and planting have already been implemented. In contrast, Indian farm fields are often smaller than the management zones used by industrialized farms, and so require a different approach to optimizing their yields.
Indian farmers face a significant lack of reliable information and decision support in their day-to-day operations. The Ministry of Agriculture operates a farmer extension service, but its own report in 2012/2013 describes challenges including "understaffed extension," "insufficient planning at district level and below," and "lack of support to knowledge intensive alternatives for rain-fed farming."[15 Both literature and field research found that the government extension service is widely regarded as unable to
fulfill its mandate.[26] Other sources of information for farmers include direct contact with one of the state agriculture universities, which can only serve a tiny fraction of farmers; family or locally-shared techniques, which are not up-to-date without a connection to extension or research; and from input (pesticide or fertilizer) suppliers, who may have some training, but also have a conflict of interest in what advice to supply and products to recommend.
Small-plot farmers would be well-served by a single aggregate sensing of their field, rather than a high-resolution sensing method which divides their small plot into even smaller management zones. Unlike large industrialized farms that require remote sensing for the farmer to observe in-field variation, small plots can be easily inspected by the farmer on foot. Thus, farmers are often already intimately familiar with which parts of their field under-perform due to, for example, poor soil type or water drainage issues. While this variation could eventually be useful to detect from a remote sensing platform, the benefit of sub-plot resolution imagery is less clear than the first step of providing plot-specific sensing results.
Education levels: Farmer education levels in India are low, shown by the 2011
census' results of a 74% overall literacy rate (likely much lower among farmers).[20] While local experience is invaluable for farming, lack of education can prevent effective interpretation and application of remote sensing data. For this reason, any system which proposes to collect imagery for use by farmers must also include significant analysis and interpretation components. This paper considers primarily the technical aspects of data collection, however, the analysis and interpretation steps are just as important in the implementation of a remote sensing system to benefit smallholder farmers.
Multi-season planting: The climate in much of India allows two growing seasons
per year: Kharif (June-October) and Rabi (November-March). Particularly in areas in which irrigation water is accessible, two or even three different crops will be grown on the same plot of land in a single year. Because of the range of crops planted both on a single plot, and variation in crops in adjacent plots, the flexibility to modify detected wavebands and integrate new research in crops' spectroscopic responses is
important to offering the best data interpretations to farmers.
Airspace restriction: Many government aviation bodies were caught off-guard by
the rapid proliferation of low-cost commercially available UAVs in the past few years, and are still working to safely integrate their use into existing air traffic control laws and regulations. In India, the response of the Directorate General for Civil Aviation was to disallow any civilian use of UAVs while new guidelines were created.[39] At the time of this writing, a set of draft guidelines is being circulated for feedback which limits UAV flights to 500m from and in visual line-of-sight of the operator, which would severely limit a wide-area coverage mission.[40]
2.3.2
Multispectral imaging
A typical color camera captures light only in the visible spectrum, and detects three
components, or wavebands, of that light: red, green, and blue. These correlate most strongly with the types of sensors in our eyes, and thus the camera can reproduce images that look realistic to us. Multispectral cameras capture more and often nar-rower wavebands of light, including bands outside of the visible spectrum, allowing them to detect subject properties not visible to the naked eye. Figure 2-2 shows a few different multispectral cameras used for agriculture work with relevant specifications. Broadly, the cost of a camera increases significantly with the number of wavebands it detects and the number of pixels it can capture in a single image.
2.4
Remote sensing of agriculture
For remote sensing to be valuable to the agriculture sector, it must be able to detect properties of interest on the ground. While regular color imagery can be useful in giving farmers an overview of their fields, multispectral imagery offers more informa-tion, including detection of plant properties that can not be identified up close with the naked eye.
.R1ieaSende
Red Edge
IS.\\K'A
Lei'a
Geosystem
RCD3()
Megapixels
1.2
1.2
80
MuTIispeerral
4
6
4
wavebanb
FWHMNN
20
10
--
PH
Mass
170 g
2 k-
17
k)
Price
85.000
88.000
$1500.000
Figure 2-2: Three multispectral cameras used in aerial surveys. (a) Micasense Red-EdgeM, (b) high speed multispectral multi camera array (HSMMCA), constructed
by the author, and (b) Leica RCD30.
RCD30
HSMMCA
RedEdge
400
M
M
M
M
500
600
M
700
800
900
Wavelength (nm)
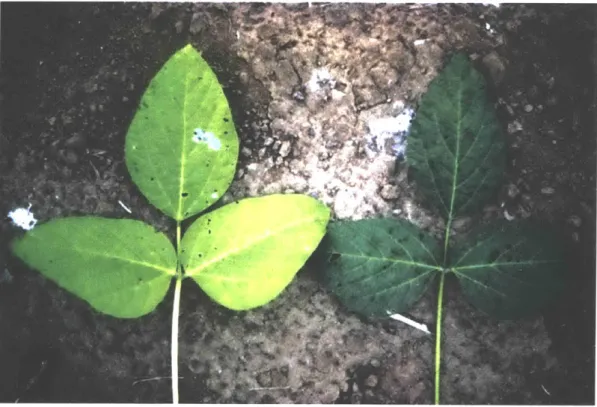
Figure 2-4: Nitrogen deficiency appears as a yellowing of the leaf, shown on the left in a soybean leaf [431.
2.4.1
Plant reflectance
Farmers have long been able to identify when their crops are not healthy by identifying the plants' response to stressors in their environment. For example, a yellowish plant leaf, as shown in Figure 2-4, is often a sign of a lack of nitrogen in the soil. A reduction in the green pigment chlorophyll causes the change, and can lead to reduced yields if not treated (usually an application of fertilizer).
Yellowing due to nitrogen deficiency is one example of a plant stress response that presents in the visible spectrum. Many more properties, however, are observable if measurements are taken beyond the visible spectrum. Figure 2-5 shows the reflectance signatures of tea plants grown under a variety of conditions for a range of wavelengths in the visible and near-infrared (NIR) parts of the electromagnetic spectrum. The red line, representing a healthy plant, absorbs the bulk of incident light in the visible waveband, between 400 and 700 nm. A small bump in reflectance at 550 nm indicates
.S-0.6 0.4 0.3 0.1
0.1
-TV-1 -BGP-133 -56P126 -YOW4-oww -Old -Flowering -Pruned -Sunlt --shode 400 500 600 700 800 900 1000Wavelength (nm)
Figure 2-5: Spectral signatures of tea grown under various conditions. Note in par-ticular the red (healthy) and yellow (diseased) tracks [48].
the typical green color of the chlorophyll in a healthy plant. The plant also reflects much more infrared light (above 700 nm) than visible light. In comparison to the healthy plant, the diseased plant, represented by the yellow line, reflects more light in the visible spectrum and less light in the infrared.
We have already seen how the change in reflectance in the visible spectrum can be correlated to plant health. The change in the infrared reflectance, however, is as large or larger than the change in the visible reflectance, and can be utilized to track changes in plant health sooner and more precisely than with the visible reflectance alone.
2.4.2
Crop indices
In 1975, Deering, et. al. published on the development of the Transformed Vegetation Index, which could be used to estimate green biomass in grazing areas from satellite
imagery [21]. The Transformed Vegetation Index is a normalized difference between an infrared waveband and a red waveband from the United States Geological Survey's Landsat satellite (bands 7 and 5), and was one of the first spectral indices designed specifically for detecting plants.
Since then, spectral crop indices have become an active area of agronomic research. As of August 2018, theIndex DataBase repository lists 519 vegetation indices for use with data from a wide range of sensors [8], and more are being developed [48].
Some indices under developement are aimed at detecting a particular disease in a particular crop, but many of them produce a general "crop vigor" metric. Two common versions of this crop vigor metric are the normalized difference vegetation index (NDVI) and the normalized difference red edge (NDRE) [29]
1501.
As described in Section 2.3, NDVI is the normalized difference of the reflectance values in the near infrared (REoo at wavelength 800nm) and red (RE680 at wavelength
680nm):
NDVI = RE - RE6 80 (2.2)
RE8oo + RE680
NDRE is also a normalized difference, but uses the red edge waveband (RE72 0 at
720nm) instead of the red band.
NDRE = RE800 - RE720 (2.3)
RE8oo + RE720
The NDRE is less susceptible than NDVI to saturation when plants have reached full leaf area coverage towards the end of the growing season.
These two indices will be used for the purposes of this thesis, with the assumption that an implemented remote sensing system can choose more focused indices and wavebands as needed.
2.5
Multispectral image registration
In computer vision, image registration is the alignment of two images of the same scene. The most common implementation of this is in the creation of panoramas, for example on a smartphone. For each consecutive pair of images captured, there must be some amount of overlap. Image registration is a set of techniques that allow the precise overlay and warping of one image (the source image) onto the other (the target image) such that the seam between the two images, when viewed by a person, is effectively eliminated. A number of algorithms, both patented and open-source, already exist to solve this problem for many situations. For example, the built-in panorama builder in a smartphone is fast enough to construct the panorama in near real-time from images as the camera captures them. This is an example of single-modality image registration, in which all of the images in question are captured from the same camera.
Multi-modal image registration has the same goals, except the source images come from different types of imaging systems, or cameras. This is common in medical imaging, where, for example, CT scans can be aligned with ultrasound imagery to enhance certain features in the images. The image registration studied in this thesis is a subset of multi-modal image registration called multispectral image registration. In this case, the two images being aligned are similar in format (2D imagery from an aerial point of view), but show the subject's response in different wavebands of light. Chapter 5 presents more detail on the images and methods of image registration used in this research.
Figure 2-6: Image registration is the alignment of two images relative to one another. In this case, (a) a source image captured in a 780nm waveband (near infrared) is registered to (b) a panchromatic satellite target image, to create (c) an output image in which the features from the input image are aligned in the reference frame of the target image.
Chapter 3
Platform choice
A parameterized numerical model is constructed to compare platform options for
collecting aerial imagery to support electronic agriculture information services in de-veloping countries like India. A sensitivity analysis shows that when UAVs are limited in flight altitude by regulations, the airspeed and altitude accessible to manned air-craft lead to a lower cost of operation at altitudes greater than 2000 ft altitude above ground level (AGL). If, however, the UAVs are allowed to fly higher, they become cost-competitive once again at approximately 1000 ft AGL or higher. Examination of assumptions in the model highlights two areas for additional technology devel-opment: baseline-dependent feature-based image registration to enable wider area coverage, and reflectance data precision for ratio-based agriculture indices.
3.0.1
Remote sensing platform options
As in most scientific imaging techniques, a fixed-focus camera lens system is used for this type of data collection. As the camera is flown at a higher AGL, the area captured in each frame increases. Thus, operational altitude, along with airspeed and flight endurance, plays a large role in the amount of area a platform can survey in a single mission. Three platform types are shown in Figure 3-1 and discussed here.
Satellites are probably the best-known earth observing remote sensing platform. Historically launched and managed by governments, the Landsat (US Geological
Sur-*100
Figure 3-1: Three platform types to consider for wide-area small-plot remote sensing: (a) satellites, (b) manned aircraft, and (c) UAVs. Images from http://landsat.usgs.gov/, Frank Schwichtenburg (Creative Commons Attribution-Share Alike 3.0 Unported), and http://www.sensefly.com/, respectively.
vey) and RESOURCESAT (Indian Space Research Organization) are long-running, medium-resolution earth observation platforms.[3J [61 In the last decade, private com-panies such as Digital Globe and Planet have started launching satellites and selling data as well.[2][4] Performance specifications in terms of resolution, return time, and waveband precision have improved significantly, and the cost to build and launch satellites continues to fall.
Manned aircraft have been in use in agriculture for decades to spray crops, but only recently began to be widely used for crop surveys. Companies such as Ceres Imaging and TerrAvion offer subscription packages for large farms for as little as 22
USD per acre (54 USD per ha) per season for weekly imagery, but this is still too
expensive an investment for small farmers who earn less than 2 USD per day. [1][7]
UAVs are the newest of the three platform types to become commercially avail-able. Both quadcopter and fixed-wing UAVs have been put to use in agriculture surveying, and are often aimed at crop consultants or tech-savvy farmers, rather than for operation by a larger service provider. Both in India and the US, federal aviation bodies are still sorting out regulations surrounding commercial use of UAVs, so the landscape of allowances for use of the tools is likely to change in the coming years.
Table 3.1: Design parameters uncovered during user research of Indian smallholder farmers. Each value is described as a limit, to indicate the minimum performance necessary.
property value
image resolution (GSD) 8m (maximum)
return time 2x per week
sensitivity capable of identifying crop stress (minimum) level of interpretation actionable recommendations
3.1
Design requirements
The above observations lead to a set of design requirements which differ from those of existing remote sensing systems. The properties outlined in Table 3.1 describe the conditions which must be met in order for the collected data to be applicable in the context of small Indian farms. These conditions will inform the design of a remote sensing system to serve these users.
Image resolution: Only those pixels whose ground footprint is entirely contained
in a single field are of value to small-plot farmers. This means that the pixels must be no larger than the smallest field, however there is no requirement for the pixel to be any smaller than the smallest field, as long as enough pixels can be accurately placed entirely within each field to be surveyed. We begin with an estimated pixel size of
50% of the plot width, such that if the smallest field is 16m on a side, this gives a
maximum pixel dimension of 8m. This value will be refined in later work in Chapter
4.
Return time: As described above, a short return time is necessary to identify
and alert the farmer to disturbances in their field before an entire plot is negatively impacted. This value can vary depending on the crop, types of disturbances, and sensitivity of the sensors.
Sensitivity: Remote sensing information, however it is collected, must be useful to
farmers. The first step in this is the ability to tell farmers that their crops are stressed before the farmers are capable of noticing the problem themselves. Other benefits of

![Figure 2-5: Spectral signatures of tea grown under various conditions. Note in par- par-ticular the red (healthy) and yellow (diseased) tracks [48].](https://thumb-eu.123doks.com/thumbv2/123doknet/13913568.449124/40.917.162.735.143.528/figure-spectral-signatures-various-conditions-ticular-healthy-diseased.webp)


