HAL Id: inserm-00348824
https://www.hal.inserm.fr/inserm-00348824
Submitted on 29 Sep 2010HAL is a multi-disciplinary open access archive for the deposit and dissemination of sci-entific research documents, whether they are pub-lished or not. The documents may come from teaching and research institutions in France or abroad, or from public or private research centers.
L’archive ouverte pluridisciplinaire HAL, est destinée au dépôt et à la diffusion de documents scientifiques de niveau recherche, publiés ou non, émanant des établissements d’enseignement et de recherche français ou étrangers, des laboratoires publics ou privés.
arterial PCO2 in acute lung injury.
Jérôme Devaquet, Björn Jonson, Lisbet Niklason, Anne-Gaëlle Si Larbi, Leif
Uttman, Jérôme Aboab, Laurent Brochard
To cite this version:
Jérôme Devaquet, Björn Jonson, Lisbet Niklason, Anne-Gaëlle Si Larbi, Leif Uttman, et al.. Ef-fects of inspiratory pause on CO2 elimination and arterial PCO2 in acute lung injury.. Journal of Applied Physiology, American Physiological Society, 2008, 105 (6), pp.1944-9. �10.1152/japplphys-iol.90682.2008�. �inserm-00348824�
Effects of inspiratory pause on CO2 elimination and arterial PCO2 in acute lung injury
Jérôme Devaquet1, Björn Jonson2, Lisbet Niklason2, Anne-Gaëlle Si Larbi1, Leif Uttman2, Jérôme Aboab1, Laurent Brochard1
1Medical Intensive Care Unit, AP-HP, Centre hospitalier Albert Chenevier - Henri Mondor,
INSERM Unit 841, Université Paris 12, Créteil, France
2Department of Clinical Physiology, University Hospital, Lund, Sweden
Running head: Effects of inspiratory pause on CO2 elimination in ALI
Correspondence: Björn Jonson
e-mail: bjorn.jonson@med.lu.se phone: +46 46173300
fax: +46 46151769
Department of Clinical Physiology University Hospital
SE-221 85 Lund Sweden
Abstract
A high respiratory rate associated with the use of small tidal volumes, recommended for acute lung injury (ALI), shortens time for gas diffusion in the alveoli. This may decrease CO2
elimination. We hypothesized that a post-inspiratory pause could enhance CO2 elimination and reduce PaCO2 by reducing dead space in ALI. In 15 mechanically ventilated patients with ALI and hypercapnia, a 20% post-inspiratory pause (Tp20) was applied during a period of 30 min between two ventilation periods without post-inspiratory pause (Tp0). Other parameters were kept unchanged. The single breath test for CO2 was recorded every 5 minutes to measure tidal CO2 elimination (VtCO2), airway dead space (VDaw) and slope of the alveolar plateau. PaO2, PaCO2, physiological and alveolar dead space (VDphys, VDalv) were determined at the end of each 30 minute period. The post-inspiratory pause, 0.7±0.2 s, induced on average less than 0.5 cm H2O of intrinsic PEEP. During Tp20, VtCO2 increased immediately by 28±10% (14±5 ml per breath compared to 11±4 for Tp0) and then decreased without reaching the initial value within 30 minutes. The addition of a post-inspiratory pause decreased significantly VDaw by 14% and VDphys by 11% with no change in VDalv. During Tp20, the slope of alveolar plateau initially fell to 65±10 % of baseline value and continued to decrease. Tp20 induced a 10±3% decrease in PaCO2 at 30 minutes (from 55±10 to 49±9 mmHg, p<0.001) with no significant variation in PaO2. Post-inspiratory pause has a significant influence on CO2 elimination when small tidal volumes are used during mechanical ventilation for ALI.
Keywords:
After transport of inspired gas through conducting airways, gas mixing in the respiratory zone by diffusion is time dependent. Therefore, a pause following gas insufflation may enhance gas exchange. Mechanical ventilators allow setting of a post-inspiratory pause time (Tp), often in percent of the breathing cycle.
During mechanical ventilation, prolonged Tp has been shown to enhance CO2 elimination (8, 10-12, 14, 21). In healthy pigs, a prolonged Tp increases CO2 elimination per tidal breath (VtCO2), by decreasing airway dead space (VDaw) (20). It was suggested that a prolongedTp increased the mean distribution time of inspired gas (MDT), so as to allow more time for diffusion of CO2 towards more central airways (7). MDT, further explained below, expresses the time available for enhanced diffusion between inhaled tidal volume and resident alveolar gas (2).
In pigs at health and with acute lung injury (ALI), Aström et al. recently found that a certain prolongation of MDT achieved with a longer Tp or with a longer inspiratory insufflation time had similar positive effects on CO2 exchange (4). They noted that a prolonged Tp had a larger effect on MDT than a similar prolongation of inspiratory insufflation time.
Recently Aboab et al. showed that a longerTp enhances CO2 exchange evaluated from volumetric capnography in ALI and acute respiratory distress syndrome (ARDS) (2). Positive effects were observed both with regards to a reduced VDaw and an elevated alveolar plateau. In their study Tp was only changed for one breath at a time and PaCO2 was not measured. The question was left open if the beneficial effect of Tp was of temporary nature. In pigs, Aström et al. showed that a shortened MDT led to an increase in PaCO2 that was nearly stable after 30 minutes. The study by Lessard et al. assessing CO2 elimination in patients with ARDS was not controlled for the eventual increase in auto-PEEP and hemodynamic effects induced by the extension of inspiratory time (12). Mercat et al. did so and found that in ARDS an extended
end-inspiratory pause led to lower PaCO2 by reducing physiological dead space but did not lead to improved PaO2. (14).
In this study, we hypothesized that in patients with ALI or ARDS ventilated with small tidal volume, a post-inspiratory pause applied over a sufficient period of time would enhance CO2 elimination and reduce PaCO2 by reducing airway dead space and ventilation/perfusion non-homogeneity at the alveolar level. By applying volumetric capnography during the whole study we aimed at increased understanding about mechanisms behind effects of a prolonged Tp and dynamics of CO2 exchange in ARDS.
PATIENTS AND METHODS Material
Fifteen consecutive hypercapnic mechanically ventilated patients (PaCO2≥45 mmHg, Table 1), were studied within 48 hours after they fulfilled criteria for ALI or ARDS (5).
Sedation was achieved by continuous infusion. Neuromuscular blockade was used in 3 patients. The level of sedation (modified Ramsay score≥5) and the absence of respiratory effort on the flow-time curve during an end-expiratory pause of 6 seconds were checked before the beginning of the study. The patients were studied in semi recumbent position when stable with respect to ventilation, hemodynamics and metabolism (constant temperature). Hemodynamic stability was defined as <15% variation of heart rate and mean arterial pressure between two sets of measurements performed 60 minutes and 10 minutes before the beginning of the study. During the study, ten patients were receiving vaso-active drugs (dobutamine and/or
epinephrine) at constant infusion rates. No fluid administration was made during the measurements.
If needed, endotracheal suction was performed well before the study and was not repeated during data collection. Clinically applied humidification/warming of inspired gas was
maintained (heat/moisture exchanger in 10 patients, heated humidifier in 5). All patients had an arterial line.
Exclusion criteria were: age<18 years, presence of a chest tube, intracranial disease, PaO2/FiO2<75 mmHg, [HCO3-]<18 mmol/l, known severe COPD (FEV1<50% predicted) or chronic respiratory insufficiency with long term oxygen therapy. High age of the patients and, as will be shown, high VDphys indicate a group of patients with a poor prognosis, in accordance with a 53% mortality rate (15).
Patients were ventilated in volume controlled mode with a constant flow (ServoVentilator 900C with a mainstream CO2 Analyzer 930, Siemens-Elema, Solna, Sweden). Tidal volume (VT) was 7±1 ml/kg of predicted body weight. At baseline, set inspiratory time (Ti) was 20% and Tp 0%. Applied positive end expiratory pressure (PEEPe) varied from 5 to 14 cmH2O (Table 2). The ventilator/computer system used for data recording has previously been described (16, 19). Signals representing airway flow, pressure and CO2 were fed to the A/D converter of a personal computer and sampled at 100 Hz. Compliance of the ventilator tubing was 1.7 ml/cmH2O. Tracheal tube, CO2 analyzer and heat and moisture exchanger dead space were measured in vitro (apparatus dead space volume was 86 ml if a heat and moisture
exchanger was used, 41 ml for a heated humidifier). The Ethics Committee of French Intensive Care Society approved the protocol. Patients’ next of kin were informed of the study protocol and gave their consent.
Before the study, it was ensured that the extended Tp from 0% to 20% of total breathing cycle duration did not increase intrinsic PEEP by more than 1 cmH2O. Insufflation time (20%), inspiratory flow, respiratory rate, VT, FiO2 and PEEPe were kept constant throughout the study. Three periods were recorded. During the initial period of 30 min, Tp was set to 0%. Tp was changed to 20% for the second period. During the last period Tp was reset to 0 %. The periods were denoted Tp0init, Tp20 and Tp0late, respectively. Referring to Fig. 3, at 35 minutes, the knob on the ventilator panel for setting Tp was reset from 0 to 20 %. Thereby, a postinspiratory pause was introduced already for the ensuing inspiration. At 70 minutes, the knob was turned back to 0 % for recording of data for further 30 minutes. Signal recordings were performed during every 5 minutes. At 35 and 70 minutes the very first breaths during Tp20 and Tp0late were recorded. Ten breaths were analyzed during each recording. Blood gas analysis was performed using GEM Premier 3000 (Instrumentation Laboratory, Barcelona, Spain). Measurements during Tp0init are denoted baseline values.
Data analysis
Data for airway flow, pressure and CO2 were transferred to a spreadsheet for Excel 2002 (Microsoft Corp., Redmond, WA, USA) and analyzed according to Uttman et al. (19). The expiratory flow signal was normalized by a correction factor so that expired tidal volume equaled the inspired measured at normal breaths. Flow rate and its integral volume were then corrected for gas compression in tubing and adjusted to body temperature and pressure, saturated with water vapor (BTPS). Accordingly, tidal volume was measured as the volume really delivered to the patient, corrected for gas compression in tubing. An unforeseen problem, further discussed below, was that during Tp20, the pressure drop at the end of insufflation caused redistribution from tubing to the lung. Thereby, VT increased by about 13 ml or 2.6 %. Partial pressure of CO2 at airway opening was calculated at actual barometric pressure.
Distribution and diffusion of tidal gas in the lung periphery starts at the moment when the interface between ‘fresh’ inspired gas and ‘used’ alveolar gas reaches the respiratory zone of the lung. It ends abruptly when the interface is pushed back into the airways at the start of
expiration. Therefore, MDT is the interval from mean time of arrival of partitions of tidal volume in the respiratory zone until start of expiration. It expresses the time available for enhanced diffusion between inhaled tidal volume and resident alveolar gas, as mathematically described by Aboab et al. (2).
Further analysis was based upon the complete single breath test for CO2 (SBT-CO2), which is a loop comprising an expiratory and an inspiratory limb (6). VtCO2 corresponds to the area within the loop (Fig. 1).
Different parameters related to dead space (VD) were calculated from the SBT-CO2. Mean values of 10 breaths were used. Physiologic dead space(VDphys) was calculated as follows.
VDphys% = (PaCO2 · VT – loop area A) / (PaCO2 · VT) · 100
VDphys% was calculated from signal recordings at the end of each period and simultaneous blood gas tests. Airway dead space distal to the CO2 sensor (VDaw) was calculated as the volume at which maximum slope of the SBT-CO2 was measured. Carbon dioxide re-inspired from airway dead space proximal to the CO2 sensor (VDaw,prox) corresponds to area C (Fig. 1).
VDaw,prox% = area C / (PaCO2 · VT) · 100 Alveolar dead space, VDalv, was calculated as follows.
VDalv = VDphys – (VDaw,prox + VDaw)
The slope of the alveolar plateau (Slope) was determined at the midpoint of the alveolar from a logarithmic equation describing PCO2 over volume (Fig. 1) (3).
Upon adding the post-inspiratory pause, the change during the very first 8 breaths in VtCO2, Slope, MDT and VDaw are denoted in ∆VtCO2, ∆Slope, ∆MDT and ∆VDaw, respectively. The change of PaCO2 between the ends of Tp0init and Tp20 periods is denoted ∆PaCO2.
Statistical methods
Data are presented as mean and SD or SE as specified. Friedman’s non parametric test was used to study the relationship between the quantitative variables at different periods.
Differences at the level of p<0.05 were considered statistically significant. For statistically significant differences, a Wilcoxon matched pairs signed-rank test was done to compare variables at Tp0init or Tp0late and Tp20. Spearman correlation coefficient was used to compare ∆VtCO2, ∆Slope, ∆MDT, ∆VDaw and ∆PaCO2. Correlation coefficients were considered statistically significant at the 0.05 level and linear regression was used to establish the relationship between ∆VDaw and ∆PaCO2.
RESULTS
Ventilation and hemodynamics
VT was 489±63 ml, corresponding to 7±1 ml/kg of predicted body weight. Peak inspiratory flow rate was 0.7±0.2 l/s. During Tp20, airway pressure fell by 9.6 cmH20 during the pause (from peak pressure to plateau pressure, Table 2). Then, tube decompression led to an increase of VT, on average by 13±6 ml (2.6%) (Table 2). MDT changed from 0.21±0.07 s during Tp0init and Tp0late, to 0.88±0.24 s during Tp20.
Mean airway pressure was at Tp0 12.4±2.7 cmH2O and at Tp20 15.1±2.9 cmH2O (p<0.01). Total PEEP increased by on average 0.4 cmH20 during Tp20 because of a slight but significant increase in intrinsic PEEP (Table 2). Resistance and compliance of the respiratory system was
at Tp20 13.5±2.8 cmH2O/(l/s) and 44.0±11.4 ml/cmH2O, respectively, yielding an average time constant of 0.59 s. The expiratory time for those 7 subjects who had a respiratory rate above 18 was at Tp20 1.8±0.2 s, i.e. about 3 time constants. Accordingly, expiration was long enough to allow near cessation of expiratory flow and low values of auto-PEEP also during Tp20 (Fig. 2). Hemodynamics remained constant during all periods (Table 2).
CO2 elimination and dead space
During Tp20, VtCO2 increased immediately by 28% (14±5 ml) compared to baseline during Tp0init and then decreased without reaching baseline within the Tp20 period (Fig. 3). During Tp0late, VtCO2 first fell suddenly to below baseline and then returned to baseline.
During the whole Tp20, VDaw was reduced by 28 ml (p<0.0001, Table 2, Fig. 3). The decrease was 2.2 times higher than the increase in VT. During Tp0late, VDaw equaled that during Tp0init (Fig. 3). At the end of Tp20, VDphys was 11±4% lower than at Tp0 while VDalv was unchanged (Table 2).
During Tp20, the slope of the alveolar plateau fell immediately to 65±10 % of baseline value (35±19 vs 53±23 mmHg/L) and then slowly decreased further to 32 ±17 mmHg/L (Fig. 3 and 4). During Tp0late the slope returned to baseline.
Arterial blood gases
During Tp20, PaCO2 fell by 10±3% (from 55±10 to 49±9 mmHg; p<0.0001) (Fig. 5, Table 2). During Tp0late, it returned to baseline. No significant change in PaO2 was observed. The change in PaCO2 from baseline until end of Tp20 (∆PaCO2, mmHg) correlated with the immediate change in VDaw when the pause was instituted (∆VDaw, ml) (rho =0.60, p<0.02).
No correlations were found between ∆PaCO2 and ∆VtCO2, ∆Slope or ∆MDT.
A comparison was made between 8 patients with respiratory rate ≤18 and 7 patients with rates
>18. During Tp20, in both groups, PEEPtot increased by 0.4 cmH2O, PaCO2 decreased by 6 mmHg and VDaw by 28 ml.
DISCUSSION
During volume controlled ventilation with small tidal volume and constant inspiratory flow in hypercapnic patients with ALI or ARDS, this study shows that a 20% post-inspiratory pause time leads to a 10% decrease in PaCO2 after 30 minutes, secondary to enhanced CO2 elimination. The main explanation of increased CO2 elimination is lower VDaw.
Our results agree with previous findings that a post-inspiratory pause enhances CO2 elimination in healthy or surfactant depleted animals (4, 10, 11, 20) and with those obtained in surfactant depleted pigs in which inspiration at pressure controlled ventilation was prolonged (13). They also agree with results in patients with ALI/ARDS (2, 8, 12, 14).
The main effect of the post-inspiratory pause on CO2 elimination reflects an instantaneous and continuous reduction of VDaw that was immediately abolished during Tp0late. According to the MDT concept this reflects enhanced diffusion of CO2 from alveoli towards airways during the pause. As the decrease of VDaw was more than two times larger than the small increase in VT, the effect on PaCO2 was about two thirds caused by the change in VDaw. As further discussed below the ultimate changes in PaCO2 could not be estimated during the test periods of 30
minutes. During Tp20, decompression of gas in the tubing during the pause reflects the product between (Ppeak-Pplat) and tube compliance and was calculated to 16 ml. The increase in VT during Tp20 can accordingly be fully explained by gas decompression. The lower slope of the alveolar plateau during Tp20 indicates that a more even alveolar ventilation/perfusion
relationship may have contributed to enhanced CO2 elimination. The slope of the alveolar plateau mainly reflects non-synchronous emptying of lung compartments with different ventilation/perfusion ratios (7). The immediate and nearly stable drop in slope during Tp20, Fig. 3, suggests more even alveolar ventilation due to diffusion within the alveolar zone that may have further contributed to enhanced CO2 elimination during Tp20. In humans,
equilibration through collateral channels may play a role in this. However, Uttman et al. made similar observations in healthy pigs, which do not have collaterals (20).
VtCO2 at constant respiratory rate returned during Tp0late towards baseline as a sign of constant metabolic rate. Then, during Tp20, VtCO2 should, after the initial increase, return towards the baseline that represents metabolic rate. In patients without significant
cardiopulmonary disease, when ventilation was decreased by 10%, a new steady state was established along a mono-exponential path with a time constant of about 35 minutes (17). In the present study, the return towards baseline during Tp20 was far from complete (Fig. 3). Initially during that period VtCO2 fell rapidly and then very slowly. The reasonable explanation is that CO2 stores in the body of this group of patients are large and distributed among compartments with very different time constants for equilibration of CO2. Severe cardiopulmonary disease, increased extravascular liquid space and poor circulation in peripheral edematous regions are likely causes of slow equilibration of CO2. Similar conclusions have previously been drawn by Henneberg et al. (9).
During Tp20, the fall in PaCO2 of 10 % is the result of enhanced CO2 elimination as expressed by enhanced VtCO2. However, the full effect on PaCO2 of a change in efficient alveolar ventilation can not be observed until CO2 stores in the body have been equilibrated as discussed by Taskar et al. (17). At completely steady state, the change in PaCO2 should equal the change in initial effect on rate of CO2 elimination, in this study represented by change in VtCO2 by 28 %. That VtCO2 did not return to baseline indicates that a steady state was not achieved
during Tp20, as discussed. Accordingly, the observed change in PaCO2 probably underestimates the full effect of a post-inspiratory pause of 20%. In order to limit confounding factors due to spontaneous changes of metabolism, hemodynamic and other physiological parameters, the study periods were limited to 30 minutes as a compromise against a desirable steady state during each period. Aström et al. observed in pigs at health and with a model of ALI that after 30 minutes of ventilation with a different MDT, PaCO2 changed by 0.75 of what was expected on the basis of immediate change in VtCO2 (4). In the present study this fraction was only 10/28 i.e. 0.36. The difference may represent a much slower equilibration time in the gravely sick patient population. In the study of Mercat et al. PaCO2 changed by only 5 % when the pause was prolonged although an equilibration time of 1 hour left more time available for equilibration of CO2 stores in the body (14). In their study we estimate that MDT doubled from about 0.6 s to 1.3 s at prolonged Tp, while MDT in ours increased more than fourfold, from 0.21 to 0.88. The lower change in PaCO2 in Mercat’s study can be explained by the lower relative change in MDT considering that the effect of variable MDT according to Aström et al. is non-linear, i.e. more important towards lower MDT values.
At Tp20, shortening of expiration time from 80 % to 60 % led to a small but significant increase in intrinsic PEEP (<0.5 cmH2O). PEEP tends to increase VDaw and may hamper CO2 elimination through hemodynamic effects. Increased PEEP increases in itself VDaw due to airway distension (6, 18). Accordingly, the small increase in total PEEP might have attenuated the observed decrease in VDaw and enhanced CO2 elimination at Tp20. In spite of higher total PEEP at Tp20, peak pressure remained unchanged. This might indicate that some recruitment took place during Tp20. However, PaO2 did not increase as was also observed in the study of Mercat et al. (14). One may speculate that positive effects of recruitment were balanced by negative effects caused by diversion of blood flow to collapsed lung, thereby increasing shunt.
The two groups with RR≤18 and RR>18 showed equal response to a prolonged pause which finding may reflect a low variation in RR in the present material.
In this experimental study, we aimed at unchanged tidal volume and used CO2 turnover PaCO2 as indicators of more efficient ventilation caused by a postinspiratory pause. In clincal practise, the utility of more efficient gas exchange would rather be to decrease tidal volume for enhanced lung protection. This could, depending on circumstances, be applied so as to either reduce peak pressure to limit barotrauma or to increase PEEP to stabilize lung recruitment. Notably, a postinspiratory pause is one of several options to lower VT. One is an increase in respiratory rate. At high rates, MDT becomes shorter. Aström showed a steep decline in CO2 exchange at low MDT values (4). At high respiratory rates, it may, therefore be important to use a pause to adequately prolong MDT.
In conclusion:
Post-inspiratory pause has a great influence on CO2 exchange not only for breaths immediately following resetting. A prolongation of Tp leads to a decrease of PaCO2 as hypothesized. The effects of Tp are mostly due to diffusion of CO2 into airways but also to a more homogenous ventilation/perfusion at the alveolar level. The mode of inspiratory gas delivery should be taken into account e.g. in the context of low tidal volume ventilation (1). The ancillary observation of a long equilibrium time for PaCO2 in ALI, indicating that 30 minutes is too short for full appreciation of the effect on PaCO2 of a change in ventilation, merits further studies.
GRANTS
This study was supported by the Swedish Heart Lung Foundation and was financed by Chancellerie des Universités de Paris.
REFERENCES
1. ARDS NETWORK. Ventilation with lower tidal volumes as compared with traditional tidal volumes for acute lung injury and the acute respiratory distress syndrome. The Acute Respiratory Distress Syndrome Network. N Engl J Med 342: 1301-1308, 2000. 2. Aboab J, Niklason L, Uttman L, Kouatchet A, Brochard L, and Jonson B. CO2
elimination at varying inspiratory pause in acute lung injury. Clin Physiol Funct
Imaging 27: 2-6, 2007.
3. Aström E, Niklason L, Drefeldt B, Bajc M, and Jonson B. Partitioning of dead space--a method and reference values in the awake human. Eur Respir J 16: 659-664, 2000. 4. Aström E, Uttman L, Niklason L, Aboab J, Brochard L, and Jonson B. Pattern of inspiratory gas delivery affects CO2 elimination in health and after acute lung injury.
Intensive care medicine 34: 377-384, 2008.
5. Bernard GR, Artigas A, Brigham KL, Carlet J, Falke K, Hudson L, Lamy M, Legall JR, Morris A, and Spragg R. The American-European Consensus Conference on ARDS. Definitions, mechanisms, relevant outcomes, and clinical trial coordination.
Am J Respir Crit Care Med 149: 818-824, 1994.
6. Beydon L, Uttman L, Rawal R, and Jonson B. Effects of positive end-expiratory pressure on dead space and its partitions in acute lung injury. Intensive care medicine 28: 1239-1245, 2002.
7. Fletcher R, Jonson B, Cumming G, and Brew J. The concept of deadspace with special reference to the single breath test for carbon dioxide. British journal of
anaesthesia 53: 77-88, 1981.
8. Fuleihan SF, Wilson RS, and Pontoppidan H. Effect of mechanical ventilation with end-inspiratory pause on blood-gas exchange. Anesth Analg 55: 122-130, 1976. 9. Henneberg S, Söderberg D, Groth T, Stjernstrom H, and Wiklund L. Carbon
dioxide production during mechanical ventilation. Crit Care Med 15: 8-13, 1987. 10. Knelson JH, Howatt WF, and DeMuth GR. Effect of respiratory pattern on alveolar
gas exchange. J Appl Physiol 29: 328-331, 1970.
11. Lachmann B, Jonson B, Lindroth M, and Robertson B. Modes of artificial
ventilation in severe respiratory distress syndrome. Lung function and morphology in rabbits after wash-out of alveolar surfactant. Crit Care Med 10: 724-732, 1982.
12. Lessard MR, Guerot E, Lorino H, Lemaire F, and Brochard L. Effects of pressure-controlled with different I:E ratios versus volume-pressure-controlled ventilation on respiratory mechanics, gas exchange, and hemodynamics in patients with adult respiratory distress syndrome. Anesthesiology 80: 983-991, 1994.
13. Lichtwarck-Aschoff M, Markstrom AM, Hedlund AJ, Nielsen JB, Nordgren KA, and Sjöstrand UH. Oxygenation remains unaffected by increased
inspiration-to-expiration ratio but impairs hemodynamics in surfactant-depleted piglets. Intensive care
medicine 22: 329-335, 1996.
14. Mercat A, Diehl JL, Michard F, Anguel N, Teboul JL, Labrousse J, and Richard C. Extending inspiratory time in acute respiratory distress syndrome. Crit Care Med 29: 40-44, 2001.
15. Nuckton TJ, Alonso JA, Kallet RH, Daniel BM, Pittet JF, Eisner MD, and Matthay MA. Pulmonary dead-space fraction as a risk factor for death in the acute respiratory distress syndrome. N Engl J Med 346: 1281-1286, 2002.
16. Svantesson C, and Jonson B. The static pressure-volume relationship of the respiratory system determined with a computer-controlled ventilator. Clin Physiol Funct Imaging 17: 419-430, 1997.
17. Taskar V, John J, Larsson A, Wetterberg T, and Jonson B. Dynamics of carbon dioxide elimination following ventilator resetting. Chest 108: 196-202, 1995. 18. Tusman G, Suarez-Sipmann F, Bohm SH, Pech T, Reissmann H, Meschino G,
Scandurra A, and Hedenstierna G. Monitoring dead space during recruitment and PEEP titration in an experimental model. Intensive care medicine 32: 1863-1871, 2006. 19. Uttman L, and Jonson B. Computer-aided ventilator resetting is feasible on the basis
of a physiological profile. Acta Anaesthesiol Scand 46: 289-296, 2002. 20. Uttman L, and Jonson B. A prolonged postinspiratory pause enhances CO2
elimination by reducing airway dead space. Clin Physiol Funct Imaging 23: 252-256, 2003.
21. Wolff G, Brunner J, Weibel W, and Bowes C. Alveolar efficiency for CO2
elimination and series dead space volume, both are affected by the ventilatory pattern.
Figure legends
Fig. 1. The single breath test for carbon dioxide (SBT-CO2) depicts partial pressure of CO2 at airway opening and PaCO2 (horizontal dotted line) versus volume. Area A within the loop represents the amount of CO2 eliminated during the breath (VtCO2). Vertical interrupted line indicates airway dead space distal to the CO2 sensor (VDaw). Area C reflects CO2 re-inspired from y-piece and tubing and represents proximal airway dead space (VDaw,prox). Area B between the alveolar plateau and PaCO2 illustrates alveolar dead space. The alveolar plateau was
characterized by the equation PCO2 = b + m(lnV). Its slope was determined at its mid-point. Fig. 2. Representative tracings from single breaths of airway flow, pressure (Paw) and partial pressure of CO2 at the y-piece in mainstream CO2 analyzer, PCO2. Thin black lines represent Tp0 and thicker grey lines Tp20.
Fig. 3 Diamonds represent mean values for the 15 patients at 5 minutes interval throughout the study. At 35 min the knob on the ventilator panel for setting Tp was reset from 0 to 20 % to start Tp20. At 70 minutes Tp0late was started by turning the knob back to 0 %. Times for resetting are indicated with vertical interrupted lines. Data at 35 and 70 minutes represent the first breaths during Tp20 and Tp0late.
Panel A. Tidal elimination of CO2 (VtCO2) against time. For the 15 patients, diamonds and thin lines represent percent of mean value during Tp0init ±2 SE.
Panel B. Airway dead space (VDaw) against time in each subject, patients ventilated with heated humidifiers (continuous lines) or heat and moisture exchangers (broken lines). Diamonds shows mean VDaw.
Panel C. Slope of the alveolar plateau against time. For the 15 patients diamonds and thin lines represent percent of mean value during Tp0init ±2 SE.
Fig. 4. Single breath test for CO2 from a representative patient (n° 2) with and without pause recorded at the end of initial period of zero pause (Tp0init, continuous line) and after 10 and 30 min at Tp20, (dotted and interrupted lines, respectively). At Tp0init, airway dead space (VDaw, vertical lines) was larger and the slope of the alveolar plateau steeper, while the area within the loop representing VtCO2 was smaller.
Fig. 5. Individual values and mean ± SE of PaCO2 after mechanical ventilation with or without a post-inspiratory pause of 20% (Tp0init, Tp20, and Tp0late).
Table legends
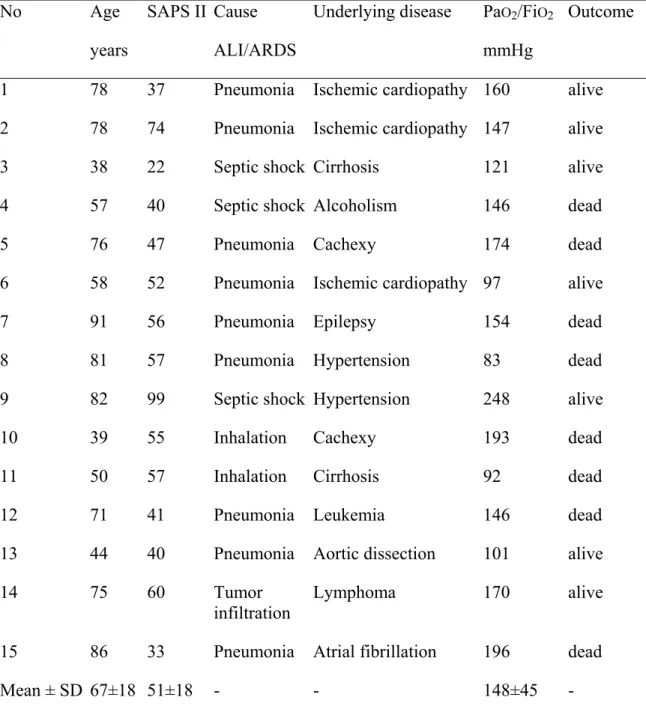
Table 1. Characteristics of the 15 study patients with acute lung injury/acute respiratory distress syndrome.
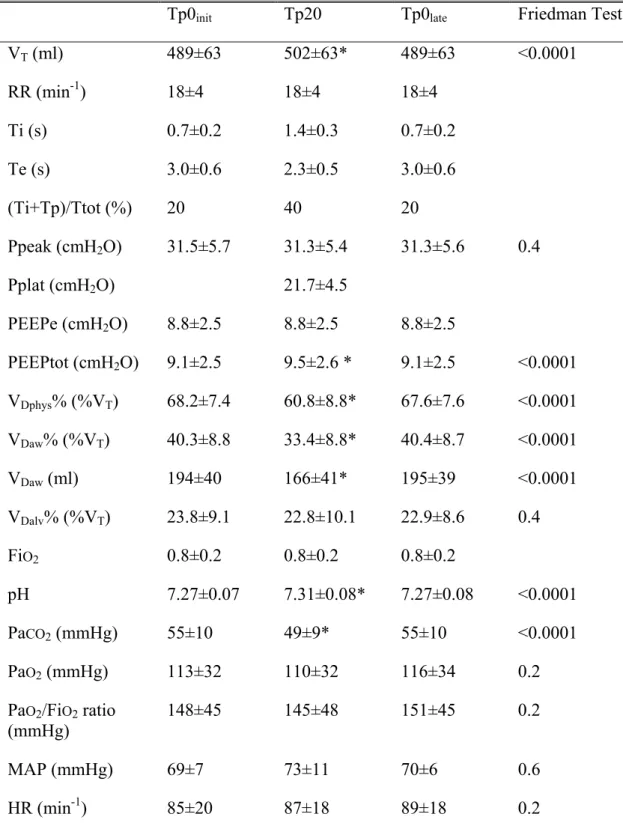
Table 2. Ventilatory and respiratory mechanical parameters, dead spaces, blood gas and hemodynamic parameters (mean±SD) at the end of each study period.
Table 1. Characteristics of the 15 study patients with acute lung injury/acute respiratory distress syndrome. No Age years SAPS II Cause ALI/ARDS
Underlying disease PaO2/FiO2 mmHg
Outcome
1 78 37 Pneumonia Ischemic cardiopathy 160 alive
2 78 74 Pneumonia Ischemic cardiopathy 147 alive
3 38 22 Septic shock Cirrhosis 121 alive
4 57 40 Septic shock Alcoholism 146 dead
5 76 47 Pneumonia Cachexy 174 dead
6 58 52 Pneumonia Ischemic cardiopathy 97 alive
7 91 56 Pneumonia Epilepsy 154 dead
8 81 57 Pneumonia Hypertension 83 dead
9 82 99 Septic shock Hypertension 248 alive
10 39 55 Inhalation Cachexy 193 dead
11 50 57 Inhalation Cirrhosis 92 dead
12 71 41 Pneumonia Leukemia 146 dead
13 44 40 Pneumonia Aortic dissection 101 alive
14 75 60 Tumor
infiltration Lymphoma 170 alive
15 86 33 Pneumonia Atrial fibrillation 196 dead
Mean ± SD 67±18 51±18 - - 148±45 -
SAPS – simplified acute physiology score; ALI – acute lung injury; ARDS – acute respiratory distress syndrome
Table 2. Ventilatory and respiratory mechanical parameters, dead spaces, blood gas and hemodynamic parameters (mean±SD) at the end of each study period.
Tp0init Tp20 Tp0late Friedman Test
VT (ml) 489±63 502±63* 489±63 <0.0001 RR (min-1) 18±4 18±4 18±4 Ti (s) 0.7±0.2 1.4±0.3 0.7±0.2 Te (s) 3.0±0.6 2.3±0.5 3.0±0.6 (Ti+Tp)/Ttot (%) 20 40 20 Ppeak (cmH2O) 31.5±5.7 31.3±5.4 31.3±5.6 0.4 Pplat (cmH2O) 21.7±4.5 PEEPe (cmH2O) 8.8±2.5 8.8±2.5 8.8±2.5 PEEPtot (cmH2O) 9.1±2.5 9.5±2.6 * 9.1±2.5 <0.0001 VDphys% (%VT) 68.2±7.4 60.8±8.8* 67.6±7.6 <0.0001 VDaw% (%VT) 40.3±8.8 33.4±8.8* 40.4±8.7 <0.0001 VDaw (ml) 194±40 166±41* 195±39 <0.0001 VDalv% (%VT) 23.8±9.1 22.8±10.1 22.9±8.6 0.4 FiO2 0.8±0.2 0.8±0.2 0.8±0.2 pH 7.27±0.07 7.31±0.08* 7.27±0.08 <0.0001 PaCO2 (mmHg) 55±10 49±9* 55±10 <0.0001 PaO2 (mmHg) 113±32 110±32 116±34 0.2 PaO2/FiO2 ratio (mmHg) 148±45 145±48 151±45 0.2 MAP (mmHg) 69±7 73±11 70±6 0.6 HR (min-1) 85±20 87±18 89±18 0.2
Values are mean±SD, *p=0.001 Tp20 vs Tp0init or Tp0late, VT – tidal volume, RR – respiratory rate, Ti–inspiratory time including post-inspiratory pause, Te–expiratory time; Ti+Tp –
insufflation and post-inspiratory pause as percent of the breathing cycle, PEEPe – external positive end expiratory pressure, PEEPtot – external positive end expiratory pressure + intrinsic positive end expiratory pressure, VDphys% – physiological dead space in percent of VT, VDaw% – airways dead space in percent of VT, VDalv% – alveolar dead space in percent of VT, FiO2 – fraction of inspired oxygen, MAP – mean arterial pressure, HR- heart rate.
No Age years
SAPS II Cause ALI/ARDS
Underlying disease PaO2/FiO2 mmHg
Outcome
1 78 37 Pneumonia Ischemic cardiopathy 160 alive
2 78 74 Pneumonia Ischemic cardiopathy 147 alive
3 38 22 Septic shock Cirrhosis 121 alive
4 57 40 Septic shock Alcoholism 146 dead
5 76 47 Pneumonia Cachexy 174 dead
6 58 52 Pneumonia Ischemic cardiopathy 97 alive
7 91 56 Pneumonia Epilepsy 154 dead
8 81 57 Pneumonia Hypertension 83 dead
9 82 99 Septic shock Hypertension 248 alive
10 39 55 Inhalation Cachexy 193 dead
11 50 57 Inhalation Cirrhosis 92 dead
12 71 41 Pneumonia Leukemia 146 dead
13 44 40 Pneumonia Aortic dissection 101 alive
14 75 60 Tumor
infiltration
Lymphoma 170 alive
15 86 33 Pneumonia Atrial fibrillation 196 dead
Mean ± SD 67±18 51±18 - - 148±45 -
SAPS – simplified acute physiology score; ALI – acute lung injury; ARDS – acute respiratory distress syndrome
Tp0init Tp20 Tp0late Friedman Test VT (ml) 489±63 502±63* 489±63 <0.0001 RR (min-1) 18±4 18±4 18±4 Ti (s) 0.7±0.2 1.4±0.3 0.7±0.2 Te (s) 3.0±0.6 2.3±0.5 3.0±0.6 (Ti+Tp)/Ttot (%) 20 40 20 Ppeak (cmH2O) 31.5±5.7 31.3±5.4 31.3±5.6 0.4 Pplat (cmH2O) 21.7±4.5 PEEPe (cmH2O) 8.8±2.5 8.8±2.5 8.8±2.5 PEEPtot (cmH2O) 9.1±2.5 9.5±2.6 * 9.1±2.5 <0.0001 VDphys% (%VT) 68.2±7.4 60.8±8.8* 67.6±7.6 <0.0001 VDaw% (%VT) 40.3±8.8 33.4±8.8* 40.4±8.7 <0.0001 VDaw (ml) 194±40 166±41* 195±39 <0.0001 VDalv% (%VT) 23.8±9.1 22.8±10.1 22.9±8.6 0.4 FiO2 0.8±0.2 0.8±0.2 0.8±0.2 pH 7.27±0.07 7.31±0.08* 7.27±0.08 <0.0001 PaCO2(mmHg) 55±10 49±9* 55±10 <0.0001 PaO2(mmHg) 113±32 110±32 116±34 0.2 PaO2/FiO2 ratio (mmHg) 148±45 145±48 151±45 0.2 MAP (mmHg) 69±7 73±11 70±6 0.6 HR (min-1) 85±20 87±18 89±18 0.2
Values are mean±SD, *p=0.001 Tp20 vs Tp0init or Tp0late, VT – tidal volume, RR – respiratory rate, Ti–inspiratory time including post-inspiratory pause, Te–expiratory time; Ti+Tp –
insufflation and post-inspiratory pause as percent of the breathing cycle, PEEPe – external positive end expiratory pressure, PEEPtot – external positive end expiratory pressure + intrinsic positive end expiratory pressure, VDphys% – physiological dead space in percent of VT, VDaw% – airways dead space in percent of VT, VDalv% – alveolar dead space in percent of VT, FiO2 – fraction of inspired oxygen, MAP – mean arterial pressure, HR- heart rate.
0 10 20 30 40 0 100 200 300 400 500 Volume (m l) PCO 2 (mmHg)
A
C
40 50 60 70 Tp0init Tp20 Tp0late PaCO 2 (mmHg)