HAL Id: hal-00330069
https://hal.archives-ouvertes.fr/hal-00330069
Submitted on 3 Jul 2006
HAL is a multi-disciplinary open access
archive for the deposit and dissemination of
sci-entific research documents, whether they are
pub-lished or not. The documents may come from
teaching and research institutions in France or
abroad, or from public or private research centers.
L’archive ouverte pluridisciplinaire HAL, est
destinée au dépôt et à la diffusion de documents
scientifiques de niveau recherche, publiés ou non,
émanant des établissements d’enseignement et de
recherche français ou étrangers, des laboratoires
publics ou privés.
polar vortex
M. Maturilli, Federico Fierli, V. Yushkov, A. Lukyanov, Sergey Khaykin,
Alain Hauchecorne
To cite this version:
M. Maturilli, Federico Fierli, V. Yushkov, A. Lukyanov, Sergey Khaykin, et al.. Stratospheric water
vapour in the vicinity of the Arctic polar vortex. Annales Geophysicae, European Geosciences Union,
2006, 24 (6), pp.1511-1521. �hal-00330069�
Ann. Geophys., 24, 1511–1521, 2006 www.ann-geophys.net/24/1511/2006/ © European Geosciences Union 2006
Annales
Geophysicae
Stratospheric water vapour in the vicinity of the Arctic polar vortex
M. Maturilli1, F. Fierli2, V. Yushkov3, A. Lukyanov3, S. Khaykin3, and A. Hauchecorne4 1Alfred Wegener Institute for Polar and Marine Research, Potsdam, Germany
2Institute for Atmospheric Sciences and Climate, CNR, Italy 3Central Aerological Observatory, Moscow, Russia
4Service D’A´eronomie du CNRS, Verri`eres-le-Buisson, France
Received: 28 July 2005 – Revised: 13 April 2006 – Accepted: 19 April 2006 – Published: 3 July 2006
Abstract. The stratospheric water vapour mixing ratio
in-side, outin-side, and at the edge of the polar vortex has been accurately measured by the FLASH-B Lyman-Alpha hygro-meter during the LAUTLOS campaign in Sodankyl¨a, Fin-land, in January and February 2004. The retrieved H2O
pro-files reveal a detailed view on the Arctic lower stratospheric water vapour distribution, and provide a valuable dataset for the validation of model and satellite data. Analysing the mea-surements with the semi-lagrangian advection model MI-MOSA, water vapour profiles typical for the polar vortex’ interior and exterior have been identified, and laminae in the observed profiles have been correlated to filamentary struc-tures in the potential vorticity field. Applying the validated MIMOSA transport scheme to specific humidity fields from operational ECMWF analyses, large discrepancies from the observed profiles arise. Although MIMOSA is able to repro-duce weak water vapour filaments and improves the shape of the profiles compared to operational ECMWF analyses, both models reveal a dry bias of about 1 ppmv in the lower strato-sphere above 400 K, accounting for a relative difference from the measurements in the order of 20%. The large dry bias in the analysis representation of stratospheric water vapour in the Arctic implies the need for future regular measurements of water vapour in the polar stratosphere to allow the valida-tion and improvement of climate models.
Keywords. Atmospheric composition and structure (Middle
atmosphere–composition and chemistry)– Meteorology and atmospheric dynamics (Middle atmosphere dynamics; Polar meteorology)
1 Introduction
Water vapour is a chemically, physically, and radiatively ac-tive trace gas, and its distribution in the stratosphere deter-mines significant climatic implications. The observed
in-Correspondence to: M. Maturilli
crease in stratospheric water vapour (Oltmans and Hofmann, 1995; Evans et al., 1998; Oltmans et al., 2000, Rosenlof et al., 2001) is believed to contribute to the recent downward trend in stratospheric temperatures (Forster and Shine, 1999; Smith et al., 2001; Oinas et al., 2001), and its changing con-centration modifies the stratospheric radiative balance. Fur-thermore, stratospheric humidity has an influence on ozone depletion by affecting both the formation temperature of po-lar stratospheric clouds (PSCs) and the popo-lar vortex temper-atures themselves (Kirk-Davidoff et al., 1999).
In the absence of condensation, the stratospheric water vapour abundance is controlled by photochemistry and dy-namics. In the upper stratosphere, methane oxidation ac-counts for the primary water vapour source within the strato-sphere (Abbas et al., 1996; Michelsen et al., 2000), generally leading to an increase of H2O from the lowermost
strato-sphere to the stratopause. In the tropics, vertical transport from the troposphere provides the other important source of stratospheric water vapour, limited by freeze drying at the cold tropical tropopause (Brewer, 1949).
The overall hemispheric water vapour distribution arises from the superimposed general circulation that accumulates trace gases by descent within the polar vortex. While in the midlatitudes rather constant values of about 4 to 5 ppmv H2O
are found in the lower stratosphere (Ovarlez and Ovarlez, 1994; Schiller et al., 1996), the downward transport within the polar vortex yields higher water vapour mixing ratios from the source regions. Consequently, a horizontal gradient across the vortex edge arises in the lower stratosphere with higher mixing ratios inside than outside of the vortex as far as dehydration by sedimenting PSC particles can be excluded.
The water vapour mixing ratio inside and in the vicinity of the polar vortex has been accurately measured by several balloon-borne sensors during the LAUTLOS campaign in Sodankyl¨a, Finland, in January and February 2004. The re-trieved H2O profiles reveal a unique view on the lower
strato-spheric water vapour distribution in the Arctic, and present a valuable dataset for the validation of model and satellite data. The actual quantity of stratospheric water vapour in the Published by Copernicus GmbH on behalf of the European Geosciences Union.
Arctic is an important parameter not only for ozone chem-istry, but also to infer the radiative budget and the resulting vertical motion inside the polar vortex.
In our study, we combine the stratospheric H2O profiles
measured by the FLASH-B Lyman-Alpha hygrometer during the LAUTLOS campaign and the semi-lagrangian advection model MIMOSA (Hauchecorne et al., 2002). The model has been validated earlier and proven to be an excellent tool to analyse small scale dynamical structures at the edge of the polar vortex (Heese et al., 2001; M¨uller et al., 2003). To pro-ceed from qualitative studies to the quantitative comparison of measurements and model analysis, we introduce opera-tional stratospheric ECMWF specific humidity analyses to be compared with the measured H2O profiles. Taking
advan-tage of the high resolution achieved with the MIMOSA ad-vection scheme, we further analyse the Arctic water vapour distribution by applying MIMOSA three-dimensional field reconstructions to specific humidity fields.
2 Balloon-borne measurements of stratospheric water vapour in the Arctic
During the LAUTLOS campaign in Sodankyl¨a (26.65◦E, 67.25◦N), Finland, in January/February 2004, different balloon-borne water vapour sensors were launched in com-bined payloads for intercomparison. The participating in-struments suitable for the detection of water vapour in the stratosphere were the NOAA-CMDL frostpoint hygrometer (V¨omel et al., 1995; Oltmans et al., 2000), the Colorado Uni-versity cryogenic frostpoint hygrometer and the Fluorescent Advanced Stratospheric Hygrometer for Balloon (FLASH-B) that has been developed at the Central Aerological Ob-servatory in Russia (Yushkov et al., 1998; 2001). Due to the more consistent dataset during the campaign, we re-fer in our study to the measurements of the FLASH-B hy-grometer, in the following noted as FLASH. The instrument applies the photofragment fluorescence method (Kley and Stone, 1978; Bertaux and Dellanoy, 1978) which is based on the photodissociation of H2O molecules when exposed to
radiation with wavelengths λ<121.6 nm (Lyman-Alpha hy-drogen emission), here provided by a hyhy-drogen discharge lamp. The generated electronically excited OH relaxes to the ground state by fluorescence in the 308–316 nm range, as well as by collision with air molecules. FLASH detects the OH fluorescence with a photomultiplier run in photon counting mode, and the intensity of the fluorescent light is directly proportional to the water vapour mixing ratio un-der stratospheric conditions with negligible oxygen absorp-tion. As the instrument uses an open layout it is only suit-able for nighttime measurements at solar zenith angles larger than 98◦. FLASH-B is a light-weight (∼1 kg) and small size (150 mm×200 mm×350 mm) instrument with an estimated total uncertainty of less than 10% under stratospheric con-ditions. The FLASH measurements have been validated by
the long-established NOAA-CMDL hygrometer, and the in-strument has been approved to provide stratospheric water vapour data of similar quality (V¨omel et al., 20051). Good agreement of the FLASH measurements has also been found with ground-based microwave observations (Deuber et al., 2005).
During the campaign, 11 profiles of water vapour in the stratosphere have been detected by FLASH between 29 Jan-uary and 25 FebrJan-uary 2004. The stratospheric payloads were launched at 17:00 UTC, reaching the stratosphere at about 18 UTC. Due to contamination effects while ascending in the plume of the balloon, only descent data are taken into account. Overall, measurements have been taken inside, out-side and at the edge of the polar vortex according to its lo-cation relative to the launch site. During the campaign pe-riod, the lower and mid-stratosphere showed a highly dis-turbed temperature and circulation pattern as a consequence of a major warming. At the end of January 2004, the vor-tex split into one centre over the west-siberian plain and a second centre over northern Europe. The cold pool was situ-ated over Northern Siberia where the main vortex reinforced during February.
The correlation of the dynamical progression of the po-lar vortex and the stratospheric water vapour distribution is analysed by applying the semi-lagrangian advection model MIMOSA as described in the next sections. The LAUTLOS campaign yields the first dataset of high-resolution strato-spheric water vapour profiles in the Arctic over a time period of about 1 month, and thus provides an excellent source for model validation.
3 Behaviour of water vapour in the proximity of the po-lar vortex
In the absence of condensation and freezing, water vapour is a valuable tracer for stratospheric transport processes since its photochemical lifetime in the lower stratosphere is in the order of years (Brasseur and Solomon, 1984). Along with the general circulation, stratospheric water vapour is descending inside the polar vortex, causing both a vertical gradient with higher mixing ratio in higher altitudes, and a horizontal gra-dient across the vortex edge. The vortex edge itself is usu-ally not characterized by a simple first order discontinuity in potential vorticity, but tends to filamentation caused by the irreversible breaking of planetary waves (Appenzeller and Holton, 1997). These mesoscale filament structures and the according distribution of tracers in the proximity of the polar vortex are commonly simulated using either the reverse do-main filling or the contour advection technique (Waugh et al., 1994; Newman et al., 1996). Also Lagrangian models have
1V¨omel, H., Yushkov, V., Khaykin, S., Korshunov, L., Kyr¨o, E.,
and Kivi, R.: Intercomparisons of stratospheric water vapor sensors: FLASH-B and NOAA/CMDL frost point hygrometer, J. Geophys. Res., submitted, 2005.
M. Maturilli et al.: Stratospheric water vapour in the vicinity of the Arctic polar vortex 1513
18
Figure 1.
Upper panel: MIMOSA modified PV (Lait, 1994) normalized at 475 K, with contour
lines every 6 PVU for the time period 01 to 25 February 2004 above Sodankylä. Centre panel:
MIMOSA equivalent latitude (Nash et al., 1996) with contour lines every 8° for the same
period, with dotted lines indicating the date of the profiles shown below. Lower panel:
Profiles of water vapour from ECWMF T106 analyses (black lines), and as measured by
FLASH (black crosses) on 06, 11, 17, and 23 February 2004.
Fig. 1. Upper panel: MIMOSA modified PV (Lait, 1994) normalized at 475 K, with contour lines every 6 PVU for the time period 01 to
25 February 2004 above Sodankyl¨a. Centre panel: MIMOSA equivalent latitude (Nash et al., 1996) with contour lines every 8◦for the same period, with dotted lines indicating the date of the profiles shown below. Lower panel: Profiles of water vapour from ECWMF T106 analyses (black lines), and as measured by FLASH (black crosses) on 06, 11, 17, and 23 February 2004.
proven to reliably reproduce filamentary structures especially in the polar regions (e.g. McKenna et al., 2002). In our study, we apply the semi-lagrangian advection model MI-MOSA (Hauchecorne et al., 2002) to the period of the LAUT-LOS campaign. Based on the operational 6-hourly ECMWF
wind and temperature data extracted on pressure levels with 1.125◦×1.125◦ horizontal resolution, the MIMOSA
trans-port scheme produces tracer fields with 0.3◦horizontal
res-olution on interpolated isentropic surfaces. To analyse the dynamical influence on the measured water vapour profiles,
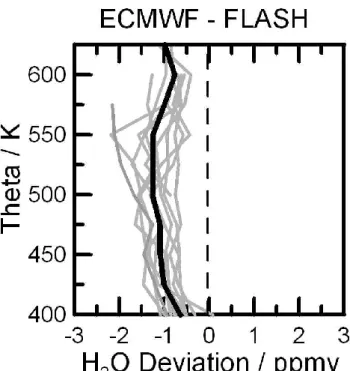
Fig. 2. Difference in water vapour mixing ratio between ECMWF
T106 analyses and the 11 FLASH measurements (grey lines), the mean deviation profile (black line) revealing that the ECMWF anal-yses are about 1 ppmv drier than the observations.
the MIMOSA model is operated advecting potential vortic-ity (PV) in order to reproduce the large and fine scale struc-tures of the polar vortex. It should be mentioned that ad-vected potential vorticity is a derived quantity that is con-served on isentropic surfaces and correlates with the ozone or water vapour concentration in the lower stratosphere. Ad-vected potential vorticity values are probably higher than PV within filaments since the latter is poorly conserved due to radiative and dynamical processes. In order to correct for diabatic changes, the advected PV field is continuously re-laxed toward the ECMWF PV (that takes into account for radiative processes and vertical descent) with a time constant of around 10 days. In fact, potential vorticity is assumed to be conserved on isentropic surfaces in the lower stratosphere in a period of 1– 2 weeks (Hauchecorne et al., 2002). A first comparison between MIMOSA advected potential vorticity and water vapour in the lower polar stratosphere has been found a good proxy to qualitatively explain water vapour lay-ering (M¨uller et al., 2003).
As the polar vortex deformed and shifted largely dur-ing the LAUTLOS campaign, the balloon-borne instruments launched in Sodankyl¨a detected different parts of the polar vortex’ interior and exterior as shown in Fig. 1. In the upper panel, the MIMOSA results of PV advection on isentropic levels are presented as contour cross-section in function of time and altitude, applying modified PV according to Lait (1994) normalized at 475 K in order to remove the
conven-tional PV’s exponential growth with height for an isother-mal atmosphere. While the first stratospheric payloads were launched inside of the vortex, the station was clearly out of the vortex after 8 February 2004. In the last third of the cam-paign, the soundings were performed in the vicinity of the vortex edge, as confirmed by the vortex edge criteria defined by Nash et al. (1996). In the centre panel of Fig. 1, a similar cross-section shows the equivalent latitude estimated from the PV field according to Nash et al. (1996). The equivalent latitude represents the latitude that an air mass would have if the polar vortex was centred at the pole, as the Ertel PV isolines are transformed on an equivalent area map projec-tion, symmetrically arranged around the pole. The advected equivalent latitude thus allows a better characterization of the air mass origin in terms of original location relative to the po-lar vortex rather than in terms of geographical latitude. Un-derneath the cross-sections, examples of water vapour pro-files measured by FLASH are given together with the wa-ter vapour profiles from the closest grid point in operational ECMWF analyses (Fig. 1, lower panel).
On 6 February 2004, the secondary vortex centre was cov-ering northeastern Scandinavia, and the balloon entered the vortex at about 400 K. The smooth increase of water vapour with altitude observed by FLASH represents the typical ver-tical distribution inside the polar vortex, where large scale descent replenishes water vapour from the high stratosphere. While below the polar vortex, in the lowermost stratosphere, a water vapour mixing ratio of about 4 ppmv is found, val-ues above 550 K exceed 6 ppmv. The high equivalent lati-tude confirms that the hygrometer sampled air from inside the vortex.
The polar vortex had then moved further eastward, leaving Scandinavia under the influence of mid-latitude and tropical air in the stratosphere on 11 February 2004. FLASH has detected air from clearly outside of the polar vortex. Water vapour mixing ratios are about 4 to 5 ppmv throughout the profile, as typical for mid-latitude air (Ovarlez and Ovarlez, 1994; Schiller et al., 1996). Equivalent latitude values ranges from 45◦in the lower part of the profile to 25◦in the upper part.
On 17 February 2004, the vortex was located northeast of Scandinavia with large filaments wrapped around the edge caused by the stirring dynamics of the preceding days. The balloon trajectory transits mid-latitude air, polar air and air from lower latitudes. The measured water vapour peaks at altitudes of 525 K and 450 K potential temperature, indicat-ing the encounter of polar vortex filaments. While the mid-latitude air holds less than 5 ppmv H2O, the vortex filament
at 525 K holds about 6 ppmv H2O. The equivalent latitude
field shows the presence of layers originating in mid-latitude regions (lower part of the profile) and at the vortex edge (525 K). In the upper part of the profile (575 K), air from lower equivalent latitudes (30◦) pronounces the strong verti-cal water vapour gradient observed around the polar air peak at 525 K.
M. Maturilli et al.: Stratospheric water vapour in the vicinity of the Arctic polar vortex 1515
20
Figure 3.
Water vapour from ECMWF advected with MIMOSA on the 555 K level on
17 February 2004 (left) and on 23 February 2004 (right). The black line shows the location of
the cross-section shown in Figures 6 and 7.
Fig. 3. Water vapour from ECMWF advected with MIMOSA on the 555 K level on 17 February 2004 (left) and on 23 February 2004 (right).
The black line shows the location of the cross-section shown in Figs. 7 and 8.
By 23 February the polar vortex had shifted towards Scan-dinavia, however the modified PV shows that it was rather the inner vortex edge region that covered the stratosphere above Sodankyl¨a. The complex structure of the measured water vapour profile again indicates the influence of differ-ent air-masses. Below 450 K, the constant values of about 4.5 ppmv are obviously related to air originating from the mid-latitudes, as confirmed by the equivalent latitude. Above that level, the profile is composed by interleaving layers orig-inating from middle to high equivalent latitudes, giving a very irregular vertical gradient to the measured water vapour. Overall, the high-resolution PV fields and equivalent lat-itude simulated with MIMOSA allow to interpret the differ-ences in the measured water vapour profiles to be caused by the different origin of air, with vortex air containing about 1– 2 ppmv more water vapour than the surrounding midlatitude air. The good correlation of MIMOSA PV structures and the observed water vapour profiles implies that the lower strato-spheric water vapour distribution in the absence of conden-sation is controlled by dynamics which are well represented by the horizontal wind field provided by ECMWF.
4 Comparison with stratospheric humidity analyses
The observed vertical water vapour distribution has qualita-tively been proven to be affected by large scale vortex de-scent and mesoscale processes at the vortex edge. Regarding
the water vapour quantity, the measured profiles are now compared to the stratospheric water vapour distribution as given by the operational ECMWF stratospheric humidity analyses. The ECMWF parameter specific humidity has been converted to water vapour volume mixing ratio by multi-plying with 1.6×10⁶ in order to allow the direct compari-son with the humidity quantity measured by the FLASH in-strument. In the vertical, the ECMWF analysis data have been interpolated to potential temperature levels with steps of 25 K. A first confrontation of ECMWF analyses and FLASH measurements is given by the water vapour profiles in Fig. 1 (lower panel).
To systematically analyse the deviation of all profiles, the high-resolution FLASH profiles have been adapted to the 25 K height steps by averaging the water vapour mixing ra-tio in the according theta level +/ 5 K. The deviara-tion of the operational ECMWF humidity analyses from the measured profiles up to 625 K is shown in Fig. 2. Obviously, in the lower stratosphere above 400 K the analysis data are gener-ally much dryer than the observations. No dependence on the location relative to the vortex was substantiated, e.g. if the profile was detected inside, outside or at the edge of the polar vortex. Yet, looking separately at each of these three subgroups assorted according to the relative vortex location, it was found that the deviation slightly increased with time during the campaign period, indicating a possible problem with the vertical replenishment in the model. On average,
Fig. 4. Profiles of water vapour on 06, 11, 17, and 23 February 2004 as measured by FLASH (black crosses), as well as from ECMWF
analyses advected with MIMOSA (black lines).
a dry bias of about 1 ppmv is found throughout the lower stratosphere, accounting for a relative difference from the measurements in the order of 20%.
Improvement of the H2O model representation in the
lower stratosphere is expected to be achieved by reconstruct-ing the analysis humidity distribution with the MIMOSA ad-vection scheme. In a first approach, the MIMOSA transport is directly applied to the operational ECMWF analysis hu-midity as initial tracer. The fine scale horizontal water vapour distribution from MIMOSA-ECMWF on the 555 K potential temperature level is shown in Fig. 3 for 17 and 23 February. The first case is characterised by the presence of an elon-gated filament peeled off the polar vortex. A thin tongue of mid-latitude air originating from the North Pacific region is enclosed by the filament and the vortex. By February 23 the polar vortex had moved, covering the northern part of Scan-dinavia while the major part of the former vortex filament is now explicitly separated from the vortex. In fact, higher water vapour mixing ratios originating from vortex filamen-tation are now found in the North Pacific region. Similar phe-nomena on larger time scales have been described by Durry and Hauchecorne (2005) for mid-latitude stratospheric H2O
soundings during early summer. As for the Sodankyl¨a H2O
measurement on 23 February, the hygrometer was launched in the inner vortex edge region where both H2O rich and
drier air-masses are present, originating from polar and mid-latitudes, respectively.
In Fig. 4, some examples of H2O profiles resulting from
the MIMOSA advection of ECMWF humidity are shown to-gether with those measured by FLASH. For the profiles com-posed of layers with different origin (e.g. 17 and 23 February 2004), MIMOSA is capable to produce filamentary struc-tures in water vapour. Generally, the largest improvements of the MIMOSA three-dimensional field reconstruction com-pared to the operational ECMWF analysis are found in
re-gions where strong gradients in humidity occur. Obviously, the largest horizontal water vapour gradient is found at the polar vortex edge where filamentation leads to laminae struc-tures in the vertical H2O profile. Due to the small scale
structures, a high resolution of transport processes is nec-essary to resolve the vortex edge region and the according tracer distribution in a realistic way. The MIMOSA horizon-tal transport based on the ECMWF wind field is proven to match the observed trace gas structures and to qualitatively provide the H2O distribution in the Arctic stratosphere. Still,
the quantitative deviation of the MIMOSA advected humid-ity to the measured profiles remains in the order of 1 ppmv due to the dry bias introduced by the initial ECMWF strato-spheric humidity analyses. Using ECMWF data with the higher vertical resolution of model levels instead of pressure levels may result in a better representation of small scale structures, but has no significant influence on the humid-ity quanthumid-ity. The MIMOSA-ECMWF overall stratospheric water vapour distribution above Sodankyl¨a is shown in the altitude-time cross-section in Figure 5, reflecting the vortex movement above the station as described by the modified PV in Fig. 1.
In a second approach to improve the H2O model
repre-sentation, the correlation between water vapour and mod-ified PV is used to reconstruct the H2O distribution with
MIMOSA. Here, the quantitative correlation between mea-sured water vapour and MIMOSA modified potential vortic-ity (MPV) is calculated on individual potential temperature (2) surfaces, for convenience grouped to 3 major potential temperature layers centred at 395 K, 490 K, and 595 K, re-spectively. These layers (350 to 440 K, 440 to 540 K, and 540 to 630 K) have been chosen to cover the maximum num-ber of available measurements as well as the maximum vari-ability in PV. For all February measurements, the H2O data
M. Maturilli et al.: Stratospheric water vapour in the vicinity of the Arctic polar vortex 1517
22
Figure 5.
Water Vapour from ECMWF analyses advected with MIMOSA, for the time period
01 to 25 February 2004 above Sodankylä. The dotted lines indicate the date of the profiles
shown in Figure 4.
Fig. 5. Water Vapour from ECMWF analyses advected with MIMOSA, for the time period 1 to 25 February 2004 above Sodankyl¨a. The
dotted lines indicate the date of the profiles shown in Fig. 4.
23
Figure 6.Correlation of water vapour measured by FLASH and modified potential vorticity as
simulated by MIMOSA PV runs, for the period February 2004 in the Arctic. The color-coded
lines show the MPV- H2O correlation for the layers centred around 395 K (blue), 490 K (red),
and 595 K (yellow), with the vertical lines indicating the standard deviation for all measurements attributing to the according potential temperature range (350 to 440 K, 440 K to 540 K, and 540 K to 630 K, respectively).
Fig. 6. Correlation of water vapour measured by FLASH and modified potential vorticity as simulated by MIMOSA PV runs, for the period
February 2004 in the Arctic. The color-coded lines show the MPV- H2O correlation for the layers centred around 395 K (blue), 490 K
(red), and 595 K (yellow), with the vertical lines indicating the standard deviation for all measurements attributing to the according potential temperature range (350 to 440 K, 440 K to 540 K, and 540 K to 630 K, respectively).
on 2-levels in steps of 10 K, thus about 100 H2O-MPV data
pairs contribute to the correlation of each potential temper-ature layer shown in Fig. 6. Clearly, the validity of such an empirical correlation between water vapour and modified potential vorticity is restricted to the time and region of en-hanced stratospheric water vapour measurement activity, re-spectively, as well as to conditions where stratospheric water vapour can be considered a passive tracer. The initial water
vapour field for the MIMOSA advection is then generated via the PV field by applying the retrieved empirical correla-tion. The approach is justified by the fact that the compar-ison between MPV and water vapour has been shown to be robust. Nevertheless, this second method can be considered valid only for the PV range where sufficient water vapour data points are available.
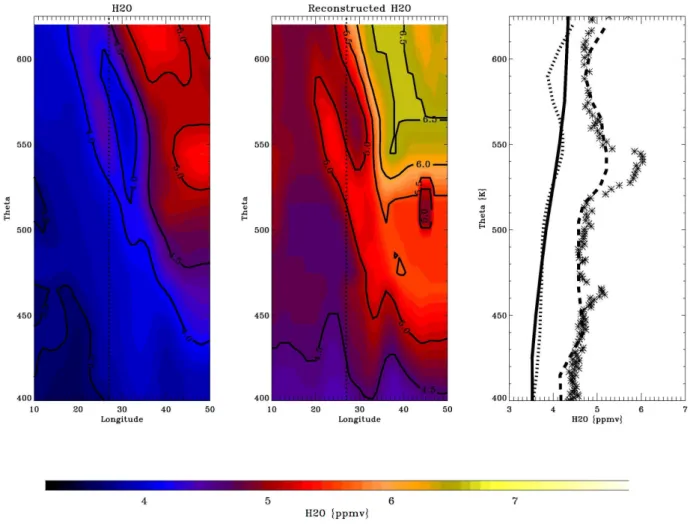
Figure 7. Longitude-altitude cross-section for the transect on 17 February 2004 indicated in
Figure 3, showing ECMWF water vapour advected with MIMOSA (left) and reconstructed
water vapour applying the empirical MPV-H
2O correlation to MIMOSA PV fields (center).
The right panel shows the profiles from ECMWF humidity analysis (black line), MIMOSA
humidity reconstruction based on ECMWF humidity (dotted line), MIMOSA humidity
reconstruction based on MPV correlation (dashed line), and as measured by FLASH (crosses).
Fig. 7. Longitude-altitude cross-section for the transect on 17 February 2004 indicated in Fig. 3, showing ECMWF water vapour advected
with MIMOSA (left) and reconstructed water vapour applying the empirical MPV-H2O correlation to MIMOSA PV fields (center). The
right panel shows the profiles from ECMWF humidity analysis (black line), MIMOSA humidity reconstruction based on ECMWF humidity (dotted line), MIMOSA humidity reconstruction based on MPV correlation (dashed line), and as measured by FLASH (crosses).
The altitude-longitude cross sections of the water vapour distribution as reconstructed with both approaches, the MI-MOSA advection applied directly to ECMWF humidity on the one hand and associated with the empirical H2O-MPV
correlation on the other hand, are shown in Figs. 7 and 8 together with the measured water vapour profiles above So-dankyl¨a for 17 and 23 February, respectively.
On 17 February, the filamentary structure identified earlier in the horizontal map appears from 500 K to 600 K in the ver-tical and is tilted with longitude. Moreover, air with low H2O
mixing ratio is confined between the filament and the vortex. The water vapour distribution achieved from the H2O-MPV
correlation shows a similar pattern, but the absolute values cover a wider range and the filament appears more clearly defined. In fact, the comparison of the measured and recon-structed H2O profiles (Fig. 7, right panel) shows that the
PV-based reconstruction allows not only to reproduce more ac-curately the vertical gradient but also to minimise the
over-all bias. In general, the measured H2O data show a larger
variability at the edge of the polar vortex with respect to the ECMWF analyses humidity. Combined with the broad range of PV values in the vicinity of the vortex, a more detailed and more accurate description of the vertical H2O gradient is
achieved when applying the H2O-MPV reconstruction.
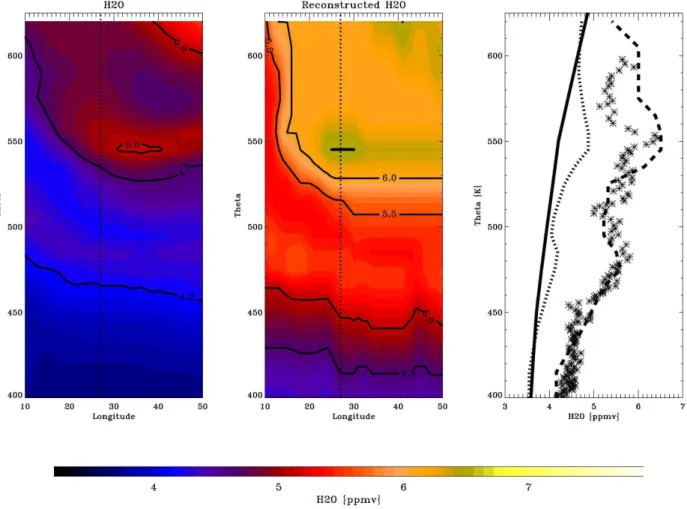
Similar analysis can be carried out for 23 February, when measurements were taken in the proximity of the vortex edge. The constant low water vapour values measured be-low 450 K suggest that the hygrometer was outside the polar vortex in this lower part of the profile. Above, it is possi-ble to identify a main layer of vortex air, interleaved with remnants of mid-latitude air between 500 and 525 K, and by inner-vortex air at 550 K. Both ECMWF humidity and MPV-H2O MIMOSA reconstructions qualitatively show the
pres-ence of such structure, but only the PV-based reconstruction improves also quantitatively by better representing the verti-cal gradient and significantly reducing the bias.
M. Maturilli et al.: Stratospheric water vapour in the vicinity of the Arctic polar vortex 1519
25
Figure 8. Longitude-altitude cross-section for the transect on 23 February 2004 indicated in
Figure 3, showing ECMWF water vapour advected with MIMOSA (left) and reconstructed
water vapour applying the empirical MPV-H
2O correlation to MIMOSA PV fields (center).
The right panel shows the profiles from ECMWF humidity analysis (black line), MIMOSA
humidity reconstruction based on ECMWF humidity (dotted line), MIMOSA humidity
reconstruction based on MPV correlation (dashed line), and as measured by FLASH (crosses).
Fig. 8. Longitude-altitude cross-section for the transect on 23 February 2004 indicated in Fig. 3, showing ECMWF water vapour advected
with MIMOSA (left) and reconstructed water vapour applying the empirical MPV-H2O correlation to MIMOSA PV fields (center). The
right panel shows the profiles from ECMWF humidity analysis (black line), MIMOSA humidity reconstruction based on ECMWF humidity (dotted line), MIMOSA humidity reconstruction based on MPV correlation (dashed line), and as measured by FLASH (crosses).
5 Discussion
It has been shown that MIMOSA is able to reproduce weak water vapour filaments from ECMWF analysis humidity, but obviously the large bias induced by the initial H2O field
ex-ceeds by far any improvement introduced by the better rep-resentation of the dynamical field. When comparing the wa-ter vapour data given by the initial ECMWF humidity field and the balloon-borne FLASH measurements, large discrep-ancies are found because the model strongly underestimates the lower stratospheric humidity. While we focus on the Arc-tic lower stratosphere, similar deviations of the model have been noted earlier for aircraft measurements in the extra-tropical UTLS region (Ovarlez et al., 2000) and for UARS data in the tropical middle stratosphere (ECMWF Newslet-ter No.82 www.ecmwf.int/publications/newsletNewslet-ters/). It is known that ECMWF stratospheric analyses had been too dry when methane oxidation in the upper stratosphere was not
yet implemented (Simmons et al., 1999). This high level H2O source has now been amended, and the representation
of the ECMWF stratospheric humidity distribution has been further improved with the higher vertical resolution of the model, as transport processes are reproduced on more real-istic timescales in the 50-level simulations (Simmons et al., 1999). Yet in the ECMWF analysis system, stratospheric hu-midity evolves solely according to the dynamical and param-eterized physical processes within the model and thus de-pends completely on the tropical tropopause temperature as stratospheric entry parameter, as well as on the strength of the meridional circulation.
The underestimation of stratospheric humidity may lead to large errors e.g. in the calculation of radiative heating rates, or in the determination of the potential polar stratospheric cloud volume that critically depends not only on tempera-ture but also on the water vapour mixing ratio (Hanson and Mauersberger, 1988; Marti and Mauersberger, 1993). Our
study underlines the need for further reliable measurements of stratospheric water vapour for the validation of climate models.
6 Summary
During the LAUTLOS campaign in January and February 2004, water vapour profiles have been measured from So-dankyl¨a, Finland, by different balloon-borne sensors. The re-trieved dataset of high-resolution stratospheric water vapour profiles observed by the Russian FLASH-B instrument pro-vides an excellent source for model validation in the Arc-tic region, as the measurements cover a period of about one month. As the polar vortex deformed and shifted during the campaign period, the water vapour mixing ratio was detected inside and in the vicinity of the polar vortex. To analyse the effects of the winter stratosphere dynamics on the water vapour distribution, we combined the H2O profiles measured
by FLASH with the semi-lagrangian advection model MI-MOSA. By correlating water vapour and potential vorticity as described in M¨uller et al. (2003), it was possible to identify water vapour profiles typical for the polar vortex interior and exterior. Furthermore, laminae in the water vapour profiles have been assigned to dynamically caused filamentary struc-tures at the vortex edge. The strucstruc-tures in the high-resolution PV fields simulated with MIMOSA correlate well with the observed water vapour mixing ratio, implying that in the ab-sence of condensation the lower Arctic stratospheric water vapour distribution is purely controlled by dynamics that are well represented by the initial horizontal wind field provided by ECMWF.
To proceed to a quantitative comparison of measured and simulated stratospheric water vapour, specific humidity from operational ECMWF analyses has been 3-dimensionally ad-vected as passive tracer by MIMOSA. Although filamentary structures become also apparent in the resulting H2O
mix-ing ratio fields, large discrepancies occur when comparmix-ing the profiles with the measurements. The lower stratosphere above 400 K is generally too dry by about 1 ppmv through-out the lower stratosphere both in the initial ECMWF and the MIMOSA fields. With total H2O mixing ratios of about 4 to
6 ppmv, the dry bias of the models is in the order of 20%. Apart from the large quantitative deviation, MIMOSA ap-pears to generally reproduce the shape of the profiles better than the ECMWF analysis with the largest improvement in the region of the strongest horizontal water vapour gradient (at the vortex edge). Although MIMOSA has been proven to rudimentary reproduce water vapour filaments, the large bias induced by the initial H2O field exceeds by far any
im-provement introduced by the better representation of the dy-namical field. Similar discrepancies of the H2O field given
by the operational ECMWF analyses have been found earlier for measurements in the extratropical UTLS region (Ovarlez et al., 2000) and in the tropical middle stratosphere. The
de-viation of the model from the observations emphasizes the problem in using ECMWF analysed stratospheric humidity for e.g. the calculation of radiative heating rates.
To achieve an improvement of the simulated stratospheric water vapour in the vicinity of the polar vortex, we calcu-lated the quantitative correlation between water vapour mea-sured during the LAUTLOS campaign and the modified po-tential vorticity. The MIMOSA transport scheme was then initialised with the given MPV-correlated water vapour dis-tribution, reproducing water vapour mixing ratio in good agreement with the measurements. The method may improve the model description of the water vapour in the stratosphere, but is clearly restricted to periods of enhanced stratospheric H2O measurement activity.
The presented comparison has impressively proven that there is a large dry bias in the ECMWF analysis represen-tation of stratospheric water vapour in the Arctic, and that future regular measurements of water vapour in the polar re-gions are essential for the validation and improvement of cli-mate models.
Acknowledgements. This work was supported within COST723 by the European Science Foundation. We thank the colleagues who were involved in the LAUTLOS campaign: U. Leiterer, H. V¨omel, R. Kivi, R. Neuber, P. Ruppert, A. Paukkunen, N. K¨ampfer, nd their co-workers. We specifically wish to thank the FMI team, lead by E. Kyr¨o, for arranging the campaign at Sodankyl¨a. The LAUTLOS campaign was funded by the EU project LAPBIAT. Financial sup-port was also given by the Russian Based Research Program (RFFI grant 04-05-64723). We thank the European Centre for Medium-Range Weather Forecast for supplying the meteorological data.
Topical Editor F. D’Andrea thanks two referees for their help in evaluating this paper.
References
Abbas, M. M., Michelsen, H. A., Gunson, M. R., Abrams, M. C., Newchurch, M. J., Salawitch, R. J., Chang, A. Y., Goldman, A., Irion, F. W., Manney, G. L., Moyer, E. J., Nagaraju, R., Rinsland, C. P., Stiller, G. P., and Zander, R.: Seasonal variations of water vapour in the lower stratosphere inferred from ATMOS/ATLAS-3 measurements of H2O and CH4, Geophys. Res. Let., 23, 2401– 2404, 1996.
Appenzeller, C. and Holton, J. R.: Tracer lamination in the strato-sphere: A global climatology. J. Geophys. Res., 102, 13 555– 13 569, 1997.
Bertaux, J.-L. and Delannoy, A.: Vertical distribution of H2O in the stratosphere as determined by UV fluorescence in-situ measure-ments. Geophys. Res. Let., 5, 1017–1020, 1978.
Brasseur, G. and Solomon, S. (Eds.): Aeronomy of the Middle At-mosphere, D. Reidel Publishing Company, Dordrecht, 229–237, 1984.
Brewer, A. W.: Evidence for a world circulation provided by the measurements of helium and water vapour distribution in the stratosphere, Q. J. R. Meteorol. Soc., 75, 351–363, 1949. Deuber, B., Haefele, A., Feist, D. G., Martin, L., K¨ampfer, N.,
M. Maturilli et al.: Stratospheric water vapour in the vicinity of the Arctic polar vortex 1521
V¨omel, H.: Middle Atmospheric Water Vapour Radiometer (MI-AWARA): Validation and first results of the LAPBIAT Up-per Tropospheric Lower Stratospheric Water Vapour Valida-tion Project (LAUTLOS-WAVVAP) campaign. J. Geophys. Res., 110, D13306, doi:10.1029/2004JD005543, 2005.
Durry, G. and Hauchecorne, A.: Evidence for long-lived polar vor-tex air in the mid-latitude summer stratosphere from in situ laser diode CH4 and H2O measurements, Atmos. Chem. Phys., 5,
1467–1472, 2005.
Evans, S. J., Toumi, R., Harries, J. E., Chipperfield, M. P., and Rus-sell III, J. M.: Trends in stratospheric humidity and the sensitiv-ity of ozone to these trends. J. Geophys. Res., 103, 8715–8725, 1998.
Forster, P. M. de F. and Shine, K. P.: Stratospheric water vapour changes as a possible contributor to observed stratospheric cool-ingn, Geophys. Res. Lett., 26, 3309–3312, 1999.
Hanson, D. R. and Mauersberger, K.: Laboratory studies of the ni-tric acid trihydrate: implications for the south polar stratosphere, Geophys. Res. Lett., 15, 855–858, 1988.
Hauchecorne, A., Godin, S., Marchand, M., Heese, B., and Souprayen C.: Quantification of the transport of chemical con-stituents from the polar vortex to midlatitudes in the lower strato-sphere using the high-resolution advection model MIMOSA and effective diffusivity. J. Geophys. Res., 107 (D20), 8289, doi:10.1029/2001JD000491, 2002.
Heese, B., Godin, S., and Hauchecorne, A.: Forecast and simu-lation of stratospheric ozone filaments: A validation of a high-resolution potential vorticity advection model by airborne ozone lidar measurements in winter 1998–1999, J. Geophys. Res., 106, 20 011–20 024, 2001.
Kirk-Davidoff, D. B., Hintsa, E. J., Anderson, J. G., and Keith, D. W.: The effect of climate change on ozone depletion through changes in stratospheric water vapour, Nature, 402, 399–401, 1999.
Kley, D. and Stone, E. J.: Measurement of water vapour in the stratosphere by photodissociation with Ly-α (1216 ˚A) light, Rev. Sci. Instrum., 49, 691–697, 1978.
Lait, L.R.: An alternative form for potential vorticity, J. Atmos. Sci., 51, 1754–1759, 1994.
Marti, J. and Mauersberger, K.: A survey and new measurements of ice vapour pressure at temperature between 170 ad 250 K, Geo-phys. Res. Lett., 20, 363–366, 1993.
McKenna, D. S., Konopka, P., Grooß, J.-U., Gu¨nther, G., M¨uller, R., Spang, R., Offermann, D., and Orsolini, Y.: A new Chemical Lagrangian Model of the Stratosphere (CLaMS) 1. Formulation of advection and mixing, J. Geophys. Res., 107 (D16), 4309, doi:10.1029/2000JD000114, 2002.
Michelsen, H. A., Irion, F. W., Manney, G. L., Toon, G. C., and Gunson, M. R.: Features and trends in Atmospheric Trace Molecule Spectroscopy (ATMOS) version 3 stratospheric wa-ter vapour and methane measurements, J. Geophys. Res., 105, 22 713–22 724, 2000.
M¨uller, M., Neuber, R., Fierli, F., Hauchecorne, A., V¨omel, H., and Oltmans, S. J.: Stratospheric water vapour as tracer for vortex fil-amentation in the Arctic winter 2002/2003, Atmos. Chem. Phys., 3, 1991–1997, 2003.
Nash, E. R., Newman, P. A., Rosenfield, J. E., and Schoeberl, M. R.: An objective determination of the polar vortex using Ertel’s potential vorticity, J. Geophys. Res., 101, 9471–9478, 1996. Newman, P. A., Lait, L. R., Schoeberl, M. R., et al.: Measurements
of polar vortex air in the midlatitudes, J. Geophys. Res., 101, 12 879–12 891, 1996.
Oinas, V., Lacis, A. A., Rind, D., Shindell, D. T., and Hansen J. E.: Radiative cooling by stratospheric water vapour: big differences in GCM results, Geophys. Res. Lett., 28, 2791–2794, 2001. Oltmans, S. J. and Hofmann, D. J.: Increase in lower-stratospheric
water vapour at a mid-latitude Northern Hemisphere site from 1981–1994, Nature, 374, 146–149, 1995.
Oltmans, S. J., V¨omel, H., Hofmann, D. J., Rosenlof, K. H., and Kley, D.: The increase in stratospheric water vapour from bal-loonborne frostpoint hygrometer measurements at Washington, D.C. and Boulder, Colorado, Geophys. Res. Lett., 27, 3453– 3456, 2000.
Ovarlez, J. and Ovarlez, H.: Stratospheric water vapour content evolution during EASOE. Geophys. Res. Lett., 21, 1235–1238, 1994.
Ovarlez, J., van Velthoven, P., Sachse, G., Vay, S., Schlager, H., and Ovarlez, H.: Comparison of water vapour measurements from POLINAT 2 with ECMWF analyses in high-humidity conditions, J. Geophys. Res., 105, 3737–3744, 2000.
Rosenlof, K. H., Oltmans, S. J., Kley, D., et al.: Stratospheric water vapour increases over the past half century, Geophys. Res. Let., 28, 1195–1198, 2001.
Schiller, C., Engel, A., Schmidt, U., Borchers, R., and Ovarlez, J.: The partitioning of hydrogen species in the Arctic winter strato-sphere: Implications for microphysical parameters, J. Geophys. Res., 101, 14 489–14 493, 1996.
Simmons, A. J., Untch, A., Jakob, C., K˚allberg, P., and Und´en, P.: Stratospheric water vapour and tropical tropopause temperatures in ECMWF analyses and multi-year simulations, Q. J. R. Mete-orol. Soc., 125, 353–386, 1999.
Smith, C. A., Haigh, J. D., and Toumi, R.: Radiative forcing due to trends in the stratospheric water vapour, Geophys. Res. Lett., 28, 179–182, 2001.
V¨omel, H., Oltmans, S. J., Hofmann, D. J., Deshler, T., and Rosen, J. M.: The evolution of the dehydration in the Antarctic strato-spheric vortex, J. Geophys. Res., 100, 13 919–13 926, 1995. Waugh, D. W., Plumb, R. A., Atkinson, R. J., et al.: Transport out
of the polar vortex by Rossby wave breaking, J. Geophys. Res., 99, 1071–1088, 1994.
Yushkov V., Merkulov, S., and Astakhov, V.: Optical balloon hy-grometer for upper stratosphere and stratosphere water vapour measurements, in: Optical Remote Sensing of the Atmosphere and Clouds, Proceedings of SPIE, Vol. 3501, edited by: Wang, J., Wu, B., Ogawa, T., and Guans, Z.-H., 439–445, 1998. Yushkov, V., Sitnikov, N., Zaitsev, I., Pommereau, J.-P., and
Gar-nier, A.: Stratospheric water vapour measurements in the winter arctic with optical fluorescent hygrometer on short and long du-ration balloons, Proceedings of the 15th ESA symposium on Eu-ropean Rocket and Balloon Programmes and Related Research, edited by: Warmbein, B., ESA-SP-471, 263–268, 2001.