HAL Id: hal-00327873
https://hal.archives-ouvertes.fr/hal-00327873
Submitted on 5 Aug 2003HAL is a multi-disciplinary open access
archive for the deposit and dissemination of sci-entific research documents, whether they are pub-lished or not. The documents may come from teaching and research institutions in France or abroad, or from public or private research centers.
L’archive ouverte pluridisciplinaire HAL, est destinée au dépôt et à la diffusion de documents scientifiques de niveau recherche, publiés ou non, émanant des établissements d’enseignement et de recherche français ou étrangers, des laboratoires publics ou privés.
Stratospheric water vapour as tracer for vortex
filamentation in the Arctic winter 2002/2003
M. Müller, R. Neuber, Federico Fierli, Alain Hauchecorne, H. Vömel, S. J.
Oltmans
To cite this version:
M. Müller, R. Neuber, Federico Fierli, Alain Hauchecorne, H. Vömel, et al.. Stratospheric water vapour as tracer for vortex filamentation in the Arctic winter 2002/2003. Atmospheric Chemistry and Physics Discussions, European Geosciences Union, 2003, 3 (4), pp.4393-4410. �hal-00327873�
ACPD
3, 4393–4410, 2003Stratospheric water vapour as tracer for vortex filamentation M. M ¨uller et al. Title Page Abstract Introduction Conclusions References Tables Figures J I J I Back Close Full Screen / Esc
Print Version Interactive Discussion
© EGU 2003
Atmos. Chem. Phys. Discuss., 3, 4393–4410, 2003 www.atmos-chem-phys.org/acpd/3/4393/
© European Geosciences Union 2003
Atmospheric Chemistry and Physics Discussions
Stratospheric water vapour as tracer for
vortex filamentation in the Arctic winter
2002/2003
M. M ¨uller1, R. Neuber1, F. Fierli2, A. Hauchecorne3, H. V ¨omel4, and S. J. Oltmans5
1
Alfred Wegener Institute for Polar and Marine Research, Potsdam, Germany
2
Istituto di Scienze dell’Atmosfera e del Clima, CNR, Rome, Italy
3
Service D’A ´eronomie du CNRS, Verri `eres-le-Buisson, France
4
Cooperative Institute for Research in Environmental Sciences, University of Colorado, Boulder, Colorado, USA
5
Climate Monitoring and Diagnostics Laboratory, NOAA, Boulder, Colorado, USA Received: 9 July 2003 – Accepted: 1 August 2003 – Published: 5 August 2003 Correspondence to: M. M ¨uller ([email protected])
ACPD
3, 4393–4410, 2003Stratospheric water vapour as tracer for vortex filamentation M. M ¨uller et al. Title Page Abstract Introduction Conclusions References Tables Figures J I J I Back Close Full Screen / Esc
Print Version Interactive Discussion
© EGU 2003
Abstract
During winter 2002/2003, three balloon-borne frost point hygrometers measured high-resolution profiles of stratospheric water vapour above Ny- ˚Alesund, Spitsbergen. All measurements reveal a high H2O mixing ratio of about 7 ppmv above 24 km, thus dif-fering significantly from the 5 ppmv that are commonly assumed for the calculation of 5
polar stratospheric cloud existence temperatures. The profiles obtained on 12 Decem-ber 2002 and on 17 January 2003 provide an insight into the vertical distribution of water vapour in the core of the polar vortex.
Unlike the earlier profiles, the water vapour sounding on 11 February 2003 detected the vortex edge region in the lower part of the stratosphere. Here, a striking diminuition 10
in H2O mixing ratio stands out between 16 and 19 km. The according stratospheric temperatures clarify that this dehydration can not be caused by the presence of polar stratospheric clouds or earlier PSC particle sedimentation.
On the same day, ozone observations by lidar indicate a large scale movement of the polar vortex, while an ozone sonde measurement even shows laminae in the same 15
altitude range as in the water vapour profile. Tracer lamination in the vortex edge re-gion is caused by filamentation of the vortex. The link between the observed water vapour diminuition and filaments in the vortex edge region is highlighted by results of the MIMOSA contour advection model. In the altitude of interest, adjoined filaments of polar and mid-latitudinal air can be identified above the Spitsbergen region. A vertical 20
cross-section reveals that the water vapour sonde has flown through polar air in the lowest part of the stratosphere. Where the low water vapour mixing ratio was detected, the balloon passed through air from a mid-latitudinal filament from about 425 to 445 K, before it finally entered the polar vortex above 450 K. The MIMOSA model results elu-cidate the correlation that on 11 February 2003 the frost point hygrometer measured 25
strongly variable water vapour concentrations as the sonde detected air with different origins, respectively.
ACPD
3, 4393–4410, 2003Stratospheric water vapour as tracer for vortex filamentation M. M ¨uller et al. Title Page Abstract Introduction Conclusions References Tables Figures J I J I Back Close Full Screen / Esc
Print Version Interactive Discussion
© EGU 2003
diminuition in the stratospheric water vapour profile of 11 February 2003 has been found to be caused by dynamical processes in the polar stratosphere.
1. Introduction
The prominent role of stratospheric water vapour has become evident during the last years. Radiatively, it is the most important greenhouse gas (Harries, 1996) and the 5
observed increase of stratospheric water vapour (SPARC, 2000) may enhance strato-spheric cooling (Rind and Lonergan, 1995; Forster and Shine, 1999; Oinas et al., 2001). Chemically, the increase of stratospheric water vapour is expected to enhance the occurrence of polar stratospheric clouds (PSCs) (Hofmann and Oltmans, 1992), thus attributing to rates of heterogeneous reactions that initiate the catalytic loss of 10
stratospheric ozone.
While a large fraction of the water vapour content enters the stratosphere by verti-cal transport in the tropiverti-cal tropopause region (Brewer, 1949), the major photochem-ical source of H2O in the stratosphere is the oxidation of methane (Abbas et al., 1996; Michelsen et al., 2000). The only water vapour sink in the upper atmosphere 15
is achieved through the photolysis by Lyman-α, with its efficiency increasing with al-titude in the mesosphere. Yet, in the lower stratosphere water vapour can also be lost due to gravitational sedimentation of ice particles from PSC type II inside the po-lar vortex. This process leading to dehydration and rehydration is linked to very cold stratospheric temperatures and therefore is observed more frequently and to a larger 20
extent in the Antarctic than in the Arctic (V ¨omel et al., 1995, 1997; Nedoluha et al., 2002; Schiller et al., 2002). Without dehydration, the humidity inside the polar vortex is generally higher than in the surrounding mid-latitudes due to the vortex descent of air from higher altitudes where water vapour is produced by methane oxidation (Aellig et al., 1996; Schiller et al., 1996). Overall, the distribution of stratospheric water vapour is 25
determined by the interaction of radiation, chemistry, and dynamics. As water vapour is considered a long-lived tracer, its distribution provides insights into stratospheric
dy-ACPD
3, 4393–4410, 2003Stratospheric water vapour as tracer for vortex filamentation M. M ¨uller et al. Title Page Abstract Introduction Conclusions References Tables Figures J I J I Back Close Full Screen / Esc
Print Version Interactive Discussion
© EGU 2003
namics and transport.
Our observations indicate the large scale descent of water vapour inside the po-lar vortex, but also small-scale features caused by vortex filamentation. It has been previously shown that vortex filamentation appears as lamination in tracer profiles as vertically tilted filament sheets pass over a measurement location (Reid and Vaughan, 5
1991; Orsolini, 1995). Filaments are produced by planetary wave breaking at the edge of the polar vortex where tracer isopleths are stretched and thinned due to differential advection. With propagating time, the size of a tracer filament is reduced from the synoptic scale to the mesoscale and finally the microscale where molecular diffusion becomes important (e.g. Flentje et al., 2003).
10
2. Observations
In winter 2002/2003, three high resolution stratospheric water vapour profiles were obtained by balloon-borne frost point hygrometers launched from Ny- ˚Alesund, Spits-bergen (79◦N, 12◦E). The instruments are built at NOAA-CMDL, and a detailed de-scription is found in V ¨omel et al. (1995). The hygrometer launches were conducted on 15
12 December 2002, as well as on 17 January and 11 February 2003. According to the changing meteorological situation in the stratosphere, the sondes detected different states of the polar vortex.
2.1. The Arctic polar vortex in winter 2002/2003
During the Arctic winter 2002/2003, the stratospheric polar vortex had developed very 20
early. Already in the mid of November 2002 the cold pool temperatures were low enough to allow the existence of polar stratospheric clouds. The structure of the vor-tex was barotropic centred above Spitsbergen. The stable and cold situation in the lower stratosphere was not influenced by a minor warming at the end of December that only propagated downward to reach to 10 hPa level (approximately 30 km). In the 25
ACPD
3, 4393–4410, 2003Stratospheric water vapour as tracer for vortex filamentation M. M ¨uller et al. Title Page Abstract Introduction Conclusions References Tables Figures J I J I Back Close Full Screen / Esc
Print Version Interactive Discussion
© EGU 2003
mid of January 2003 though, a major stratospheric warming disturbed the vortex also in lower altitudes with high temperatures moving from the Aleutians towards the pole, inducing an elongation of the vortex. Despite the ongoing dynamical activity, the core of the elongated polar vortex was still situated above Spitsbergen during the water vapour measurement on 17 January while during the next days the vortex split into 5
two centres. At the beginning of February 2003, the vortex had stabilized again to form one centre above Spitsbergen. With further disturbances in the stratosphere, the centre of the polar vortex moved eastwards. On 11 February the vortex appeared in a wave-3 shape with its centre above the Siberian Arctic and the edge region above Spitsbergen. Although still covered by the vortex in altitudes above 475 K (20.3 km), 10
Spitsbergen was already outside the vortex below 475 K. In the next days, the vortex elongated further and split up again. Minor warming events in mid-February and at the beginning of March kept the vortex dynamically active. The final warming started at the end of March.
2.2. Water vapour profiles 15
The profiles of the balloon-borne H2O measurements on 12 December 2002 and on 17 January 2003 were detected in the centre of the polar vortex and are very similar. The January 17 profile is chosen as representative for these vortex core cases and is shown in Fig. 1. In the lowermost stratosphere from the tropopause region up to 15 km, the water vapour mixing ratio has rather stable values at about 4 ppmv. Above 20
15 km water vapour is constantly increasing, reaching about 7 ppmv at 24 km and thus exceeding by far the 5 ppmv commonly assumed for the calculation of PSC existence temperatures (e.g. Carslaw et al., 1998).
The observed high H2O mixing ratio in the uppermost part of the profile is most certainly related to the stratospheric warming events whose effects can be recognized 25
in the upper part of the temperature profile in Fig. 1. As sudden stratospheric warming events are always connected with enhanced downward transport inside the vortex, the 2002/2003 polar vortex seems to be more intensely re-hydrated from above than
ACPD
3, 4393–4410, 2003Stratospheric water vapour as tracer for vortex filamentation M. M ¨uller et al. Title Page Abstract Introduction Conclusions References Tables Figures J I J I Back Close Full Screen / Esc
Print Version Interactive Discussion
© EGU 2003
in years without stratospheric warming events. While in winter 2002/2003, the water vapour mixing ratio reaches 7 ppmv above 24 km, the mixing ratio did e.g. not exceed 6 ppmv in the cold and stable polar vortex of winter 1995/1996 (V ¨omel et al., 1997).
While the profile obtained deep inside the polar vortex on 12 December 2002 re-sembles the profile in Fig. 1 very much (not shown here), the third profile acquired on 5
11 February 2003 reveals some striking deviations (Fig. 2). Again, an approximately constant water vapour mixing ratio of 4 ppmv is found from the tropopause region to about 15 km. Also the upper part of the profile above 20 km presents a similar distribu-tion of water vapour mixing ratio with values increasing with altitude. Yet between 16 and 19 km, explicitly less water vapour is found in the 11 February 2003 profile. The 10
striking structure may be called a bite-out from the background vortex profile. Within this bite-out, another feature becomes evident: a distinct peak near 17 km that reaches background values. The cause for these features in the 11 February 2003 water vapour profile is addressed below.
3. Discussion of dynamical aspects
15
A dramatic H2O reduction in defined stratospheric layers as found in the profile of 11 February 2003 (Fig. 2) has been previously observed in Arctic water vapour profiles (V ¨omel et al., 1997). Yet these events have been linked to dehydration due to the sed-imentation of ice PSC particles. However, on 11 February 2003 the local temperature (Fig. 2) as well as the temperature along the backward trajectories (not reported) was 20
not low enough to allow for the existence of PSCs in the air mass detected by the balloon-borne hygrometer. Therefore, dehydration is unlikely to have occurred just be-fore. Due to the stratospheric warming events and consequent mixing within the polar vortex, a possible footprint of prior dehydration by PSC type II occurrence earlier in the winter may be excluded. Thus in the case of 11 February 2003, the reduction in water 25
vapour is not caused by ice formation. An explanation may be found by looking at the stratospheric dynamics.
ACPD
3, 4393–4410, 2003Stratospheric water vapour as tracer for vortex filamentation M. M ¨uller et al. Title Page Abstract Introduction Conclusions References Tables Figures J I J I Back Close Full Screen / Esc
Print Version Interactive Discussion
© EGU 2003
First indications are given by the temperature profile in Fig. 2. Above 19 km, the hygrosonde detected the cold pool inside the polar vortex. Below 19 km a rapid tem-perature increase towards tropopause region temtem-peratures is observed suggesting the detection of air outside the polar vortex and thus implying that the diminuition of wa-ter vapour between 16 and 19 km is related to the lower wawa-ter vapour mixing ratio of 5
mid-latitudinal air, a hypothesis that is supported by ozone measurements, trajectory calculations and the results of the MIMOSA model.
3.1. Stratospheric ozone profiles
Firstly, the assumption is backed by the Ny- ˚Alesund ozone observations on that day. Figure 3 shows ozone profiles measured by lidar and ozone sonde during different 10
time periods on 11 February 2003. During the morning hours, the lidar ozone profiles represent typical polar vortex profiles throughout the lower stratosphere. However, the afternoon and evening lidar profiles show a completely changed situation as they diverge significantly from the vortex profiles. Between the tropopause region and ap-proximately 19 km, the ozone number density is now reduced by about one third. This 15
large reduction in a very short time period is definitely not caused chemically, but can only be explained dynamically by the moving of the polar vortex. During the 11 Febru-ary 2003 morning measurements, the observation site was situated inside the polar vortex. As the vortex moved further north-eastward during the day, only the upper part of the vortex above 19 km was still covering Ny- ˚Alesund. Below 19 km, the vortex had 20
moved so the vertical lidar measurements from Ny- ˚Alesund detected air from outside the polar vortex. The large scale vortex movement found in ECMWF analyses as well as in the MIMOSA model- is reflected in the lidar ozone profiles, but also gives a hint for the cause of the H2O diminuition from 16 to 19 km in the water vapour profile. On the same day, the ozone sonde measurement at 11:00 UTC reveals strong lamination 25
between roughly 15 and 20 km (Fig. 3). Due to the momentary measurement of the sonde, these laminated layers of enhanced and reduced ozone are more prominent than in the presented lidar profiles that are integrated over a longer time period. The
ACPD
3, 4393–4410, 2003Stratospheric water vapour as tracer for vortex filamentation M. M ¨uller et al. Title Page Abstract Introduction Conclusions References Tables Figures J I J I Back Close Full Screen / Esc
Print Version Interactive Discussion
© EGU 2003
laminated ozone sonde profile therefore gives a more precise picture of the actual state of the stratospheric ozone distribution. The similar laminae structures in the both tracer profiles – ozone and water vapour (Figs. 2 and 3) – indicate the same dynamical cause. 3.2. Comparison with MIMOSA model results
The mesoscale distribution of tracers in the stratosphere is commonly simulated using 5
either the reverse domain filling or the contour advection technique (Waugh et al., 1994; Newman et al., 1996). Here we present results from the semi-lagrangian advection model MIMOSA (Hauchecorne et al., 2002). The simulations are based on 6-hourly ECMWF wind and temperature data with 1.125◦ × 1.125◦ horizontal resolution on 28 pressure levels, from which MIMOSA consequently produces tracer fields with 0.3◦ 10
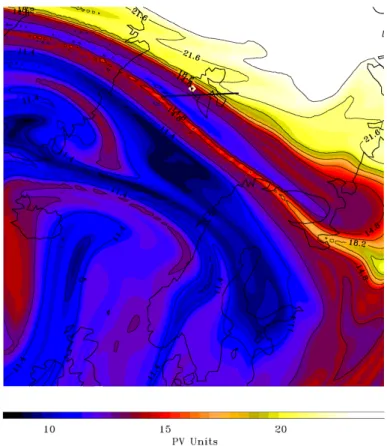
horizontal resolution on 20 isentropic surfaces. Based on potential vorticity (PV) as tracer, we apply modified potential vorticity (MPV) (Lait, 1994) in order to remove the conventional PV’s exponential growth with height for an isothermal atmosphere. A map of the simulated fine scale distribution of MPV is shown in Fig. 4, displaying the 440 K isentropic level (about 18.2 km) on 11 February 2003, 06:00 UTC. The high potential 15
vorticity (in bright yellow colours) defines the polar vortex that is situated north-east of Ny- ˚Alesund in this level. Mid-latitudinal air with lower MPV values (in blue colours) is found south of Spitsbergen. The transition region from polar to mid-latitudinal air is characterized by filamentary structures of different origin. A filament of polar air occurs south of Spitsbergen, separated from the vortex by a tongue of mid-latitudinal air. 20
Based on the measured ozone sonde balloon trajectory, the hygrosonde flight path is assumed to point south-eastward from Ny- ˚Alesund parallel to the MPV isolines drawn in Fig. 4. Since there is only a time lag of 4 h between the sonde launches and both tracer profiles show similar laminated structures, the assumed similarity of the balloon trajectories is reasonable, and furthermore supported by ECMWF trajectory calcula-25
tions (not presented here). According to Fig. 4, the water vapour sonde encountered mid-latitudinal air on the 440 K level. In fact, both the water vapour and ozone profile (Figs. 2 and 3) indicate that around 18.2 km the sondes detected low tracer
concentra-ACPD
3, 4393–4410, 2003Stratospheric water vapour as tracer for vortex filamentation M. M ¨uller et al. Title Page Abstract Introduction Conclusions References Tables Figures J I J I Back Close Full Screen / Esc
Print Version Interactive Discussion
© EGU 2003
tions as expected from mid-latitudinal air.
In Fig. 5, the simulated MPV field is shown as longitudinal cross-section along 78◦N (indicated in Fig. 4), thus well adapting to the balloon trajectory since the balloon drifted south-eastward. Bright yellow colours mark polar vortex air, while dark red and blue colours clearly indicate the presence of mid-latitudinal filaments. The colour coded 5
MPV is superimposed by the measured water vapour profile as well as the assumed balloon trajectory during its drift from 12◦E to 16◦E. The combination of the simulated tracer (MPV) field with the observed vertical tracer (H2O) profile in Fig. 5 hauntingly exhibits that the detected water vapour diminuition is indeed caused by dynamical pro-cesses.
10
The MIMOSA results show that on its way through the stratosphere the sonde en-countered air of different origins. Below 420 K, the sonde met a smooth background of polar air. Between roughly 420 and 445 K, the longitudinal cross-section reveals ad-joined polar and mid-latitudinal filaments along the flight path. The well defined water vapour peak around 425 K (17 km) is clearly linked to a narrow filament of polar vortex 15
air. Yet, from about 430 to 445 K the sonde traverses air from the mid-latitudinal tongue emphasised in Fig. 4. Indeed, the hygrosonde measured low water vapour mixing ra-tios in this altitude range. The model results are backed up by trajectory calculations (not shown here) that indicate an origin outside the polar vortex for the air mass with low humidity. Finally, above 450 K the sonde enters the polar vortex as clearly shown 20
both by the MIMOSA simulation and the water vapour measurement.
The measured H2O mixing ratio and the simulated small-scale distribution of po-tential vorticity show indeed a very good agreement. Evidently, MIMOSA is able to reproduce small scale filamentary structures not only with high horizontal but also with high vertical resolution, as shown for ozone lidar data by Heese et al. (2001). The 25
presented combination of water vapour measurements and high resolution PV fields shows that even small scale H2O structures like the water vapour peak at 17 km are well represented by the simulated PV tracer structures. Based on the correlation of wa-ter vapour and potential vorticity, the MIMOSA results confirm purely dynamical causes
ACPD
3, 4393–4410, 2003Stratospheric water vapour as tracer for vortex filamentation M. M ¨uller et al. Title Page Abstract Introduction Conclusions References Tables Figures J I J I Back Close Full Screen / Esc
Print Version Interactive Discussion
© EGU 2003
for the observed H2O diminuition in the water vapour profile of 11 February 2003.
4. Conclusions
In winter 2002/2003, three high resolution vertical profiles of stratospheric water vapour have been measured by balloon-borne frost point hygrometers from Ny- ˚Alesund, Spits-bergen. On 12 December 2002, and on 17 January 2003, the sondes detected the 5
water vapour distribution well inside the polar vortex. For both cases, the water vapour mixing ratio reached values of about 7 ppmv in an altitude of 24 km. Although large values are expected with increasing altitude due to the descent of humid air inside the vortex, the measured 7 ppmv are significantly higher than the 5 ppmv that are com-monly assumed for the calculation of PSC existence temperatures. The PSC type I a 10
consists of nitric acid trihydrate (NAT) (Voigt et al., 2000) and exists below the critical temperature TNAT (Hanson and Mauersberger, 1988). With every 1 ppmv increase in water vapour, TNATis shifted by approximately 0.8 K to higher temperatures. For the ice particles of PSC type II, the existence temperature is even shifted by approximately 1 K. The detected high water vapour mixing ratios should thus be taken into consideration 15
for the evaluation of PSC observations.
While high water vapour mixing ratios above 20 km were also detected by the hy-grosonde on 11 February 2003, the profile revealed large diminuition between 16 and 19 km. Diminuition and variability were also observed in ozone profiles measured by lidar and ECC sonde on the same day. The observed changes in the profiles are 20
found not to be related to chemical, but rather to dynamical processes. The ozone lidar profiles taken in the early morning hours of 11 February 2003, indicate that the lidar was measuring inside the polar vortex, while the evening profiles pronounce that mid-latitude air has been detected from 15 to 19 km. The lidar measurements thus give an impression of the general meteorological situation on that day which exhib-25
ited a north-eastward shift of the polar vortex. The balloon soundings, water vapour as well as ozone, measured air in the edge region of the vortex, characterised by the
ACPD
3, 4393–4410, 2003Stratospheric water vapour as tracer for vortex filamentation M. M ¨uller et al. Title Page Abstract Introduction Conclusions References Tables Figures J I J I Back Close Full Screen / Esc
Print Version Interactive Discussion
© EGU 2003
co-existence of thin filaments of different origin. The filamentary tracer distribution has been reproduced by the MIMOSA semi-lagrangian advection model, enabling to allo-cate mid-latitudinal laminae in the water vapour profile.
It has been shown that diminuition in polar stratospheric water vapour is not neces-sarily linked to dehydration due to PSC particle sedimentation. Instead, water vapour 5
has been proven to be a valuable tracer for dynamical processes in the polar strato-sphere.
Acknowledgements. Special thanks to the station team at Koldewey station in Ny- ˚Alesund for their help in the balloon launching procedures.
References
10
Abbas, M. M., Michelsen, H. A., Gunson, M. R., Abrams, M. C., Newchurch, M. J., Salawitch, R. J., Chang, A. Y., Goldman, A., Irion, F. W., Manney, G. L., Moyer, E. J., Nagaraju, R., Rinsland, C. P., Stiller, G. P., and Zander, R.: Seasonal variations of water vapor in the lower stratosphere inferred from ATMOS/ATLAS-3 measurements of H2O and CH4, Geophys. Res. Let., 23, 2401–2404, 1996.
15
Aellig, C. P., Bacmeister, J., Bevilacqua, R. M., Daehler, M., Kriebel, D., Pauls, T., Siskind, D., K ¨ampfer, N., Langen, J., Hartmann, G., Berg, A., Park, J. H., Russell III, J. M.: Space-borne H2O observations in the Arctic stratosphere and mesosphere in the spring of 1992, Geophys. Res. Let., 23, 2325–2328, 1996.
Brewer, A. W.: Evidence for a world circulation provided by the measurements of helium and 20
water vapor distribution in the stratosphere, Q. J. R. Meteorol. Soc., 75, 351–363, 1949. Carslaw, K. S., Wirth, M., Tsias, A., Luo, B. P., D ¨ornbrack, A., Leutbecher, M., Volkert, H.,
Renger, W., Bachmeister, J. T., Reimer, E., and Peter, T.: Increased stratospheric ozone depletion due to mountain-induced atmospheric waves, Nature, 391, 675–678, 1998. Flentje, H. and Kiemle, C.: Erosion and mixing of filaments in the arctic lower strato-25
sphere revealed by airborne lidar measurements, J. Geophys. Res., 108, 4232, doi: 10.1029/2002JD002168, 2003.
Forster, P. M. de F. and Shine, K. P.: Stratospheric water vapour changes as a possible contrib-utor to observed stratospheric cooling, Geophys. Res. Let., 26, 3309–3312, 1999.
ACPD
3, 4393–4410, 2003Stratospheric water vapour as tracer for vortex filamentation M. M ¨uller et al. Title Page Abstract Introduction Conclusions References Tables Figures J I J I Back Close Full Screen / Esc
Print Version Interactive Discussion
© EGU 2003
Hanson, D. R. and Mauersberger, K.: Laboratory studies of the nitric acid trihydrate: implica-tions for the south polar stratosphere, Geophys. Res. Let., 15, 855–858, 1988.
Harries, J. E.: The greenhouse Earth: A view from Space, Q. J. R. Meteorol. Soc., 122, 799– 818, 1996.
Hauchecorne, A., Godin, S., Marchand, M., Heese, B., and Souprayen, C.: Quantification 5
of the transport of chemical constituents from the polar vortex to midlatitudes in the lower stratosphere using the high-resolution advection model MIMOSA and effective diffusivity, J. Geophys. Res., 107, 8289, doi: 10.1029/2001JD000491, 2002.
Heese, B., Godin, S., and Hauchecorne, A.: Forecast and simulation of stratospheric ozone filaments: A validation of a high resolution potential vorticity advection model by airborne 10
ozone lidar measurements in winter 1998–1999, J. Geophys. Res., 106, 20 011–20 024, 2001.
Hofmann, D. J. and Oltmans, S. J.: The effect of stratospheric water vapor on the heteroge-neous reaction rate of ClONO2 and H2O for sulfuric acid aerosol, Geophys. Res. Let., 19, 2211–2214, 1992.
15
Lait, L. R.: An alternative form for potential vorticity, J. Atmos. Sci., 51, 1754–1759, 1994. Michelsen, H. A., Irion, F. W., Manney, G. L., Toon, G. C., and Gunson, M. R.: Features and
trends in Atmospheric Trace Molecule Spectroscopy (ATMOS) version 3 stratospheric water vapor and methane measurements, J. Geophys. Res., 105, 22 713–22 724, 2000.
Nedoluha, G. E., Bevilacqua, R. M., and Hoppel, K. W.: POAM III measurements of 20
dehydration in the Antarctic and comparison with the Arctic, J. Geophys. Res., 107, 10.1029/2001JD001184, 2002.
Newman, P. A., Lait, L. R., Schoeberl, M. R., Seablom, M., Coy, L., Rood, R., Swinbank, R., Proffitt, M., Loewenstein, M., Podolske, J. R., Elkins, J. W., Webster, C. R., May, R. D., Fahey, D. W., Dutton, G. S., and Chan, K. R.: Measurements of polar vortex air in the midlatitudes, 25
J. Geophys. Res., 101, 12 879–12 891, 1996.
Oinas, V., Lacis, A. A., Rind, D., Shindell, D. T., and Hansen, J. E.: Radiative cooling by stratospheric water vapor: big differences in GCM results, Geophys. Res. Let., 28, 2791– 2794, 2001.
Orsolini, Y. J.: On the formation of ozone laminae at the edge of the Arctic polar vortex, Q. J. 30
R. Meteorol. Soc., 121, 1923–1941, 1995.
Reid, S. J. and Vaughan, G.: Lamination in ozone profiles in the lower stratosphere, Q. J. R. Meteorol. Soc., 117, 825–844, 1991.
ACPD
3, 4393–4410, 2003Stratospheric water vapour as tracer for vortex filamentation M. M ¨uller et al. Title Page Abstract Introduction Conclusions References Tables Figures J I J I Back Close Full Screen / Esc
Print Version Interactive Discussion
© EGU 2003
Rind, D. E. and Lonergan, P.: Modeled impacts of stratospheric ozone and water vapor per-turbations with implications for high-speed civil transport aircraft, J. Geophys. Res., 100, 7381–7396, 1995.
Schiller, C., Engel, A., Schmidt, U., Borchers, R., and Ovarlez, J.: The partitioning of hydro-gen species in the Arctic winter stratosphere: Implications for microphysical parameters, J. 5
Geophys. Res., 101, 14 489–14 493, 1996.
Schiller, C., Bauer, R., Cairo, F., Deshler, T., D ¨ornbrack, A., Elkins, J., Engel, A., Flentje, H., Larsen, H., Levin, I., M ¨uller, M., Oltmans, S., Ovarlez, H., Ovarlez, J., Schreiner, J., Stroh, F., Voigt, C., and V ¨omel, H.: Dehydration in the Arctic stratosphere during the SOLVE/THESEO-2000 campaigns, J. Geophys. Res., 107, 10.1029/2001JD000463, 2002.
10
SPARC: Assessment of upper tropospheric and stratospheric water vapor. WMO/TD-1043, Stratospheric Processes and Their Role in Climate, World Meteorological Organization, Paris, 2000.
Voigt, C., Schreiner, J., Kohlmann, A., Zink, P., Mauersberger, K., Larsen, N., Deshler, T., Kr ¨oger, C., Rosen, J., Adriani, A., Cairo, F., Di Donfrancesco, G., Viterbini, M., Ovarlez, J., 15
Ovarlez, H., David, C., and D ¨ornbrack, A.: Nitric acid trihydrate (NAT) in polar stratospheric clouds. Science, 290, 1756–1758, 2000.
V ¨omel, H., Oltmans, S. J., Hofmann, D. J., Deshler, T., and Rosen, J. M.: The evolution of the dehydration in the Antarctic stratospheric vortex, J. Geophys. Res., 100, 13 919–13 926, 1995.
20
V ¨omel, H., Rummukainen, M., Kivi, R., Karhu, J., Turunen, T., Kyr ¨o, E., Rosen, J., Kjome, N., and Oltmans, S.: Dehydration and sedimentation of ice particles in the Arctic stratospheric vortex, Geophys. Res. Let., 24, 795–798, 1997.
Waugh, D. W., Plumb, R. A., Atkinson, R. J., Schoeberl, M. R., Lait, L. R., Newman, P. A., Loewenstein, M., Toohey, D. W., Avallone, L. M., Webster, C. R., and May, R. D.: Transport 25
ACPD
3, 4393–4410, 2003Stratospheric water vapour as tracer for vortex filamentation M. M ¨uller et al. Title Page Abstract Introduction Conclusions References Tables Figures J I J I Back Close Full Screen / Esc
Print Version Interactive Discussion
© EGU 2003
Fig. 1. Balloon-borne frost point hygrometer measurement on 17 January 2003, 15:00 UTC, in Ny- ˚Alesund with water vapour mixing ratio in ppmv (left) and temperature in◦C (right).
ACPD
3, 4393–4410, 2003Stratospheric water vapour as tracer for vortex filamentation M. M ¨uller et al. Title Page Abstract Introduction Conclusions References Tables Figures J I J I Back Close Full Screen / Esc
Print Version Interactive Discussion
© EGU 2003
Fig. 2. Balloon-borne frost point hygrometer measurement on 11 February 2003, 07:00 UTC, in Ny- ˚Alesund with water vapour mixing ratio in ppmv (left, black line) and temperature in◦C (right). For better comparability, the water vapour mixing ratio of 17 January is also shown (left, grey line) together with a circle that marks the most distinct deviations.
ACPD
3, 4393–4410, 2003Stratospheric water vapour as tracer for vortex filamentation M. M ¨uller et al. Title Page Abstract Introduction Conclusions References Tables Figures J I J I Back Close Full Screen / Esc
Print Version Interactive Discussion
© EGU 2003
Fig. 3. Ny- ˚Alesund ozone profiles retrieved on 11 February 2003 by lidar (left) and by balloon-borne ozone sonde (right).
ACPD
3, 4393–4410, 2003Stratospheric water vapour as tracer for vortex filamentation M. M ¨uller et al. Title Page Abstract Introduction Conclusions References Tables Figures J I J I Back Close Full Screen / Esc
Print Version Interactive Discussion
© EGU 2003
Figure 4: Geographical distribution of modified potential vorticity (MPV) on 11 February 2003, at 06 UTC, simulated by MIMOSA. Polar vortex air is marked with bright yellow colours, mid-latitudinal air with dark red and blue colours. The white square flags Ny-Ålesund, while the black line indicates the location of the cross-section shown in Figure 5.
Fig. 4. Geographical distribution of modified potential vorticity (MPV) on 11 February 2003, at 06:00 UTC, simulated by MIMOSA. Polar vortex air is marked with bright yellow colours, mid-latitudinal air with dark red and blue colours. The white square flags Ny- ˚Alesund, while the black line indicates the location of the cross-section shown in Fig. 5.
ACPD
3, 4393–4410, 2003Stratospheric water vapour as tracer for vortex filamentation M. M ¨uller et al. Title Page Abstract Introduction Conclusions References Tables Figures J I J I Back Close Full Screen / Esc
Print Version Interactive Discussion
© EGU 2003
Fig. 5. MIMOSA fine scale structures of modified potential vorticity (colour coded) on 11 February 2003, 06:00 UTC, in a longitudinal cross-section at 78◦N revealing filaments of mid-latitudinal air (blue colours). Superimposed is the water vapour mixing ratio (black line, up-per axis) and the flight trajectory (white dotted line, lower axis) of the frost point hygrometer launched on 11 February 2003, at 07:00 UTC.