HAL Id: hal-00317755
https://hal.archives-ouvertes.fr/hal-00317755
Submitted on 22 Dec 2004
HAL is a multi-disciplinary open access
archive for the deposit and dissemination of
sci-entific research documents, whether they are
pub-lished or not. The documents may come from
teaching and research institutions in France or
abroad, or from public or private research centers.
L’archive ouverte pluridisciplinaire HAL, est
destinée au dépôt et à la diffusion de documents
scientifiques de niveau recherche, publiés ou non,
émanant des établissements d’enseignement et de
recherche français ou étrangers, des laboratoires
publics ou privés.
Ozone and water vapour in the austral polar
stratospheric vortex and sub-vortex
E. Peet, V. Rudakov, V. Yushkov, G. Redaelli, A. R. Mackenzie
To cite this version:
E. Peet, V. Rudakov, V. Yushkov, G. Redaelli, A. R. Mackenzie. Ozone and water vapour in the austral
polar stratospheric vortex and sub-vortex. Annales Geophysicae, European Geosciences Union, 2004,
22 (12), pp.4035-4041. �hal-00317755�
SRef-ID: 1432-0576/ag/2004-22-4035 © European Geosciences Union 2004
Annales
Geophysicae
Ozone and water vapour in the austral polar stratospheric vortex
and sub-vortex
E. Peet1, V. Rudakov2, V. Yushkov2, G. Redaelli3, and A. R. MacKenzie1
1Environmental Science Department, Lancaster University, LA1 4BA, UK 2Central Aerological Observatory, Russia
3Department of Physics, University of l’Aquila, Italy
Received: 17 March 2004 – Revised: 16 July 2004 – Accepted: 20 August 2004 – Published: 22 December 2004
Abstract. In-situ measurements of ozone and water vapour, in the Antarctic lower stratosphere, were made as part of the APE-GAIA mission in September and October 1999. The measurements show a distinct difference above and be-low the 415 K isentrope. Above 415 K, the chemically per-turbed region of low ozone and water vapour is clearly evi-dent. Below 415 K, but still above the tropopause, no sharp meridional gradients in ozone and water vapour were ob-served. The observations are consistent with analyses of po-tential vorticity from the European Centre for Medium Range Weather Forecasting, which show smaller radial gradients at 380 K than at 450 K potential temperature. Ozone loss in the chemically perturbed region above 415 K averages 5 ppbv per day for mid-September to mid-October. Apparent ozone loss rates in the sub-vortex region are greater, at 7 ppbv per day. The data support, therefore, the existence of a sub-vortex region in which meridional transport is more efficient than in the vortex above. The low ozone mixing ratios in the sub-vortex region may be due to in-situ chemical destruction of ozone or transport of ozone-poor air out of the bottom of the vortex. The aircraft data we use cannot distinguish be-tween these two processes.
Key words. Meteorology and atmospheric dynamics (po-lar meteorology) – Atmospheric composition and structure (middle atmosphere–composition and chemistry)
1 Introduction
Since the discovery in the 1980s of anomalously low ozone column abundances over the Antarctic by Farman et al. (1985), ozone abundances in the Antarctic between the months of September to November have continued to de-cline. Farman et al. (1985) showed that total ozone levels had been in decline at the Halley Bay station since the 1970s, and their results were confirmed by satellite data which showed
Correspondence to: A. R. MacKenzie
that the depletion occurred over a very extended region (Sto-larski et al., 1986; Solomon et al., 1986). Between 1985 and 1989 ozone levels continued to decline in such a way that by 1989, 70% of the total column ozone content over the Antarctic continent was lost during the month of September and early October (Deshler et al., 1990). Such loss equates to the removal of 3% of the world’s ozone in a period of six weeks, demonstrating just how rapidly the global state of the atmosphere can change (Anderson et al., 1991). The ozone hole of 1992 showed a very dramatic demonstration of the rate of ozone depletion during austral spring, as measured ozone amounts were about 50% of that of 1979 (Gleason et al., 1993).
The Antarctic ozone hole occurs within a polar vortex that forms over the Antarctic at the onset of polar night. The vortex consists of strong, westerly winds that inhibit mixing between the polar region and the middle latitudes, resulting in a core of very cold air inside the vortex. Ozone is then depleted within this region, as a result of heterogeneous re-actions on Polar Stratospheric Clouds (PSCs) that form in the cold vortex air. PSC formation dehydrates and denitri-fies air within the vortex. Heterogeneous reactions on the surfaces of PSCs, involving halocarbon breakdown products, result in ozone destruction (Toon and Turco, 1991). The vor-tex remains throughout austral winter, spring, and early sum-mer. The vortex remains ozone depleted until it breaks down, whereupon ozone-rich mid-latitude air is mixed with the po-lar air, increasing ozone abundances in popo-lar regions and de-creasing ozone abundances in the middle latitudes.
The extent and longevity of the polar vortex depends on stratospheric fluid dynamics, particularly the propagation of planetary waves (Schoeberl and Hartmann, 1991). Whilst the longevity of the ozone hole each year depends on the longevity of the polar vortex, the spatial extent of ozone de-pletion at any time depends on the extent of cold tempera-tures, the latitude of the terminator, and transport and mix-ing within the vortex. The region of ozone depletion and the region of the polar vortex are, therefore, not necessarily identical. To distinguish the chemically defined ozone hole
4036 E. Peet et al.: Ozone and water vapour in the austral polar stratosphere
from the dynamically defined polar vortex, the region with low ozone mixing ratios is called the chemically perturbed region (CPR) (Proffitt et al., 1989).
Global observations of column ozone have also shown a decline in abundance, with 3–5% decreases in the middle latitudes and 6–8% decreases at high latitudes (Stolarski et al., 1992). There is some debate as to just how isolated the air inside the vortex is from the middle latitudes, and so to what degree polar ozone loss can influence mid-latitude ozone loss. Tuck (1989), Proffitt et al. (1989), and Tuck et al. (1993) concluded that the air inside the vortex is contin-ually mixed with that outside the vortex, creating a situation whereby the polar vortex acts as a “flowing processor”. They hypothesised that a large downward flow exists through the polar vortex which then moves outwards into the middle lat-itudes. Contrary to this, Juckes and McIntyre (1987), McIn-tyre (1989) and Hartmann et al. (1989) argued that the vortex behaved like a “containment vessel”. They stated that at the vortex edge was a region of strong radial gradients of poten-tial vorticity (PV) that acted as a barrier to transport across the vortex edge, therefore effectively sealing the vortex off from the middle latitudes. However, a common feature of both analyses is that some mixing of air parcels can occur in the lowermost stratosphere, related to a clear change in the dynamical character of the stratosphere below about 400 K potential temperature. The lowermost stratosphere is that part of the stratosphere for which adiabatic paths to the tropo-sphere exist i.e. isentropic surfaces in the lowermost strato-sphere will cross the tropopause at some latitude (Holton et al., 1995).
Below, we use in-situ ozone and water vapour measure-ments, along with potential vorticity analyses and TOMS ozone column fields, to investigate the horizontal and ver-tical extent of the CPR over Antarctica in spring.
2 Data
APE-GAIA (Airborne Polar Experiment–Geophysica Air-craft In Antarctica) aimed to study the chemistry of the Antarctic stratosphere, using the Russian M55 Geophysica aircraft (Carli et al., 2000, 2001). The Geophysica is a high-altitude aircraft, able to fly in the upper troposphere and lower stratosphere, carrying a large payload (1500 kg) of in-situ and remote sensing equipment (Stefanutti et al., 1999b). The campaign ran from 15 September to 14 October 1999, from a base at Ushuaia, in Tierra del Fuego, Argentina. APE-GAIA was conducted at the beginning of spring in the South-ern Hemisphere, which, in terms of the ozone hole, coincides with the transition phase between the depletion and recovery phases (Solomon et al; 1986). The mission was designed to look at three aspects of stratospheric processes in particular: the contributions of various chemical processes involved in ozone hole formation, the interactions between air masses of the polar vortex with those of the middle latitudes, and the determination of ozone loss in the middle latitudes due to transport from the vortex (Carli et al., 2000).
Five scientific flights were carried out from Ushuaia. Be-low, we focus on the flights of 21 September, 23 September, 8 October, and 12 October 1999. The flight of 2 October 1999 studied a filament of vortex, and did not penetrate the main body of the vortex (Redaelli et al., 2001). Since we are primarily interested in the CPR, we will not discuss the flight of 2 October. During the period of the mission, sci-entists also conducted a series of ground-based and balloon measurements, from various locations along the Antarctic Peninsula, from Ushuaia, and from Punta Arenas (Carli et al., 2001). This was to validate the measurements taken by the Geophysica and to extend the temporal and spatial range of the results of the project.
The scientific instruments carried by the Geophysica are installed in bays on the aeroplane fuselage, on the wings, and in the tail boom (Stefanutti et al., 1999b). Instruments on board the Geophysica during the APE-GAIA mission col-lected in-situ and remote-sensing data on both chemistry and microphysics (Carli et al., 2000). Here we use data from the FLASH and ECOC instruments, which provide in-situ infor-mation about ozone and water vapour concentrations within the stratosphere in the Antarctic region. The remote-sensing measurements are discussed, and compared to in-situ data, in Blom et al. (2001).
The FLASH (Fluorescent Aircraft Stratospheric Hygrom-eter) instrument measures water vapour, from approximately 8 km altitude to the maximum altitude of the flight. The hy-grometer is an optical fluorescent type based upon
Lyman-α fluorescence (Merkulov and Yushkov, 1999). The FISH in-situ total water instrument (Z¨oger et al., 1999) also flew during APE-GAIA. A detailed intercomparison of the two instruments is outside the scope of the present study; further information will be given in a forthcoming paper (“Variabil-ity in the tropopause and hygropause over the equatorial In-dian Ocean during February and March 1999”)1
ECOC (Electrochemical Ozone Cell) consists of an elec-trochemical cell filled with an aqueous KI solution and a teflon sampler with a pump (Kyr¨o et al., 2000). The air is circulated through the electrochemical cell where the ozone reacts with a solution of potassium iodide (KI). The reac-tion induces an electric current around the outside of the cell from which ozone concentration can be determined. ECOC has a sensitivity threshold of 1 ppbv (Kyr¨o et al., 2000) and acquires a measurement every 5 sec, therefore it tends to average out rapid ozone fluctuations. The FOZAN instru-ment (Yushkov et al., 1999), which measures ozone using the chemiluminescence of a dye on reaction with ozone, also flew during APE-GAIA. This instrument has a more rapid response (1 Hz), but has a variable sensitivity to ozone and therefore, needs careful post-flight re-calibration. Since the higher time resolution provided by FOZAN was not required for our analysis, we have used ECOC data only.
1MacKenzie, A. R., Schiller, C., and Adriani, A., et al.:
Vari-ability in the tropopause and hygropause over the equatorial Indian Ocean during February and March 1999, Atmos. Chem. Phys. Dis-cuss., submitted, 2004.
Table 1. Comparison of vortex edge latitude, from the ECMWF analyses, ozone hole outer edge latitude from TOMS data, and CPR latitude
from in-situ measurements. The vortex edge in the ECMWF analysis is taken to be the latitude of the −37 PVU or −44 PVU contour in the 45–75◦W sector. The ozone hole outer edge latitude is taken to be the latitude of the 225 DU contour in the 45–75◦W sector. The uncertainty in the CPR latitude reflects the width of the region with rapidly increasing ozone on the return flight leg.
Date 21 September 23 September 2 October 8 October 12 October Vortex edge (−37 PVU) 63 ± 3 57 ± 1 65 ± 5* 69 ± 0.5 55 ± 2 Vortex edge (−44 PVU) 67 ± 2 70 ± 0.5 65 ± 5* 71 ± 0.5 65 ± 1 Ozone hole edge 66 ± 1 65 ± 2 61 ± 3 73 ± 1 64 ± 2 CPR edge 60 ± 1 63 ± 2 59 ± 2 −** 62 ± 2
* Convoluted contours in the region of the Antarctic peninsula ** Aircraft did not penetrate main body of vortex
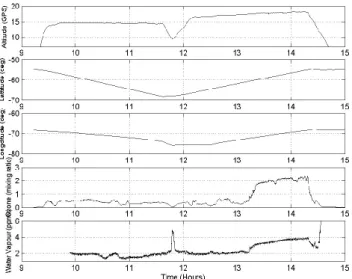
Fig. 1. Altitude, latitude, longitude, ozone and water vapour as a
function of time for the 21 September 1999 flight. Note that as the stratosphere is relatively dry in comparison with the troposphere, the water vapour data in subplot (e) has been enlarged so that the stratospheric portion can be clearly observed.
3 Results and Discussion
Figure 1 shows the time series relationship for ozone, water vapour, altitude, latitude and longitude for the flight of 21 September 1999. The flight path taken by the Geophysica, indicated in sub-plots a), b) and c) of Fig. 1, was initially SSW at about 14.7 km (geometric altitude, potential temper-atures between 370 K and 380 K). The aeroplane then dived down into the troposphere, re-ascended, and returned in a di-rect northerly didi-rection, climbing to an altitude of 18 km.
The ozone concentration remained low throughout the out-bound flight leg. However, on the return flight leg, at ap-proximately (60◦S 70◦W), a sharp increase in ozone con-centration was observed. Similar observations were recorded in other flights during the APE-GAIA mission, i.e. a sharp change in ozone concentration, only observed on the return, higher altitude portion of the flight. The return flight leg on 21 September 1999 shows the Geophysica passing from a
re-gion of ozone depletion across a well-defined boundary into ozone-rich air, that is, the aeroplane ascended into the CPR from below and then exited the CPR during the NNE-ward horizontal flight. The rapid change in ozone is not seen on the outbound flight leg, which was at a lower altitude, but still in the stratosphere. The tropopause was observed to be at ap-proximately 10.7 km (a potential temperature of 320 K) alti-tude during ascent and descent into Ushuaia on 21 Septem-ber 1999 (data not shown). During the dive the lapse rate was approximately 2 K km−1throughout its duration (i.e. for altitudes between 16 and 10 km).
The most noticeable feature of the water vapour time se-ries in Fig. 1e is the increase in water vapour as the Geo-physica dives. However, at cruise altitudes, there is also an increase of 1 ppmv in the water vapour mixing ratio on the return flight leg. This increase is concurrent with the sharp change in ozone concentration shown in Fig. 1d. The rela-tive change in concentration of water vapour over the polar vortex is clearly not as great as that of ozone. However, the changes in ozone and water vapour concentrations both show the boundary of the CPR, as noted previously (Proffitt et al., 1989).
In Table 1 we compare the latitude of the edge of the CPR, as measured in-situ, with the latitudes of the edge of the vor-tex and the edge of the TOMS ozone hole. The latitude of the edge of the CPR is generally two or more degrees equa-torward of the edge of the TOMS ozone hole, defined as the latitude of the 225 DU contour. This difference in latitudes is usually within the error bars of both measurements (the calculations of the errors associated with each measure are described in the caption for Table 1. The latitude of the edge of the CPR is generally approximately coincident with the latitude of the edge of the vortex, as diagnosed from the lat-itude of the −37 PVU contour in the middle of the region of large PV gradient.
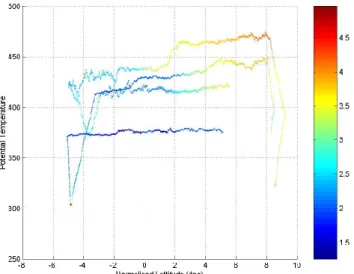
Figures 2 and 3 show the ozone and water vapour data, respectively, for all the flights, plotted against altitude and against latitude relative to the edge of the CPR. The abso-lute latitude of the edge of the CPR varies as the polar vortex varies, due to planetary waves, so the graphs in Figs. 2 and 3 are normalised by setting the latitude of the edge of the
4038 E. Peet et al.: Ozone and water vapour in the austral polar stratosphere
Fig. 2. Ozone as a function of potential temperature and latitude,
relative to the edge of the chemically perturbed region above 415 K, for all flights.
Fig. 3. Water vapour as a function of potential temperature and
lat-itude, relative to the edge of the chemically perturbed region above 415 K, for all flights.
CPR to 0◦in each case. The latitude of the CPR edge was estimated from the in-situ ozone measurements at higher al-titude. Plotting the data in this way shows that the data– for ozone at least–occupy a relatively large amount of the relative-latitude potential-temperature domain. Below, we will classify data from above 415 K as “in CPR” or “out of CPR”, and classify data from below 415 K as “beneath CPR” or “not beneath CPR”.
A sharp meridional gradient in the mixing ratio can be seen in the upper portion of each graph, indicating the po-sition of the CPR. This sharp gradient separates the area of high mixing ratios on the right from the area of low mixing ratios on the left and is true for both ozone and water vapour. Below approximately the 415 K isentrope, the CPR is not
ev-Fig. 4. Potential vorticity for 23 September 1999, diagnosed from
ECMWF analyses, for the 380 K and 435 K isentropic surfaces.
ident, since there is a much more gradual change in ozone or water vapour mixing ratios with latitude (see below). The outbound flight leg on 23 September 1999 occurred at a suf-ficiently high altitude for the CPR boundary to be defined by the ozone mixing ratio on both the outbound and return flight legs. The CPR boundary of the outbound flight was at 60.4◦S (theta=420 K), whereas on the return portion of the flight it was at 62.6◦S (theta=430 K). This change in the lati-tude of the CPR is due primarily to a planetary-wave-induced undulation in the position of the vortex, rather than any vari-ation in the edge of the CPR with height (Fig. 4). The CPR edge on the return leg is used in Table 1 and for the normali-sation in Fig. 2.
The change in the character of the meridional gradient of ozone above and below 415 K, corresponds to a change in the dynamics of the polar region. For example, Figs. 4a and b show the potential vorticity map for 380 K and 435 K isen-tropic surfaces, respectively, on 23 September 1999. The central blue area denotes the central region of the polar
vor-tex and the edge appears as a narrow edge of steep potential vorticity (PV) gradients. The PV maps show that at 380 K, below the transition zone in Fig. 2, the steep PV gradients are disturbed on one side of the vortex.
McIntyre (1995) described a transition zone at approxi-mately the 400 K isentrope between the stratospheric polar vortex region and a stratospheric region below, which he called the stratospheric sub-vortex region. He states that the sub-vortex region is like the polar vortex in that it is a region of low temperature, yet different in terms of transport. The data in Fig. 2 show a sharp change in ozone concentration on higher isentropic surfaces, demonstrating the resistance of the stratospheric polar vortex to mixing. The lower isentropic surfaces show little change in ozone concentration with lat-itude, which is in the region where McIntyre (1995) states that the sub-vortex exists. The lack of a distinct change in concentration of either ozone or water vapour in this region would suggest that mixing does occur between the strato-spheric sub-vortex and the middle latitudes.
The lowermost isentropic surfaces in the lower strato-sphere are stirred strongly as a consequence of the movement of synoptic scale weather systems. The transition isentrope at 400 K is therefore the altitude below which the stirring pro-cess overcomes the propro-cesses of vortex edge formation, stir-ring it out of existence (McIntyre, 1995). The isentropic sur-face of the transition zone depends upon the intensity of the synoptic scale weather systems in the tropopause and there-fore may be somewhat above or below 400 K. In our data the transition zone appears to be at about 415 K, which corre-sponds roughly to 70 mbar and 18 km altitude. The stirring process transports air parcels between the sub-vortex and the middle latitudes (McIntyre, 1995), which would account for the lack of change in ozone and water vapour concentration below 415 K in Figs. 2 and 3. Tuck et al. (1997) observed expanses of air from the polar regions within the middle lat-itudes in a zone between the tropopause and θ ∼400 K, pro-viding more evidence for meridional transport and mixing across the sub-vortex.
Tables 2 and 3 show mean ozone mixing ratios, for both the outbound and return legs of each flight, i.e. both above and below the 415 K transition zone. Averages are calcu-lated for portions of each flight outside and within, beneath or not, the CPR. Table 2 shows, with the exception of the out-ward flight leg on 12 October 1999, that above 415 K there is a clear distinction between the mean ozone mixing ratios. The ozone mixing ratios are much lower inside the vortex than outside. Table 3, however, shows a different relation-ship below 415 K: ozone mixing ratios are similar inside and outside the vortex. Average ozone mixing ratios below 415 K and beneath the CPR are similar to those above 415 K and in the CPR, and slightly lower than those below 415 K but not below the CPR.
Table 2 shows an unexpected relationship for the flight of 12 October 1999. On the outbound leg of this flight, the mean ozone mixing ratio above 415 K outbound is greater inside the vortex than outside. Looking at the rest of the data within Table 2, it is apparent that, on 12 October 1999, the
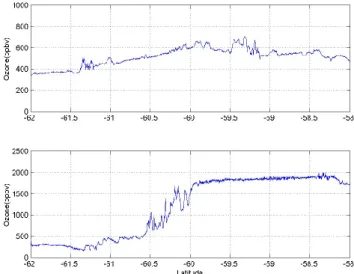
Fig. 5. The concentration of ozone across the region of the polar
vortex at above 415 K (bottom panel) and below 415 K (top panel) potential temperature.
mean ozone mixing ratio outside the vortex is anonymously low, whilst the mean ozone mixing ratio inside the vortex is similar to values from other flights. The data for the above-415 K-outbound mean mixing ratio are relatively few, and all below the 425-K potential temperature. The CPR edge may be further equatorward at around 420 K than at the higher po-tential temperatures sampled during the return flight leg, or a filament of low ozone air may have been sampled at 420 K outside the main body of the CPR.
Tables 2 and 3 show lower average ozone mixing ratios in October than in September within and beneath the CPR, but no trend outside and not beneath the CPR. Averaging the September flights, and comparing to the flight of 12 Oc-tober, gives apparent ozone destruction rates of 5 ppbv per day above 415 K, and 7 ppbv per day below. These deple-tion rates are lower than those calculated for earlier in the spring (see the discussion in Santacesaria et al., 1999). The lower rates reported here are to be expected, since most of the available ozone has already been destroyed.
Figure 5a and b show a close-up of the ozone mixing ratio in the region of the vortex edge below and above the tran-sition zone, respectively. Figure 5b shows the sharp change in ozone concentration that represents the polar vortex edge and demonstrates its layered structure. The pleated effect at the edge of the polar vortex is thought to be caused by the folding and stretching of air on the equatorward side of the vortex, which occurs as a consequence of planetary wave breaking (Bowman and Magnus, 1993). This results in thin strands of low ozone air being pulled out of the ozone hole more often than mid-latitude air being pulled into the vortex (Chen, 1994). The steep PV gradients at the vortex act as a barrier to large-scale exchange with the middle latitudes. Bowman (1993) and Chen et al. (1994) both found that there was an exchange across the vortex in the lower stratosphere. Their transport calculations suggested strongly the existence
4040 E. Peet et al.: Ozone and water vapour in the austral polar stratosphere
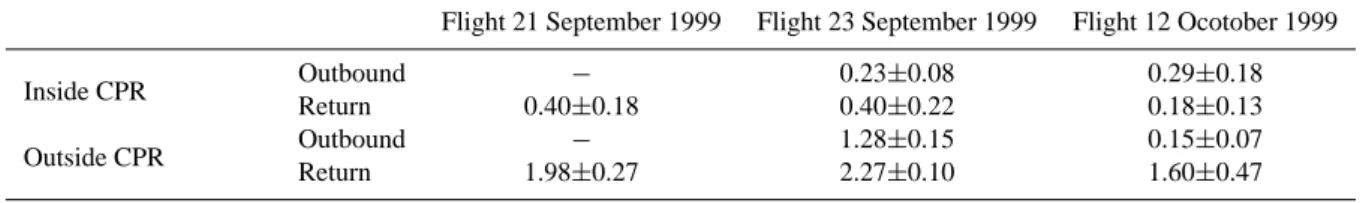
Table 2. Mean ozone mixing ratios (ppmv) above the 415 K isentrope, measured by the APE-GAIA mission in September and October 1999.
Standard deviations are reported along with the means. “CPR” stands for chemically perturbed region.
Flight 21 September 1999 Flight 23 September 1999 Flight 12 Ocotober 1999
Inside CPR Outbound − 0.23±0.08 0.29±0.18
Return 0.40±0.18 0.40±0.22 0.18±0.13
Outside CPR Outbound − 1.28±0.15 0.15±0.07
Return 1.98±0.27 2.27±0.10 1.60±0.47
Table 3. Mean ozone miximg ratios (ppmv) below the 415 K isentrope, but above the tropopause, measured by the APE-GAIA mission in
September and October 1999. Standard deviations are reported along with the means. “CPR” stands for chemically perturbed region.
Flight 21 September 1999 Flight 23 September 1999 Flight 12 Ocotober 1999
Beneath CPR Outbound 0.37±0.09 0.30±0.05 0.18±0.10
Return 0.44±0.09 0.37±0.02 0.26±0.04
Not beneath CPR Outbound 0.46±0.12 0.60±0.25 0.32±0.19
Return 0.43±0.22 0.36±0.11 0.43±0.18
of a transition altitude, above which the Antarctic polar vor-tex is effectively isolated, and below which it is less isolated. Figure 5a is for an outbound flight leg, and for the same range of latitudes as in Fig. 5b. However, unlike in Fig. 5b, there is no significant change to indicate the presence of an isolated CPR. Instead, there is a rather smooth meridional gradient in ozone, with ozone mixing ratios decreasing towards the pole.
4 Conclusions
Data from the APE-GAIA clearly showed that the structure of the 1999 Antarctic chemically perturbed region varies dy-namically in the vertical. A transition altitude at approx-imately 415 K separates the polar-vortex-dominated region above from the sub-vortex region below. The air inside the CPR appears to be isolated from mid-latitude air. Beneath the CPR, air is not as isolated. There is considerable variability in the latitude of the CPR edge above 415 K, caused by the folding and stretching of air as a consequence of planetary wave effects.
Ozone depletion appears to be ongoing during the APE-GAIA campaign, averaging 5 ppbv/day in the CPR, and 7 ppbv/day beneath the CPR. The meridional gradient of ozone beneath the CPR is such that this apparent ozone de-pletion cannot be due to mixing with mid-latitude air. How-ever, it is not possible to say from the observations whether the apparent ozone depletion beneath the CPR is actually downward transport of ozone-depleted air from the CPR.
Acknowledgements. We acknowledge the support of Programma
Nazionale di Ricerche in Antartide (PNRA), Italy, which funded most of the aircraft preparation and campaign activities in APE-GAIA. B. Carli (IROE CNR) ably led the mission. We also acknowledge mission Core Group members Ugo Cortesi (IROE
CNR), C. Blom (FZ Karlsruhe), and M. Chipperfield (University of Leeds, UK). We wish to thank the Geophysica pilots and crew. We gratefully acknowledge the TOMS data team (NASA, Goddard Space Flight Center) for the provision of the total ozone satellite data.
Topical Editor O. Boucher thanks L. Stefanutti and another ref-eree for their help in evaluating this paper.
References
Anderson J. G., Toohey, D. W., and Brune, W. H.: Free Radicals Within the Antarctic Vortex: The Role of CFCs in Antarctic Ozone Loss Science, 251, 30–45. 1991.
Blom, C. E., H¨opfner, M., Lessenich, K., Bianchini, G., Cortesi, U., Palchetti, L., Rudakov, V., Ulanovsky, A., Ravegnani, F., and Karhu, J. A.: Intercomparison of 2D cross-sections for ozone from the FTS limb sounders MIPAS-STR and SAFIRE-A: a study on the reliability of their redundant and complementary data, Newsletter Europ. Geophys. Soc., 78, EGS2001 XXVI General Assembly, Nice, France, 2001.
Bowman, K. P.: Large-scale isentropic mixing properties of the Antarctic polar vortex from analysed winds, Journal of Geophys-ical Research-Atmospheres, 98, D12, 23 013–23 027, 1993. Bowman, K. P. and Magnus, N. J.: Observations of Deformation
and Mixing of the Total Ozone Fieldin the Antarctic Polar Vortex, Journal of Atmospheric Sciences, 50, 2915–2921, 1993. Carli, B., Cortesi, U., Blom, C. E., Chipperfield, M. P., De Rossi,
G., and Redaelli, G.: Airborne Polar Experiment in Antarctica (APE-GAIA), SPARC Newsletter, 15, 21–24, 2000.
Carli, B., Cortesi, U., De Rossi, G., and Redaelli, G.: Airborne Polar Experiment Geophysica Aircraft In Antarctica, a scientific campaign in the Antarctic stratosphere for the study of the ozone hole, Proc. Fifth Intern. Airborne Remote Sensing Conf., San Francisco, CA, 2001.
Chen, P.: The permeability of the Antarctic vortex edge, J. Geophys. Res., 99, D10, 20 563–20 571, 1994.
Chen, P., Holton, J. R., Oneill, A., and Swinbank, R.: Quasi-horizontal transport and mixing in the Antarctic stratosphere, J. Geophys. Res., 99, 16 851–16 866, 1994.
Chubachi, S. J.: Annual variation of total ozone at Syowa Station, Antarctica, J. Geophys. Res., 102, 1349–1354, 1997.
Deshler, T., Hofmann, D. J., Hereford, J. V., and Sutter, C. B.: Ozone and temperature profiles over McMurdo Station Antarc-tica in the spring of 1989, Geophys. Res. Let., 17, 151–154. 1990.
Farman, J. C., Gardiner, B. G., and Shanklin, J. D.: Large losses of total ozone in Antarctica reveal seasonal ClOx/NOxinteraction,
Nature, 315, 207–210, 1985.
Gleason, J. F., Bhartia, P. K., Herman, J. R., McPeters, R., New-man, P., Stolarski, R. S., Flynn, L., Labow, G., Larko, D., Seftor, C., Wellemeyer, C., Komhyr, W. D., Miller, A. J., and Planet, W.: Record Low Global Ozone in 1992, Science, 260, 523–526, 1993.
Hartmann, D. L., Heidt, L. E., Loewenstein, M., Podolske, J. R., Vedder, J., Starr, W. L., and Strahan, S. E.: Transport Into the South Polar Vortex in Early Spring, J. Geograph. Res., 94, 16 779–16 795, 1989.
Holton, J. R., Haynes, P. H., McIntyre, M. E., Douglass, A., Rood, R., and Pfister, L.: Stratosphere-troposphere exchange, Rev. Geophys., 33, 403–439, 1995.
Juckes, M. N. and McIntyre, M. E.: A high-resolution one-layer model of breaking planetary-waves in the stratosphere, Nature, 328 (6131), 590–596, 1987.
Kyr¨o, E., Kivi, R., Turunen, T., Aulamo, H., Rudakov, V. V., Khat-tatov, V. V., MacKenzie, A. R., Chipperfield, M. P., Lee, A. M., Stefanutti, L., and Ravegnani, F.: Ozone measurements during the Airborne Polar Experiment: aircraft instrument validation; isentropic trends; and hemispheric fields prior to the 1997 Arctic ozone depletion, J. Geophys. Res., 105, 14 599–14 611, 2000. McIntyre, M. E.: On the Antarctic Ozone Hole, J. Atmos. Ter.
Phys., 51, 29–43, 1989.
McIntyre, M. E.: The stratospheric polar vortex and sub-vortex: fluid dynamics and midlatitude ozone loss, Philosophical Trans-actions of the Royal Society of London Series A-Mathematical Physical and Engineering Sciences, 352, 227–240, 1995. Merulov, S. and Yushkov, V.: Some results of aircraft stratospheric
water vapor measurement in the arctic polar vortex (in Russian), Meteorology and Hydrology, 7, 107–113, 1999.
Proffitt, M. H., Kelly, K. K., Powell, J. A., Gary, B. L., Loewenstein, M., Podolske, J. R., Strahan, S. E., and Chan, K. R.: Evidence for diabatic cooling and poleward transport within and around the 1987 Antarctic ozone hole, J. Geophys. Res. Atmos., 94, 16 797– 16 813, 1989.
Proffitt, M. H., Powell, J. A., Tuck, A. F., Fahey, D. W., Kelly, K. K., Krueger, A. J., Schoeberl, M. R., Gary, B. L., Margitan, J. J., Chan, K. R., Loewenstein, M., and Podolske, J. R.: A Chemi-cal Definition of the Boundary of the Antarctic Ozone Hole, 94, 11 437–11 448, 1989.
Redaelli, G., Dragani, R., Grassi, B., Rudakov, V. V., Ulanovsky, A., Volk, C. M., Ravegnani, F., and Visconti, G.: Model guided ob-servation and simulation of vortex filament during APE-GAIA, Proc. Europ. Geophys. Soc., General Assembly, Nice, France, 2001.
Santacesaria, V., Stefanutti, L., Morandi, M., Guzzi, D., and MacKenzie, A. R.: Two-year (1996/1997) ozone DIAL measure-ment over Dumont d’Urville (Antarctica), Geophys. Res. Lett., 26, 463–466, 1999.
Schoeberl, M. R. and Hartmann, D. L.: The dynamics of the strato-spheric polar vortex and its relation to springtime ozone deple-tions, Science, 251, 46–52, 1991.
Schoeberl, M. R., Lait, L. R., Newman, P. A., and Rosenfield, J. E.: The Structure of the Polar Vortex, J. Geophys. Res., 97, 7859– 7882, 1992.
Solomon, S., Garcia, R. R., Sherwood, R. F., and Wuebbles, D. J.: On the depletion of Antarctic ozone, Nature, 321, 755–758., 1986.
Stefanutti, L., MacKenzie, A. R., Balestri, S., Khattatov, V., Fiocco, G., Kyr¨o, E., Peter, T.: Airbourne Polar Experiment – Polar Ozone, Leewaves, Chemistry, and Transport (APE-POLECAT): Rationale, road map and summary of measurements, J. Geophys. Res., 104, 23 941–23 959, 1999a.
Stefanutti, L., Sokolov, L., Balestri, S., MacKenzie, A. R., Khatta-tov, V.: The M-55 Geophysica as a Platform for the Airborne Po-lar Experiment. J. Atmos. and Oc. Tech., 16, 1303–1312, 1999b. Stolarski, R. S., Krueger, A. J., Schoeberl, M. R., McPeters, R. D., Newman, P. A. and Alpert, J. C.: Nimbus 7 SBUV/TOMS measurements of the springtime Antarctic ozone hole, Nature, 322, 808–811, 1986.
Stolarski, R. S., Bojkov, R., Bishop, L., Zerefos, C., Staehelin, J., and Zawodny, J.: Measured trends in Stratospheric Ozone, Sci-ence, 256, 342–349, 1992.
Toon, O. B. and Turco, R. P.: Polar Stratospheric Clouds and Ozone Depletion, Scientific American, 264, 687–74, 1991.
Tuck, A. F.: Synoptic and chemical evolution of the Antarctic vor-tex in late winter and early spring, 1987, J. Geophys. Res. At-mos., 94, 11 687–11 737, 1989.
Tuck, A. F., Russell, J. M., and Harries, J. E.: Stratospheric dry-ness: anticipated desiccation over Micronesia and Antarctica, Geophys. Res. Let., 20, 1227–1230, 1993.
Tuck, A. F., Baumgardner, D., Chan, K. R., Dye, J. E., Elkins, J. W., Hovde, S. J., Kelly, K. K., Loewenstein, M., Margitan, J. J., May, R. D., Podolske, J. R., Proffitt, M. H., Rosenlof, K. H., Smith, W. L., Webster, C. R., Wilson, J. C.: The Brewer Dobson Circula-tion in the Light of High Altitude In Situ Aircraft ObservaCircula-tions, Quart. J. Roy. Meteorol. Soc., 123, 1–69, 1997.
Yuskhov, V., Ulanovsky, A., Lechenuk, N., Roudakov, I., Arshinov, K., Tikhonov, F., Stefanutti, L., Ravegnani, F., Bonafe, U., and Georgiadis, T.: A chemiluminescent ozone analyser for strato-spheric measurements of the ozone concentration (FOZAN), J. Atmos. Ocean Technol., 16, 1345–1350, 1999.
Z¨oger, M., Schiller, C., and Eicke, N.: Fast in-situ hygrometers: a new family of balloon-borne and airborne Lyman-α photofrag-ment fluorescence hygrometers, J. Geophys, Res., 104, 1807– 1816, 1999.