HAL Id: insu-01633514
https://hal-insu.archives-ouvertes.fr/insu-01633514
Submitted on 13 Nov 2017
HAL is a multi-disciplinary open access
archive for the deposit and dissemination of
sci-entific research documents, whether they are
pub-lished or not. The documents may come from
teaching and research institutions in France or
abroad, or from public or private research centers.
L’archive ouverte pluridisciplinaire HAL, est
destinée au dépôt et à la diffusion de documents
scientifiques de niveau recherche, publiés ou non,
émanant des établissements d’enseignement et de
recherche français ou étrangers, des laboratoires
publics ou privés.
Match observations in the Arctic winter 1996/97: High
stratospheric ozone loss rates correlate with low
temperatures deep inside the polar vortex
A. Schulz, M. Rex, J. Steger, N. R. P. Harris, G. Braathen, E. Reimer, R.
Alfier, A. Beck, M. Alpers, J. Cisneros, et al.
To cite this version:
A. Schulz, M. Rex, J. Steger, N. R. P. Harris, G. Braathen, et al.. Match observations in the Arctic
winter 1996/97: High stratospheric ozone loss rates correlate with low temperatures deep inside the
polar vortex. Geophysical Research Letters, American Geophysical Union, 2000, 27 (2), pp.205-208.
�10.1029/1999GL010811�. �insu-01633514�
GEOPHYSICAL RESEARCH LETTERS, VOL. 27, NO. 2, PAGES 205-208, JANUARY 15, 2000
Match observations in the Arctic winter 1996/97' High
stratospheric ozone loss rates correlate with low
temperatures
deep inside the polar vortex
A. Schulz,
1 M. Rex,
1 J. Steger,
1 N.R.P. Harris,
2 G.O. Braathen,
a E. Reimer
4
R. Alfier,
4 A. Beck,
4 M. Alpers,
• J. Cisneros,
• H. Claude,
• H. De Backer,
s
H. Dier,
ø V. Dorokhov,
1ø H. Fast,
11 S. Godin,
12 G. Hansen,
1• H. Kanzawa,
TM
B. Kois,
1• Y. Kondo,
• E. Kosmidis,
17 E. KyrS,
•s Z. Litynska,
1•
M.J. Molyneux,
1ø G. Murphy,
2ø H. Nakane,
TM
C. Parrondo,
2• F. Ravegnani,
22
C. Varotsos
2• C. Vialle,
12 P. Viatte 24 V. Yushkov,
1ø C Zerefos
17
P. von der Gathen I
Abstract. With the Match technique, which is based on the coordinated release of ozonesondes, chemical ozone loss rates in the Arctic stratospheric vortex in early 1997 have been quantified in a vertical region be-
tween 400 K and 550 K. Ozone destruction was ob-
served from mid February to mid March in most of these levels, with maximum loss rates between 25 and
45 ppbv/day. The vortex averaged loss rates and the
accumulated vertically integrated ozone loss have been smaller than in the previous two winters, indicating that the record low ozone columns observed in spring 1997 were partly caused by dynamical effects. The observed ozone loss is inhomogeneous through the vortex with the highest loss rates located in the vortex centre, coin- ciding with the lowest temperatures. Here the loss rates
per sunlit hour reached 6 ppbv/h, while the correspond- ing vortex averaged rates did not exceed 3.9 ppbv/h.
•AWI, Potsdam, Germany 2EORCU, Cambridge, UK aNILU, Kjeller, Norway
4Meteorological Institute, FU Berlin, Germany 5iAP, Kfihlungsborn, Germany
6Instituto Nacional de Meteorologia, Madrid, Spain
7Deutscher Wetterdienst, Hohenpeit]enberg, Germany
8Royal Meteorological Institute, Brussels, Belgium øMeteorologisches Observatorium Lindenberg, Germany •øCentral Aerological Observatory, Dolgoprudny, Russia • Atmospheric Environment Service, Downsview, Canada •2IPSL, Verrieres le Buisson Cedex, France
•aNILU, Tromsoe, Norway •4NIES, Tsukuba, Japan •sIMWM, Legionowo, Poland •6Nagoya University, Japan
•7 University of Thessaloniki, Greece
•8Sodankyl& Meteorological Observatory, Finland •øThe Met. Otfice-(OLA)3b, Berkshire, UK 2øIrish Meteorological Service, Cahirciveen, Ireland 2• Instituto Nacional de T6cnica Aerospacial, Madrid, Spain 22 C.N.R. Fisbat Institute, Bologna, Italy
2aUniversity of Athens, Dept. of Applied Physics, Greece 24SMI, Payerne, Switzerland
Copyright 2000 by the American Geophysical Union.
Paper number 1999GL010811. 0094-8276/00/1999GL010811 $05.00
Introduction
In the 1996/97 winter very low ozone columns were observed above the Arctic [Newman et al., 1997]. These were partly caused by dynamical effects [Lef•vre et al., 1998]. The winter was characterized by a strong, sym-
metric polar vortex that developed unusually late in winter and remained stable until the beginning of May. Through January the vortex was inside the polar night. Temperatures dropped in the beginning of February and stayed below PSC coexistence temperatures until the
end of March at 50 hPa [Naujokat
et al., 1999]. Here we
use the Match technique Iron der Gathen et al., 1995; Rex et al., 1997; 1998; 1999] to quantify the chemical
ozone inside the vortex in early 1997.
Measurement strategy and Analysis
A coordinated Match campaign as described in Rex etal. [1999]
was carried
out between
January
7 and April
11, 1997, both inside and outside the polar vortex. Dur-
ing this time forward trajectories were calculated from
European Centre for Medium-Range Weather Forecasts
(ECMWF) analyses and forecasts, using locations of
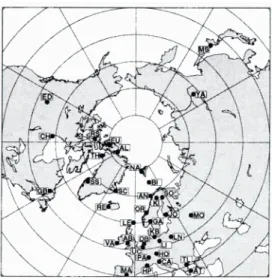
ozonesonde measurements as starting points, in order to track the probed air parcels. In cases when a parcel was predicted to pass over one of the 36 ozone sound-
ing stations participating in the campaign (Fig. 1), a
launch request was made. A total of 746 sondes was successfully launched from these stations.
For the post campaign analysis a second set of tra- jectories was calculated from analysed ECMWF data,
using cooling rates from the SLIMCAT model [Chip- perfield et al., 1999]. The criteria for accepting a match were chosen as in winter 1994/95, with the exception of the matchradius that was reduced to 400 km (250 km) to
improve the statistical error between 450 K and 500 K by about 5 %. A match was assigned to the vortex when
the mean normalized potential Vorticity (PV) along the
trajectory
was
higher
than 36 s -•. Normalized
PV is de-
fined as scaled PV [Dunkerton et al., 1986] multiplied by a constant factor of 2.65.105 so that it has the same
numerical values as Ertel's PV on the 475 K isentropic
surface. In the final analysis the data of 285 sondes is used. The chosen matches sampled the vortex ho-
mogeneously in terms of PV values most of the time.
Calculated loss rates can thus be interpreted as vortex
206 SCHULZ ET AL- ARCTIC OZONE LOSS IN 1996/97 BY MATCH OBSERVATIONS
Figure 1. Map of all participating ozonesonde stations
in the 1996/97 Match campaign.
averages, with some caveats discussed below. Ozone
loss rates per sunlit hour were determined by calculat-
ing linear regressions of the change of the ozone mixing
ratio versus sunlit time. For these regressions matches
of a 14 day period and a 20 K vertical region were used.
Finally these rates were multiplied with the mean sun- lit time per day inside the vortex to obtain loss rates per day. The given error bars are I a uncertainties of the regression coefficients and do not include possible systematic effects, such as possible systematic errors in the used cooling rates.
Results and discussion
Fig. 2 shows the ozone loss per day as a function of time and potential temperature. Results are obtained between the end of January and the end of March, cov- ering potential temperature levels between 400 K and 520 K to 550 K. Above 425 K the depletion started in early February and continued into March. Maximum
loss rates between 25 and 45ppbv/day were reached.
This period coincides with the findings of Goutail et al.
[1998] who report the highest chemical loss in column
ozone between February I and March 10. The inte- grated ozone loss during the period and vertical region shown in Fig. 2 is 43+9 DU. Since the results cover most of the time and vertical region where extensive PSC
conditions (see below) existed it is likely that the inte-
grated loss reflects a large fraction of the total accumu-
lated column loss in 1996/97. This is compatible with the results of Miiller et al. [1997], who calculated 50- 70 DU for the 1996/97 column ozone loss. The derived
value is much smaller
than column
losses
in 1994/95
and 1995/96 with 120-160DU
[Rex et al., 1999; Goutail
et al., 1999; Milllet et al., 1997], supporting the model
based
finding
of Lef•vre et al., [1998]
that the extreme
low ozone
columns
measured
in 1997 [Newman
et al.,
1997] were partly caused by dynamical effects.
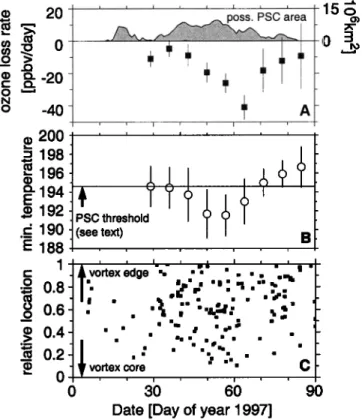
Fig. 3A shows the temporal evolution of the ozone
loss rate at 475 + 10 K. The shaded curve represents the area of the northern hemisphere where temper-
atures (derived from ECMWF analyses) might allow
PSC existence, assuming a constant H20 mixing ratio of 4.6 ppmv and the LIMS January 1979 HNO3 profile and following the analysis of NAT formation by Hanson
et al. [1988]. While there were not enough soundings to
obtain results for the first cold period in January, the loss rates start increasing some days after the begin- ning of February, shortly after temperatures drop below the PSC threshold in substantial parts of the northern hemisphere. The ozone loss rates increase further un- til the first third of March, when they drop consider- ably, although temperatures inside the vortex still al- low the existence of PSCs. Fig. 3B shows the average of the minimum temperatures in a 10 day history for the air parcels involved in the corresponding data points in
panel A. For each air parcel the minimum temperature
is the lowest temperature on the trajectory that links the matching pair of sondes or on a 10 day backward trajectory starting from the first sounding. A clear re-
lation can be seen between the loss rates and the min-
imum temperatures in the air parcel histories. To our knowledge this is the most direct observation.. of the de- pendence of ozone loss on low temperatures so far.
Comparing this temperature analysis to the shaded curve in panel A suggests that the smaller ozone loss rates in the second half of March are determined by a sample of matches that does not reflect the mean vortex conditions. Further, during that period Fig. 3C shows only few matches in the vortex core, which is where
any PSCs would be expected (Fig. 4, bottom panel).
An underestimation of the vortex averaged loss rates in the second half of March is therefore possible.
Fig. 4 shows the mean ozone loss per sunlit hour be- tweon February 10 and March 10, averaged from 450 K
to 500 K with respect to the relative location inside
e 600
55o500
F-
450
4oo o 40 0 i ! -40 -80[ppbv/day]
' t
•
I
•
•
...
Fm?. ?
0
30
6o
90
Date [day of the year 1997]
Figure 2. Ozone loss rates per day as a function oftime and potential temperature. The fine lines indicate
the 0.3, 0.7, 1.5, 4.0 and 8.0- 106 km 2 isolines for the
area of possible PSC type I existence, the bold line is the
0.3.106 km • isoline for the area of possible PSC type
II existence as derived from ECMWF analysis. The
dashed lines describe the diabatic descent (vortex aver-
age) of the air masses during the winter as determined by the SLIMCAT model.
SCHULZ ET AL.: ARCTIC OZONE LOSS IN 1996/97 BY MATCH OBSERVATIONS 207 20 0 -20 -40 200 198 196 194 192 190 188 1 0.8 0.6 0.4 0.2 0 poss. PSC area
,,,,
+
I ' ' PSC threshold (see text) , , , , ,' ' i . , .• ., , ,
ortexedge '. .. . .. •ln . ß Iddll-
.
ß• " •,•' ß
.
ß ß ß ß '. ß ß .. •, ß ß ß ß n• ß ß n
ßnn
' n
n
=P
N
ß ß
ß ß vortex core ; ' ß ß C0
' 3b ' ' 6b '
90
Date [Day of year 1997]
Figure 3. Panel
'A: ozone
depletion
rates
per day at
475 + 10 K with Ier error bars as a function of time.Each data point represents a linear regression between ozone change and sunlit time of matches in a 14 day period around the given date. The shaded curve is the area at 475 K with temperatures allowing PSC existence
(see text). Panel B: minimum temperatures along a 10
day backward trajectory and the trajectory between the two soundings for the corresponding matches. Panel C: relative position of the individual match events inside the polar vortex. The scale is chosen in a way that 0
refers to the vortex center (highest PV value) while 1
represents the vortex edge. On a given day equal inter- vals on the scale correspond to equal area fractions of the vortex, while decreasing numbers represent increas- ing PV.
the vortex. The depletion rates vary from low val-
ues at the vortex edge to about 6 ppbv/h at the vor-
tex core. This is in qualitative agreement with the re-
sults of Miiller et al., [1997] who report larger observed
ozone losses towards the vortex interior. During the same period the vortex averaged loss rate did not exceed
3.9 + 0.8 ppbv/h. This is considerably lower than maxi-
mum vortex averaged loss rates per sunlit hour observed
in previous years, that are 10 + lppbv/h in 1991/92 and 1994/95 and 10 + 3 ppbv/h in 1995/96 [Rex et al., 1997; 1998; 1999]. Corresponding to the inhomogeneous
ozone loss, the minimum temperatures experienced by
the air parcels in a 10 day history (Fig. 4, open circles)
are more than 5 K higher at the vortex edge than in the vortex centre. The largest areas with temperatures
below the PSC threshold are situated towards the vor-
tex centre between the first third of February and mid
March (Fig. 4, bottom panel). Thus only a part of the
vortex was affected by major ozone depletion, which
kept the overall ozone loss low.
Manney et al. [1997]
give calculated
ozone
loss
based
on MLS data for the end of February 1997. For the
465 K potential temperature level they calculate a loss
rate of 1.3 %/day between
Feb 20 and Feb 26. For a
comparable
height and time region (465 + 10K and
Feb 16 to Mar 2) we determine
a lower loss rate of
25 + 6 ppbv/day,
which
corresponds
to 0.9 + 0.2 %/day
assuming
an initial mixing ratio of 2.7ppmv. However,
the results
agree within 2c, and differences
may also
be introduced by the different periods used for the two analyses, so the results are not contradictory.
Knudsen et al. [1998] calculated vortex averaged ozone depletion for different isentropic levels using ozonesonde
data. The integrated
ozone loss in 450K (475K) is
1.1 ppmv (1.2 ppmv) compared
to 0.9 + 0.2 ppmv(0.9
+
0.2 ppmv) as determined
in this work. The slight
differ-
ence between these results can be assigned to the appli-
cation of different cooling rates, since values determined
by them decrease
to 0.9 ppmv (1.0 ppmv) when
they use
, , ... 199 _•. - 198 .:3 196 • 194 e=
2
--
192 ,--,-
190 (o 0 0.2 0.4 0.6 0.8 1vortex core relative location vortex edge Figure 4. Top Panel: ozone loss rates per sunlit hour
as a function of relative location (see Fig. 3) inside the
vortex. The squares symbolize linear regressions of
matches between Feb 10 and March 10 and between 450 K and 500 K. The horizontal bars indicate the lim-
its for the contributing matches. The open circles repre- sent the corresponding minimum temperatures in a 10
day history (as in Fig. 3B). Bottom panel: derived from
ECMWF analysis, the greyscale indicates the percent- age of area with temperatures allowing PSC existence
(see text) in the 475K level as a function of relative
208 SCHULZ ET AL.: ARCTIC OZONE LOSS IN 1996/97 BY MATCH OBSERVATIONS
the same cooling rates as in this study (B. M. Knudsen, private communication). The cooling rates calculated by Knudsen et al. [1998] use observed ozone profiles that are mapped into a PV/theta space and are up to 80 % higher than the rates used in this study, which
are based on climatological ozone profiles and apply a
global flux correction [Chipperfield et al., 1999]. This
leads to the conclusion that, depending on which of the cooling rates are more precise, the ozone loss reported in this study might be underestimated by 1 er.
Conclusion
Significant ozone loss in the Arctic stratosphere was observed between mid February and mid March 1997, but the vortex averaged ozone loss rates determined in
1996/97 are lower than in 1992, 1995 and 1996. This
supports the picture that the extreme low ozone val- ues observed in 1997 can be attributed at least partly to dynamical effects. The ozone loss was mainly con- centrated in the vortex core, coinciding with the lowest
temperatures. A direct correlation between the deter-
mined ozone loss and the temperature history of the air
parcels was observed.
Acknowledgments. We are grateful to the operating staff of all participating stations for having made this cam- paign possible. We thank M. Chipperfield, Univ. of Cam- bridge, for calculating the diabatic heating rates, M. Al- Iaart, KNMI, De Bilt, I.S. Mikkelsen, DMI Copenhagen, F. O'Connor, Univ. of Wales, and the Icelandic Met. Of- fice for cooperation and for providing ozonesonde data, H. Deckelmann, AWI Potsdam, for computer work, as well as the the European Centre for Medium-Range Weather Fore-
cast (ECMWF) and the German Weather Office (DWD)
for providing meteorological data. This work was sup- ported by the Environment and Climate Programme of the Directorate General for Science and Technology (DG-XII) of the European Commission (contract no. ENV4-CT95-
0145), the Bundesministerium ffir Bildung, Wissenschaft, Forschung und Technologie (BMBF) of Germany (contract no. 01 LO9508/6) and by all the countries of the participat- ing personnel. AWI contribution number: 1549.
References
Chipperfield, M.P., Multiannual simulations with a three- dimensional chemical transport model, J. Geophys. Res.,
10•, 1781-1805, 1999.
Dunkerton, T. J., et al., Evolution of potential vorticity in the winter stratosphere of January-February 1979, J. Geo- phys. Res., 91, 1199-1208, 1986.
Goutaft, F., et al., Total ozone reduction in the Arctic vortex
during the winters of 1995-96 and 1996-97, Proceedings of the fourth European Workshop on Polar Stratospheric
Ozone, Schliersee, Germany, 22-26 September 1997, 277- 280, 1998.
Goutail, F., et al., Depletion of Column Ozone in the Arc-
tic during the Winters of 1993-94 and 1994-95, J. Arm.
Chem., ϥ, 1-34, 1999.
Hanson, D. R., et al., Laboratory studies of the nitric acid trihydrate: Implications for the south polar stratosphere, Geophys. Res. Lett., 15, 855-858, 1988.
Knudsen, B.M., et al., Ozone depletion in and below the Arctic vortex for 1997, Geophys. Res. Lett., 25, 627-630,
1998.
Lef'evre, F., et al., The 1997 Arctic ozone depletion quanti-
fied from three-dimensional model simulations, Geophys. Res. Lett., 25, 2425-2428, 1998.
Manney, G. L., et al., MLS observations of Arctic ozone loss
in 1996-97, Geophys. Res. Lett., 24, 2697-2700, 1997.
Mfiller, R., et al., HALOE observations of the vertical struc-
ture of chemical ozone depletion in the Arctic vortex dur-
ing winter and early spring 1996-97, Geophys. Res. Lett.,
2J, 2717-2720, 1997.
Naujokat, B., et al., The stratospheric winter 1996/97: ex-
tending later into spring than ever before, Bellage zur
Berliner Wetterkarte, in press.
Newman, P. A., et al., Anomalously low ozone over the Arc- tic, Geophys. Res. Lett., 24, 2689-2692, 1997.
Rex, M., et al., Chemical ozone loss in the Arctic winter
1994/95 as determined by the Match technique, J. Arm. Chem., 2•, 35-59, 1999.
Rex, M., et al., In situ measurements of stratospheric ozone
depletion rates in the Arctic winter 1991/1992: A La-
grangian approach, J. Geophys. Res., 103, 5843-5853,
1998.
Rex, M., et al., Prolonged stratospheric ozone loss in the
1995-96 Arctic winter, Nature, 389, 835-838, 1997.
von der Gathen, P., et al., Observational evidence for chem-
ical ozone depletion over the Arctic in winter 1991-92, Nature, 375, 131-134, 1995.
R. Alfier, A. Beck, E. Reimer, Met. Institute, FU Berlin, C.-H.-Becker Weg 6-10, D- 12165 Berlin, Germany.
M. Alpers, IAP, Schlofistr. 6, Kiihlungsborn, Germany. G.O. Braathen, NILU, P.O. Box 100, Kjeller, Norway.
J. Cisneros, INM, Apdo. 285, 28071 Madrid, Spain.
H. Claude, DWD, Observatory Hohenpeifienberg, Albin- Schwaiger-Weg 10, 82383 Hohenpeifienberg, Germany.
H. De Backer, RMI, Ringlaan 3, Brussels, Belgium. H. Diet, MOL, 15864 Lindenberg, Germany.
V. Dorokhov, V. Yushkov, CAO, Pervomajskaya Street 3, Dolgoprudny, Moscow Region, 141700, Russia.
H. Fast, Atmospheric Environment Service, 4905 Dufferin
Street, Downsview, ON, M3H 5T4, Canada.
S. Godin, C. Vialle, IPSL/ Service d'Observation, BP 3, 91371 Verrieres le Buisson Cedex, France.
G. Hansen, NILU, Polarmiljoesenteret, Hjalmar Johansens Gate 14, N-9001 Tromsoe, Norway.
N.R.P. Harris, EORCU, 14 Union Road, Cambridge, UK. H. Kanzawa, H. Nakane, NIES, 16-2, Onogawa, Tsukuba,
Ibaraki 305-0053, Japan
B. Kois, Z. Litynska, IMWM, Centre of Aerology, Zegrzynska Str.38, 05-119 Legionowo, Poland.
Y. Kondo, Solar-Terrestrial Environment Lab., Nagoya Univ., 3-13 Honohara, Toyokawa, Aichi, 442-8507 Japan.
E. Kosmidis, C. Zerefos, Lab. of Atmospheric Physics, Univ. of Thessaloniki, 45006 Thessaloniki, Greece.
E. KyrS, SMO, Tiihteliintie 71, Sodankylii, Finland. M.J. Molyneux, The Met. Office-(OLA)3b, Beaufort Park, Wokingham, Berkshire, RG40 3DN, UK.
G. Murphy, IMS, Valentia Observatory, Cahirciveen, Co.
Kerry, Ireland.
C. Parrondo, INTA, Torrejon de Argoz, Madrid, Spain. F. Ravegnani, C.N.R. Fisbat Institute, Via Gobetti 101,
Bologna, Italy.
M. Rex, A. Schulz, J. Steger, P. von der Gathen, Alfred Wegener Institute for Polar and Marine Research, P.O. Box 600149, 14401 Potsdam, Germany.
(e-mail: aschulz@awi_potsdam. de)
(2. Varotsos, Univ. of Athens, Dept. of Appl. Physics,
Panepistimioupolis Build. PHYS-V, 157 84, Athens, Greece. P. Viatte, SMI, Les Invuardes, 1530 Payerne, Switzerland
(Received May 17, 1999; revised September 2, 1999;