HAL Id: hal-00328356
https://hal.archives-ouvertes.fr/hal-00328356
Submitted on 13 Nov 2003
HAL is a multi-disciplinary open access
archive for the deposit and dissemination of
sci-entific research documents, whether they are
pub-lished or not. The documents may come from
teaching and research institutions in France or
abroad, or from public or private research centers.
L’archive ouverte pluridisciplinaire HAL, est
destinée au dépôt et à la diffusion de documents
scientifiques de niveau recherche, publiés ou non,
émanant des établissements d’enseignement et de
recherche français ou étrangers, des laboratoires
publics ou privés.
Stratospheric water vapour as tracer for Vortex
filamentation in the Arctic winter 2002/2003
M. Müller, R. Neuber, F. Fierli, Alain Hauchecorne, H. Vömel, S. J. Oltmans
To cite this version:
M. Müller, R. Neuber, F. Fierli, Alain Hauchecorne, H. Vömel, et al.. Stratospheric water vapour as
tracer for Vortex filamentation in the Arctic winter 2002/2003. Atmospheric Chemistry and Physics,
European Geosciences Union, 2003, 3 (6), pp.1991-1997. �10.5194/acp-3-1991-2003�. �hal-00328356�
www.atmos-chem-phys.org/acp/3/1991/
Chemistry
and Physics
Stratospheric water vapour as tracer for Vortex filamentation in the
Arctic winter 2002/2003
M. M ¨uller1, R. Neuber1, F. Fierli2, A. Hauchecorne3, H. V¨omel4, and S. J. Oltmans5
1Alfred Wegener Institute for Polar and Marine Research, Potsdam, Germany 2Istituto di Scienze dell’Atmosfera e del Clima, CNR, Rome, Italy
3Service D’A´eronomie du CNRS, Verri`eres-le-Buisson, France
4Cooperative Institute for Research in Environmental Sciences, University of Colorado, Boulder, Colorado, USA 5Climate Monitoring and Diagnostics Laboratory, NOAA, Boulder, Colorado, USA
Received: 9 July 2003 – Published in Atmos. Chem. Phys. Discuss.: 5 August 2003 Revised: 10 October 2003 – Accepted: 5 November 2003 – Published: 13 November 2003
Abstract. Balloon-borne frost point hygrometers measured
three high-resolution profiles of stratospheric water vapour above Ny- ˚Alesund, Spitsbergen during winter 2002/2003. The profiles obtained on 12 December 2002 and on 17 Jan-uary 2003 provide an insight into the vertical distribution of water vapour in the core of the polar vortex. The water vapour sounding on 11 February 2003 was obtained within the vortex edge region of the lower stratosphere. Here, a sig-nificant reduction of water vapour mixing ratio was observed between 16 and 19 km. The stratospheric temperatures indi-cate that this dehydration was not caused by the presence of polar stratospheric clouds or earlier PSC particle sedimenta-tion.
Ozone observations on this day indicate a large scale movement of the polar vortex and show laminae in the same altitude range as the water vapour profile. The link between the observed water vapour reduction and filaments in the vortex edge region is indicated in the results of the semi-lagrangian advection model MIMOSA, which show that ad-jacent filaments of polar and mid latitude air can be identified above the Spitsbergen region. A vertical cross-section pro-duced by the MIMOSA model reveals that the water vapour sonde flew through polar air in the lowest part of the strato-sphere below 425 K, then passed through filaments of mid latitude air with lower water vapour concentrations, before it finally entered the polar vortex above 450 K. These results indicate that on 11 February 2003 the frost point hygrom-eter measured different water vapour concentrations as the sonde detected air with different origins. Instead of being linked to dehydration due to PSC particle sedimentation, the local reduction in the stratospheric water vapour profile was in this case caused by dynamical processes in the polar strato-sphere.
Correspondence to: M. M¨uller
1 Introduction
The important role of stratospheric water vapour in the cli-mate system has become evident during the recent years. Radiatively, it is the most important greenhouse gas (Har-ries, 1996) and the observed increase of stratospheric water vapour (SPARC, 2000) contributes to increased stratospheric cooling (Rind and Lonergan, 1995; Forster and Shine, 1999; Oinas et al., 2001). The increase of stratospheric water vapour is also expected to enhance the occurrence of polar stratospheric clouds (PSCs) (Hofmann and Oltmans, 1992), thus contributing to heterogeneous reactions that initiate the catalytic loss of stratospheric ozone. Overall, the distribu-tion of stratospheric water vapour is determined by the inter-action of radiation, chemistry, and dynamics. Water vapour enters the stratosphere through vertical transport in the trop-ical tropopause region (Brewer, 1949) and is photochemi-cally produced in the upper stratosphere through the oxida-tion of methane (Abbas et al., 1996; Michelsen et al., 2000). The only sink of water vapour in the upper atmosphere is through photolysis by Lyman-α, with its efficiency increas-ing with altitude in the mesosphere. A minor loss process in the stratosphere is due to gravitational sedimentation of ice particles from PSCs type II inside the polar vortex. This process leading to dehydration and rehydration is linked to very cold stratospheric temperatures and is observed regu-larly in the Antarctic and to a lesser extent in the Arctic (V¨omel et al., 1995, 1997; Hintsa et al., 1998; Nedoluha et al., 2002; Schiller et al., 2002). Without dehydration, the water vapour concentration inside the polar vortex is gener-ally higher than in the surrounding mid-latitudes due to the descent of air from higher altitudes where water vapour is produced by methane oxidation (Ovarlez and Ovarlez, 1994; Aellig et al., 1996; Schiller et al., 1996). In the lower strato-sphere, the photochemical lifetime of water vapour is on the order of years (Brasseur and Solomon, 1984), which in the
1992 M. M¨uller et al.: Stratospheric water vapour as tracer for vortex filamentation
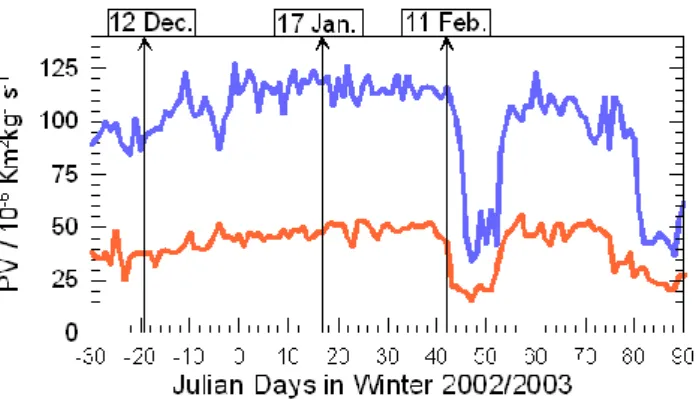
Fig. 1. Potential vorticity (PV) at 475 K (red) and 550 K (blue)
above Ny- ˚Alesund during winter 2002/2003. The PV data are taken from ECMWF. Julian Day=0 marks 31 December 2002.
absence of condensation and freezing allows the use of wa-ter vapour as long lived tracer to study stratospheric transport processes.
Our observations indicate the large scale descent of water vapour inside the polar vortex, as well as small-scale struc-tures of reduced water vapour. Although the cold temper-atures allowed freezing and dehydration above Scandinavia in early winter 2002/2003, the observed structure of reduced water vapour was found to be caused dynamically. Layer-ing of water vapour profiles through dynamical processes has been observed before in the sub-tropics (Kley et al., 1980) as well as in the polar regions (Ovarlez and Ovarlez, 1994). Here we focus on tracer filamentation at the vortex edge and use the observed water vapour structures to validate the semi-lagrangian advection model MIMOSA (Hauchecorne et al., 2002). It has previously been shown that vortex fil-amentation appears as lamination in tracer profiles as verti-cally tilted filament sheets pass over a measurement location (Reid and Vaughan, 1991; Orsolini, 1995). These filaments are produced by planetary wave breaking at the vortex edge where tracer isopleths are stretched and thinned due to dif-ferential advection. With time, the size of a tracer filament is reduced from synoptic scale to mesoscale and finally mi-croscale where molecular diffusion becomes important (e.g. Flentje et al., 2003). Several authors (e.g. Waugh et al., 1994; Manney et al., 1998; Flentje et al., 2000) have shown that tracer transport models reproduce realistic filamentary struc-tures in the lower stratosphere. Comparisons with airborne lidar data (Flentje et al., 2000; Heese et al., 2001) and sensi-tivity studies (Hauchecorne et al., 2002) have shown that the uncertainty of filament positions are on the order of >100 km for mid-latitudes.
2 Observations
In winter 2002/2003, three high resolution water vapour pro-files were obtained by balloon-borne frost point
hygrome-ters launched from Ny- ˚Alesund, Spitsbergen (79◦N, 12◦E).
The instruments are built at NOAA/CMDL, and a detailed description is found in V¨omel et al. (1995). The hygrome-ter launches were conducted on 12 December 2002, as well as on 17 January and 11 February 2003. According to the changing meteorological situation in the stratosphere, the sondes detected different states of the polar vortex.
2.1 The Arctic Polar Vortex in Winter 2002/2003
During the Arctic winter 2002/2003 the stratospheric polar vortex had developed very early. In mid November 2002 the cold pool temperatures were already low enough to allow the formation of polar stratospheric clouds. For the most part, the vortex was centred above Spitsbergen. A minor warming at the end of December only propagated down to the 10 hPa level (approximately 30 km) and did not influence the lower part of the vortex. In mid January 2003, a major stratospheric warming disturbed the entire vortex with high temperatures moving from the Aleutian Islands towards the pole, creating an elongation of the vortex. Despite this dynamical activ-ity, the core of the elongated vortex was still centred above Spitsbergen during the water vapour measurement on 17 Jan-uary; however, the vortex split into two centres during the following days. At the beginning of February 2003, the vor-tex stabilized again and was centred above Spitsbergen, mov-ing eastward with ongomov-ing disturbances. On 11 February, the vortex appeared in a wave-3 shape centred above the Siberian Arctic with one edge above Spitsbergen. During the follow-ing days, the vortex elongated further and split again. Mi-nor warming events in mid-February and at the beginning of March kept the vortex dynamically active until the final warming at the end of March. The position of the polar vor-tex relative to Ny- ˚Alesund is shown by the time evolution of potential vorticity (PV) in Fig. 1, which also marks the dates of the water vapour soundings. The slow increase of PV during December implies that the first sounding detected a stable and intensifying inner vortex, while the sonde on 17 January 2003 was launched in the vortex core indicated by the very high PV values. The large and rapid decrease of PV around 11 February 2003 was caused by a large scale move-ment of the polar vortex away from the station. Obviously, the vortex edge is tilted, as it passes across Ny- ˚Alesund first on the 475 K level and with a lag of approximately 2 days on the 550 K level. From 22 February 2003 until its break-up in the end of March the vortex core is again situated above Spitsbergen.
2.2 Water Vapour Profiles
The water vapour soundings on 12 December 2002 and 17 January 2003 were obtained in the centre of the polar vor-tex and show very similar profiles. The 17 January profile (Fig. 2) is chosen here to represent the vortex core. In the lowermost stratosphere from the tropopause up to 15 km, the
Fig. 2. Balloon-borne frost point hygrometer measurement on 17
January 2003, 15:00 UTC, at Ny- ˚Alesund with water vapour mixing ratio in ppmv (left) and both temperature (grey line) and frost point (dotted).
water vapour mixing ratio has rather stable values at about 4 ppmv. Above 15 km water vapour is constantly increasing, reaching about 7 ppmv at 24 km and thus exceeding by far the 5 ppmv commonly assumed for the calculation of PSC existence temperatures (e.g. Carslaw et al., 1998).
The observed high water vapour mixing ratio in the up-permost part of the profile is most certainly related to the stratospheric warming events whose effects can be seen in the upper part of the temperature profile in Fig. 1. As sudden stratospheric warming events are always connected with en-hanced downward transport inside the vortex, the 2002/2003 polar vortex seems to be more intensely rehydrated from above than in years without stratospheric warming events. In winter 2002/2003, the water vapour mixing ratio reaches 7 ppmv above 24 km, which is somewhat higher than the 6 ppmv measured in the cold and stable polar vortex of win-ter 1995/1996 (V¨omel et al., 1997).
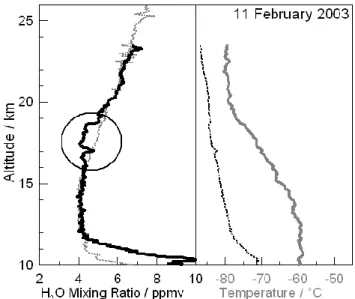
The profile on 12 December 2002 obtained deep inside the polar vortex (not shown) is very similar to the profile on 17 January 2003 (Fig. 2), while the third profile on 11 February 2003 shows some significant differences (Fig. 3). Water vapour is approximately constant at 4 ppmv between the tropopause to about 15 km and increasing with altitude above 20 km. However, between 16 and 19 km, significantly less water vapour is found in the 11 February 2003 profile. Within this bite-out compared to the background profiles, a distinct peak is found near 17 km, which reaches background values. The cause for these features in the 11 February 2003 water vapour profile is addressed below.
Fig. 3. Balloon-borne frost point hygrometer measurement on 11
February 2003, 07:00 UTC, at Ny- ˚Alesund with water vapour mix-ing ratio in ppmv (left, black line) and temperature (grey line) and frost point (dotted). For better comparison, the water vapour mix-ing ratio of 17 January is also shown (left, grey dotted line) together with a circle that marks the most distinct features.
3 Discussion of Dynamical Aspects
A dramatic water vapour reduction within distinct layers has previously been observed in Arctic water vapour profiles and was linked to the sedimentation of ice PSC particles (V¨omel et al., 1997). However, on 11 February 2003 the local tem-perature (Fig. 3) as well as the temtem-perature along the back trajectories (not shown) was not low enough for the forma-tion of PSCs. Therefore, dehydraforma-tion is unlikely to have oc-curred just before. Due to the stratospheric warming events and consequent mixing within the polar vortex, a possible footprint of prior dehydration by PSC type II occurrence ear-lier in the winter may be excluded. Thus, the reduction of water vapour on 11 February 2003 is most likely not caused by ice formation. A more likely explanation could be strato-spheric dynamics.
A first indication is given by the temperature profile in Fig. 3. Above 19 km, the hygrometer detected the cold pool inside the polar vortex. Below 19 km a rapid temperature in-crease towards the tropopause suggests the detection of air outside the polar vortex, implying that the reduction of water vapour between 16 and 19 km could be related to the lower water vapour mixing ratios found in mid latitude air. This hypothesis is supported by ozone measurements, trajectory calculations and the results of the semi-lagrangian advection MIMOSA model, which are presented below.
1994 M. M¨uller et al.: Stratospheric water vapour as tracer for vortex filamentation
Fig. 4. Ny- ˚Alesund ozone profiles retrieved on 11 February 2003 by lidar (blue and red lines) and balloon-borne ozone sonde (black dotted line).
3.1 Stratospheric Ozone Profiles
The assumption of a dynamical cause of the water vapour feature is backed by the Ny- ˚Alesund ozone observations. Figure 4 shows the ozone profiles measured by lidar and ozone sonde on 11 February 2003. During the morning hours, the lidar ozone profile represents typical polar vor-tex profiles throughout the lower stratosphere. However, the evening lidar profile shows a completely different situation as it differs significantly compared to the vortex profile. Be-tween the tropopause region and approximately 19 km, the ozone partial pressure is reduced by up to 50%. This large reduction in a very short time period is clearly not caused chemically, but could be explained by the movement of the polar vortex. During the morning observations, Ny- ˚Alesund was situated inside the polar vortex. As the vortex moved north-eastward during the day, only the upper part of the vor-tex above 19 km was still covering the site. Below 19 km, the vortex had moved such that the lidar measurements at Ny- ˚Alesund detected air from outside the polar vortex. This large scale vortex movement, found in ECMWF analyses (compare Fig. 1) as well as in the MIMOSA model, is re-flected in the lidar ozone profiles, and may have caused the water vapour reduction between 16 and 19 km. The ozone sonde measurement at 11:00 UTC reveals strong lamination between 15 and 20 km (Fig. 4). These ozone layers are more distinct in the sonde profile compared to the lidar profiles due to the different temporal resolution of these observations. The similarity in structure between ozone and water vapour profile (Figs. 3 and 4) indicate the same dynamical cause.
Fig. 5. Geographical distribution of modified potential vorticity
(MPV) on 11 February 2003, at 06:00 UTC, simulated by MI-MOSA. Polar vortex air is marked with bright yellow colours, mid-latitudinal air with dark red and blue colours. The white square marks Ny- ˚Alesund, while the black line indicates the location of the cross-section shown in Fig. 6.
3.2 Comparison with MIMOSA model results
The mesoscale distribution of tracers in the stratosphere is commonly simulated using either reverse domain filling or contour advection (Waugh et al., 1994; Sutton et al., 1994; Newman et al., 1996; Manney et al., 1998). Here we present results from the semi-lagrangian advection model MIMOSA (Hauchecorne et al., 2002). The simulations are based on 6-hourly ECMWF wind and temperature data with a 1.125◦×1.125◦horizontal resolution on 28 pressure levels, from which MIMOSA subsequently produces tracer fields with 0.3◦ horizontal resolution on 20 isentropic surfaces. Based on PV as tracer, we use modified potential vortic-ity (MPV) (Lait, 1994) in order to remove the conventional PV’s exponential growth with height for an isothermal at-mosphere. A map of the simulated fine scale distribution of MPV is shown in Fig. 5, displaying the 440 K isentropic level (about 18.2 km) on 11 February 2003, 06:00 UTC. High po-tential vorticity (in bright yellow colours) defines the polar vortex situated north-east of Ny- ˚Alesund. Mid latitude air with lower MPV values (in blue colours) is found south of Spitsbergen. The transition region from polar to mid lati-tude air is characterized by filamentary structures of different
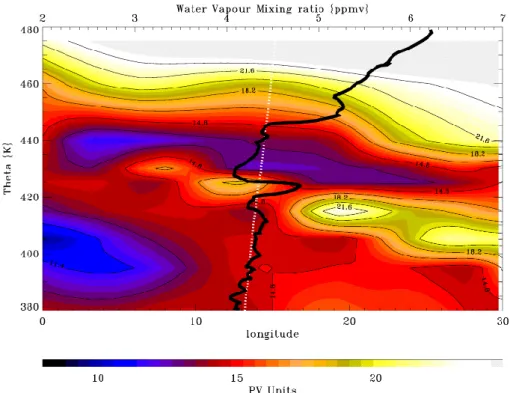
Fig. 6. MIMOSA fine scale structures of modified potential vorticity (colour coded) on 11 February 2003, 06:00 UTC, in a longitudinal
cross-section at 78N revealing filaments of mid-latitudinal air (blue colours). Superimposed is the water vapour mixing ratio (black line, upper axis) and the flight trajectory (white dotted line, lower axis) of the frost point hygrometer launched on 11 February 2003, at 07:00 UTC.
origin. A filament of polar air occurs south of Spitsbergen, separated from the vortex by a tongue of mid-latitudinal air.
Based on the measured ozone sonde balloon trajectory, the hygrometer was likely to follow the same south-east direc-tion from Ny- ˚Alesund parallel to the MPV isolines shown in Fig. 5. Since there is only a time lag of 4 hours between the sonde launches and since both tracer profiles show sim-ilar structures, assuming simsim-ilar balloon trajectories is rea-sonable and furthermore supported by ECMWF trajectory calculations (not shown here). According to Fig. 5, the wa-ter vapour sonde encounwa-tered mid latitude air on the 440 K level. In fact, both the water vapour and ozone profile (Figs. 3 and 4) indicate that around 18.2 km the sondes detected low tracer concentrations as expected from mid latitude air.
Figure 6 shows the simulated MPV field as longitudinal cross-section along 78◦N (indicated in Fig. 5), roughly cor-responding to the balloon trajectory since the balloon drifted south- eastward. Again, bright yellow colours mark po-lar vortex air, while dark red and blue colours indicate the presence of mid-latitudinal filaments. The measured wa-ter vapour profile is superimposed as well as the assumed balloon trajectory from 12◦E to 16◦E. The combination of the simulated tracer (MPV) field with the observed vertical tracer (water vapour) profile in Fig. 6 clearly indicates that the water vapour reduction is indeed caused by dynamical processes.
The MIMOSA results show that on its way through the stratosphere the sonde encountered air of different origins.
Below 420 K, the sonde met a smooth background of po-lar air. Between roughly 420 and 445 K, the longitudinal cross-section reveals adjacent polar and mid latitude fila-ments along the flight path. The well defined water vapour peak around 425 K (17 km) is clearly linked to a narrow fil-ament of polar vortex air. Yet, from about 430 to 445 K the sonde traverses air from the mid-latitudinal tongue described in Fig. 5, where the hygrometer measured lower water vapour mixing ratios. The model results are further backed up by tra-jectory calculations (not shown here) that indicate an origin outside the polar vortex for the air mass with low humidity. Finally, above 450 K the sonde enters the polar vortex, which is clearly shown by the MIMOSA simulation and the water vapour measurement.
The measured H2O mixing ratio and the simulated
small-scale distribution of potential vorticity indeed show a very good agreement. Evidently, MIMOSA is able to reproduce small scale filamentary structures not only with high horizon-tal but also with high vertical resolution, as shown for ozone lidar data by Heese et al. (2001). The combination of water vapour measurements and high resolution PV fields shows that even small scale water vapour structures like the peak at 17 km are well represented by the simulated PV tracer struc-tures. Based on the correlation of water vapour and potential vorticity, the MIMOSA results confirm the purely dynamical cause for the observed reduction in the water vapour profile on 11 February 2003.
1996 M. M¨uller et al.: Stratospheric water vapour as tracer for vortex filamentation
4 Conclusions
In winter 2002/2003, three high resolution vertical profiles of stratospheric water vapour were obtained using balloon-borne frost point hygrometers from Ny- ˚Alesund, Spitsber-gen. On 12 December 2002, and on 17 January 2003, the sondes detected the water vapour distribution well inside the polar vortex.
The profile on 11 February 2003 exhibits a large reduc-tion in water vapour between 16 and 19 km. Lower and more variable ozone concentrations were observed in the same al-titude region by lidar and ECC ozone sonde. The observed changes in the profiles are not related to chemical, but rather to dynamical processes. The ozone lidar profiles taken in the early morning hours of 11 February 2003, indicate that the lidar was measuring inside the polar vortex, while the evening profiles indicate that mid latitude air was detected between 15 and 19 km. The general meteorological situa-tion on this day was characterized by a north-eastward shift of the polar vortex. The ozone and water vapour soundings measured air in the edge region of the vortex, showing the co-existence of thin filaments of different origin. These fil-aments were reproduced by the MIMOSA semi-lagrangian advection model, identifying the mid latitude origin of the water vapour profile laminae. The MIMOSA PV simulations reproduce the filamentary vortex edge with an accuracy of 40 km for the horizontal position, 3 hours for time, and 10 K for vertical resolution.
It has been shown that a reduction of polar stratospheric water vapour is not necessarily linked to dehydration due to PSC particle sedimentation. Instead, water vapour has been proven to be a valuable tracer for dynamical processes in the polar stratosphere.
Acknowledgements. Special thanks to the station team at Koldewey
station in Ny- ˚Alesund for their help in the balloon launching proce-dures.
References
Abbas, M. M., Michelsen, H. A., Gunson, M. R., Abrams, M. C., Newchurch, M. J., Salawitch, R. J., Chang, A. Y., Goldman, A., Irion, F. W., Manney, G. L., Moyer, E. J., Nagaraju, R., Rinsland, C. P., Stiller, G. P., and Zander, R.: Seasonal variations of water vapor in the lower stratosphere inferred from ATMOS/ATLAS-3 measurements of H2O and CH4, Geophys. Res. Let., 23, 2401– 2404, 1996.
Aellig, C. P., Bacmeister, J., Bevilacqua, R. M., Daehler, M., Kriebel, D., Pauls, T., Siskind, D., K¨ampfer, N., Langen, J., Hart-mann, G., Berg, A., Park, J. H., and Russell III, J. M.: Space-borne H2O observations in the Arctic stratosphere and meso-sphere in the spring of 1992, Geophys. Res. Let., 23, 2325–2328, 1996.
Brasseur, G. and Solomon, S.: Aeronomy of the Middle Atmo-sphere, D. Reidel Publishing Company, Dordrecht, 1984.
Brewer, A. W.: Evidence for a world circulation provided by the measurements of helium and water vapor distribution in the stratosphere, Q. J. R. Meteorol. Soc., 75, 351–363, 1949. Carslaw, K. S., Wirth, M., Tsias, A., Luo, B. P., D¨ornbrack, A.,
Leutbecher, M., Volkert, H., Renger, W., Bacmeister, J. T., Reimer, E., and Peter, T.: Increased stratospheric ozone deple-tion due to mountain-induced atmospheric waves, Nature, 391, 675–678, 1998.
Flentje, H., Renger, W., Wirth, M., and Lahoz, W. A.: Vali-dation of Contour Advection simulations with airborne lidar measurements of filaments during the Second European Strato-spheric Arctic and Midlatitude Experiment (SESAME), J. Geo-phys. Res., 105, 15 417–15 437, 2000.
Flentje, H. and Kiemle, C.: Erosion and mixing of fil-aments in the arctic lower stratosphere revealed by air-borne lidar measurements, J. Geophys. Res., 108, 4232, doi: 10.1029/2002JD002168, 2003.
Forster, P. M. de F. and Shine, K. P.: Stratospheric water vapour changes as a possible contributor to observed stratospheric cool-ing, Geophys. Res. Let., 26, 3309–3312, 1999.
Harries, J. E.: The greenhouse Earth: A view from Space, Q. J. R. Meteorol. Soc., 122, 799–818, 1996.
Hauchecorne, A., Godin, S., Marchand, M., Heese, B., and Souprayen, C.: Quantification of the transport of chemical con-stituents from the polar vortex to midlatitudes in the lower strato-sphere using the high-resolution advection model MIMOSA and effective diffusivity, J. Geophys. Res., 107, 8289, doi: 10.1029/2001JD000491, 2002.
Heese, B., Godin, S., and Hauchecorne, A.: Forecast and simu-lation of stratospheric ozone filaments: A validation of a high resolution potential vorticity advection model by airborne ozone lidar measurements in winter 1998–1999, J. Geophys. Res., 106, 20 011–20 024, 2001.
Hintsa, E. J., Newman, P. A., Jonsson, H. H., Webster, C. R., May, R. D., Herman, R. L., Lait, L. R., Schoeberl, M. R., Elkins, J. W., Wamsley, P. R., Dutton, G. S., Bui, T. P., Kohn, D. W., and Anderson, J. G.: Dehydration and denitrification in the Arctic polar vortex during the 1995–1996 winter, Geophys. Res. Let., 25, 501–504, 1998.
Hofmann, D. J. and Oltmans, S. J.: The effect of stratospheric water vapor on the heterogeneous reaction rate of ClONO2and H2O for sulfuric acid aerosol, Geophys. Res. Let., 19, 2211–2214, 1992.
Kley, D., Drummond, J. W., and Schmeltekopf, A. L.: On the struc-ture and microstrucstruc-ture of stratospheric water vapor, in Atmo-spheric Water Vapor,edited by Deepak, A., Wilkerson, T. D., and Ruhnke, L. H., Academic Press, New York, 1980.
Lait, L. R.: An alternative form for potential vorticity, J. Atmos. Sci., 51, 1754–1759, 1994.
Manney, G. L., Bird, J. C., Donovan, D. P., Tuck, T. J., Whiteway, J. A., Pal, S. R., and Carswell, A. I.: Modeling ozone laminae in ground-based Arctic wintertime observations using trajectory calculations and satellite data, J. Geophys. Res., 103, 5797–5814, 1998.
Michelsen, H. A., Irion, F. W., Manney, G. L., Toon, G. C., and Gunson, M. R.: Features and trends in Atmospheric Trace Molecule Spectroscopy (ATMOS) version 3 stratospheric wa-ter vapor and methane measurements, J. Geophys. Res., 105, 22 713–22 724, 2000.
Nedoluha, G. E., Bevilacqua, R. M., and Hoppel, K. W.: POAM III measurements of dehydration in the Antarctic and comparison with the Arctic, J. Geophys. Res., 107, 10.1029/2001JD001184, 2002.
Newman, P. A., Lait, L. R., Schoeberl, M. R., Seablom, M., Coy, L., Rood, R., Swinbank, R., Proffitt, M., Loewenstein, M., Podolske, J. R., Elkins, J. W., Webster, C. R., May, R. D., Fahey, D. W., Dutton, G. S., and Chan, K. R.: Measurements of polar vortex air in the midlatitudes, J. Geophys. Res., 101, 12 879–12 891, 1996.
Oinas, V., Lacis, A. A., Rind, D., Shindell, D. T., and Hansen, J. E.: Radiative cooling by stratospheric water vapor: big differences in GCM results, Geophys. Res. Let., 28, 2791–2794, 2001. Orsolini, Y. J.: On the formation of ozone laminae at the edge of
the Arctic polar vortex, Q. J. R. Meteorol. Soc., 121, 1923–1941, 1995.
Ovarlez, J. and Ovarlez, H.: Stratospheric water vapor content evo-lution during EASOE, Geophys. Res. Let., 21, 1235–1238, 1994. Reid, S. J. and Vaughan, G.: Lamination in ozone profiles in the lower stratosphere, Q. J. R. Meteorol. Soc., 117, 825–844, 1991. Rind, D. E. and Lonergan, P.: Modeled impacts of stratospheric ozone and water vapor perturbations with implications for high-speed civil transport aircraft, J. Geophys. Res., 100, 7381–7396, 1995.
Schiller, C., Engel, A., Schmidt, U., Borchers, R., and Ovarlez, J.: The partitioning of hydrogen species in the Arctic winter strato-sphere: Implications for microphysical parameters, J. Geophys. Res., 101, 14 489–14 493, 1996.
Schiller, C., Bauer, R., Cairo, F., Deshler, T., D¨ornbrack, A., Elkins, J., Engel, A., Flentje, H., Larsen, N., Levin, I., M¨uller, M., Olt-mans, S., Ovarlez, H., Ovarlez, J., Schreiner, J., Stroh, F., Voigt, C., and V¨omel, H.: Dehydration in the Arctic stratosphere during the SOLVE/THESEO-2000 campaigns, J. Geophys. Res., 107, 10.1029/2001JD000463, 2002.
Sutton, R. T., Maclean, H., Swinbank, R., O’Neill, A., and Taylor, F. W.: High-resolution stratospheric tracer fields estimated from satellite observations using Lagrangian trajectory calculations, J. Atmos. Sci., 51, 2995–3005, 1994.
SPARC: Assessment of upper tropospheric and stratospheric water vapor, WMO/TD-1043, Stratospheric Processes and Their Role in Climate, World Meteorological Organization, Paris, 2000. V¨omel, H., Oltmans, S. J., Hofmann, D. J., Deshler, T., and Rosen,
J. M.: The evolution of the dehydration in the Antarctic strato-spheric vortex, J. Geophys. Res., 100, 13 919–13 926, 1995. V¨omel, H., Rummukainen, M., Kivi, R., Karhu, J., Turunen, T.,
Kyr¨o, E., Rosen, J., Kjome, N., and Oltmans, S.: Dehydration and sedimentation of ice particles in the Arctic stratospheric vor-tex, Geophys. Res. Let., 24, 795–798, 1997.
Waugh, D. W., Plumb, R. A., Atkinson, R. J., Schoeberl, M. R., Lait, L. R., Newman, P. A., Loewenstein, M., Toohey, D. W., Avallone, L. M., Webster, C. R., and May, R. D.: Transport out of the polar vortex by Rossby wave breaking, J. Geophys. Res., 99, 1071–1088, 1994.