HAL Id: hal-00328417
https://hal.archives-ouvertes.fr/hal-00328417
Submitted on 1 Feb 2006
HAL is a multi-disciplinary open access
archive for the deposit and dissemination of
sci-entific research documents, whether they are
pub-lished or not. The documents may come from
teaching and research institutions in France or
abroad, or from public or private research centers.
L’archive ouverte pluridisciplinaire HAL, est
destinée au dépôt et à la diffusion de documents
scientifiques de niveau recherche, publiés ou non,
émanant des établissements d’enseignement et de
recherche français ou étrangers, des laboratoires
publics ou privés.
stratospheric polar vortex in early 2003
A. Engel, T. Möbius, H.-P. Haase, H. Bönisch, T. Wetter, U. Schmidt, I.
Levin, T. Reddmann, H. Oelhaf, G. Wetzel, et al.
To cite this version:
A. Engel, T. Möbius, H.-P. Haase, H. Bönisch, T. Wetter, et al.. Observation of mesospheric air inside
the arctic stratospheric polar vortex in early 2003. Atmospheric Chemistry and Physics, European
Geosciences Union, 2006, 6 (1), pp.282. �hal-00328417�
SRef-ID: 1680-7324/acp/2006-6-267 European Geosciences Union
Chemistry
and Physics
Observation of mesospheric air inside the arctic stratospheric polar
vortex in early 2003
A. Engel1, T. M¨obius1, H.-P. Haase1,*, H. B¨onisch1, T. Wetter1, U. Schmidt1, I. Levin2, T. Reddmann3, H. Oelhaf3, G. Wetzel3, K. Grunow4, N. Huret5, and M. Pirre5
1Institut f¨ur Atmosph¨are und Umwelt, J. W. Goethe Universit¨at Frankfurt, Frankfurt, Germany 2Institut f¨ur Umweltphysik, Ruprecht – Karls Universit¨at Heidelberg, Heidelberg, Germany
3Institut f¨ur Meteorologie und Klimaforschung, Forschungszentrum Karlsruhe, Karlsruhe, Germany 4Institut f¨ur Meteorologie, Freie Universit¨at Berlin, Berlin, Germany
5Laboratoire de Physique et Chimie de l’Environnement, CNRS and Universit´e d’Orl´eans, Orl´eans, France *now at: DEKA Bank, Frankfurt, Germany
Received: 18 July 2005 – Published in Atmos. Chem. Phys. Discuss.: 26 August 2005 Revised: 12 December 2005 – Accepted: 13 December 2005 – Published: 1 February 2006
Abstract. During several balloon flights inside the Arctic
po-lar vortex in early 2003, unusual trace gas distributions were observed, which indicate a strong influence of mesospheric air in the stratosphere. The tuneable diode laser (TDL) in-strument SPIRALE (Spectroscopie Infra-Rouge par Absorp-tion de Lasers Embarqu´es) measured unusually high CO val-ues (up to 600 ppb) on 27 January at about 30 km altitude. The cryosampler BONBON sampled air masses with very high molecular Hydrogen, extremely low SF6and enhanced
CO values on 6 March at about 25 km altitude. Finally, the MIPAS (Michelson Interferometer for Passive Atmospheric Sounding) Fourier Transform Infra-Red (FTIR) spectrome-ter showed NOy values which are significantly higher than
NOy* (the NOyderived from a correlation between N2O and
NOyunder undisturbed conditions), on 21 and 22 March in
a layer centred at 22 km altitude. Thus, the mesospheric air seems to have been present in a layer descending from about 30 km in late January to 25 km altitude in early March and about 22 km altitude on 20 March. We present corroborat-ing evidence from a model study uscorroborat-ing the KASIMA (KArl-sruhe SImulation model of the Middle Atmosphere) model that also shows a layer of mesospheric air, which descended into the stratosphere in November and early December 2002, before the minor warming which occurred in late December 2002 lead to a descent of upper stratospheric air, cutting off a layer in which mesospheric air is present. This layer then de-scended inside the vortex over the course of the winter. The same feature is found in trajectory calculations, based on a large number of trajectories started in the vicinity of the ob-servations on 6 March. Based on the difference between the mean age derived from SF6(which has an irreversible
meso-Correspondence to: A. Engel (an.engel@meteor.uni-frankfurt.de)
spheric loss) and from CO2(whose mesospheric loss is much
smaller and reversible) we estimate that the fraction of meso-spheric air in the layer observed on 6 March, must have been somewhere between 35% and 100%.
1 Introduction
Diabatic descent inside the stratospheric polar wintertime vortices of both hemispheres is a well known phenomenon which can be diagnosed based on tracer observations (e.g. Bauer et al., 1994; Greenblatt et al., 2002; Podolske et al., 1989). This downward transport is part of the large scale Brewer Dobson circulation. Due to the relative isolation of the air masses inside the vortices, the descending air masses conserve many of their characteristics. The origin of the air masses descending into the polar vortex is therefore im-portant when determining their chemical properties. Some observations show that air can also descend from the meso-sphere into the polar stratospheric vortex (e.g. Fisher et al., 1993; Kouker et al., 1995; Ray et al., 2002; Rinsland et al., 1999), which is supported by modelling studies (e.g. Plumb et al., 2002; Siskind et al., 1997).
As mesospheric air has a different chemical composition in comparison to stratospheric air, it is important to know how much air is descending from the mesosphere into the stratospheric polar vortex for a quantitative understanding of stratospheric chemistry. Due to reactions taking place in the thermosphere and upper mesosphere, mesospheric air is enhanced in reactive nitrogen compounds (e.g. Solomon et al., 1985), which can effect ozone (e.g. Konopka et al., 20061). Furthermore, mesospheric air is enhanced in CO
(Lopez-Valverde et al., 1996) and is expected to show en-hanced levels of molecular hydrogen and depleted values of water vapour, which may influence the chemistry of OH rad-icals.
Many studies have used changes in correlations between ozone and long lived tracers to quantify ozone depletion in-side the polar vortex, especially in the distorted northern hemispheric vortex (see, e.g. Proffitt et al., 1990; M¨uller et al., 1997, 2001). These studies assume an initial correla-tion (usually observed in early winter or late fall, i.e. before the onset of any heterogeneous activation of chlorine com-pounds) and then evaluate the change in this correlation with time to infer chemical ozone depletion. Plumb et al. (2000) showed that mixing of air masses with different origin can lead to changes in correlations which are caused by dynam-ics, not by chemistry. If mesospheric air is transported into the polar vortex in significant amounts, air masses with a very different chemical fingerprint and also a different rela-tionship between ozone and long lived tracers may influence the stratospheric composition. The maximum of the ozone mixing ratio is typically found in the upper stratosphere be-tween 5 and 10 hPa, the mesosphere and upper stratosphere are characterised by decreasing ozone with altitude, in con-trast to the middle stratosphere where ozone increases with altitude. Consequently, ozone and long lived tracers like e.g. CH4or N2O should be correlated in the mesosphere, whereas
they are anticorrelated with respect to each other in the lower and middle stratosphere. Any descent of mesospheric air into the stratosphere will consequently lead to a change in the cor-relation between ozone and long lived tracers. The effect of dynamical processes on the correlation between trace gases has been considered in some studies of ozone depletion (e.g. M¨uller et al., 2001). Changes in correlations have also been used to study denitrification inside the polar vortices (e.g. Fa-hey et al., 1990). Kondo et al. (1999) and Wetzel et al. (2002) were able to show that their observed anomalous correlation between N2O and NOy inside the polar vortex in February
and March 1997 was indeed mainly caused by dynamical ef-fects.
Downward transport of mesospheric air is, therefore, an important phenomenon which has a significant impact on the chemical composition of the polar stratosphere and is im-portant in studies of ozone depletion as well (e.g. Konopka et al., 20061). As mentioned above, CO, H2 and NO may
be good tracers of mesospheric air for such studies. All of these tracers, however, have a limited lifetime. Mesospheric loss of SF6has been evaluated by Ravishankara et al. (1993),
Hall and Waugh (1998) and Reddmann et al. (2001), show-ing that SF6 has a mesospheric sink, which leads to a
de-G¨unther, G., Wetter, T., Stiller, G., von Clarmann, T., Glatthor, N., Oelhaf, H., Wetzel, G., Lopez-Puertas, M., Pirre, M., Huret, N., and Riese, M.: Ozone loss driven by nitrogen oxides and triggered by stratospheric warmings may outweigh the effect of halogens, Geo-phys. Res. Lett., in review, 2006.
crease of mixing ratios. SF6and CO2are both used as age
tracers in studies of stratospheric transport. Several studies (Strunk et al., 2000; Andrews et al., 2001; Engel et al., 2002) show that mean age values derived from both tracers are very similar when the mean age is between about 2 and 5 years, whereas there is a slight tendency for SF6derived mean age
to be higher for older air samples. Such differences have in-deed been observed inside the polar vortex (Ray et al., 2002; Plumb et al., 2002; Waugh and Hall, 2002) and at mid lat-itudes in air masses which where characterised as remnants of the polar vortex (Strunk et al., 2000; Waugh and Hall, 2002). In both cases the high mean age values derived from SF6were attributed to the presence of mesospheric air. The
mean age derived from SF6 observations and its difference
from the mean age derived from CO2are, therefore, also an
indicator for the contribution of mesospheric air.
Here we present observations of tracers performed dur-ing a series of balloon flights launched from the ES-RANGE balloon and rocket launch facility near Kiruna, Sweden (67.8◦N, 21.1◦E) in early 2003. All balloons where launched as part of the ENVISAT (ENVIronment SATellite) validation activities. Measurements of different tracers are presented, depending on the observational capabilities of the instruments on board the payloads. The species observed include tracers for which profile observations display spe-cific mesospheric structures. We focus on observations with a balloon-borne cryogenic whole air sampler on 6 March 2003. These observations are used to diagnose the presence of mesospheric air in the stratosphere which must have been recently transported downward into the stratosphere. The data are interpreted using the KASIMA Model. We show that KASIMA can reproduce the observed differences in SF6and
CO2derived mean age, as well as the vertical structure of the
age distribution. Trajectory studies using the FUB (Free Uni-versity of Berlin) Model and heating rates calculated for the actual situation also show the same features. They also show that above the layer of mesospheric air, a large fraction of the polar vortex air is of tropical origin, in agreement with the findings of Konopka et al. (2006)1. The downward transport of mesospheric air is discussed in light of the meteorological situation. Finally we estimate the fraction of mesospheric air present in the stratospheric layer investigated.
2 Characteristics of mesospheric air
Mesospheric air has quite a different chemical composition compared to stratospheric air. This plays an important role when diagnosing transport and mixing from tracer observa-tions and also has an impact on chemical processes. In gen-eral mesospheric air has higher mixing ratios of CO (e.g. Rinsland et al., 1999; Lopez-Valverde et al., 1996), NO (Siskind et al., 1997) and H2 (LeTexier et al., 1988) then
stratospheric air, whereas water vapour is expected to show reduced levels in comparison to stratospheric air (Kouker et
Table 1. Balloon flights performed during the winter 2002/2003 showing evidence of mesospheric air in the stratosphere. All balloons were
launched from ESRANGE, near Kiruna, Sweden (67.8◦N/21.1◦E). All measurements showing mesospheric influence which are used here were performed inside of the polar vortex.
Date Instrument Measurement principle Mesospheric tracer 21 Jan 2003 SPIRALE IR Tuneable Diode Laser CO, see Sect. 3.1 6 March 2003 BONBON on TRIPLE Cryogenic whole air sampler CO, H2and the difference
between CO2and SF6 derived mean age, see Sect. 3.2 20 March 2003 MIPAS-B2 Emission FTIR spectrometer NOyspecies vs. NO∗y
to 21. 3. 2003 calculated from measured N2O, see Sect. 3.3
al., 1995). Dissociation and ionisation reactions of molecu-lar nitrogen are the source of NO, whereas CO is produced from the photolysis of CO2. NO and CO have a rather
simi-lar chemistry in the mesosphere and lower thermosphere, as noted by Solomon et al. (1985). Both molecules have rather short lifetimes in the sunlit mesosphere and lower thermo-sphere due to reactions with atomic oxygen in the case of CO and photolysis in the case of NO. However, once they are transported into the dark high latitude winter atmosphere, their local lifetime increases, resulting in high mixing ratios in the wintertime mesosphere (Solomon et al., 1985; Siskind et al., 1997). Another tracer which shows significant differ-ences between the stratosphere and the mesosphere is SF6.
While no sink processes for SF6 are known in the
strato-sphere, it can be depleted in the mesosphere due to photoly-sis and electron attachment processes (see, e.g. Reddmann et al. (2001) for an overview of SF6chemistry). This process
may influence the age determination based on SF6
observa-tions. The other age tracer often used in the stratosphere, CO2, also has a sink in the upper atmosphere, where its
pho-tolysis is the source of CO. However, once air masses reach the stratosphere and the sunlit atmosphere the sink processes which yield CO should be reversible and CO2should be
re-produced by the reaction of CO with OH radicals. Meso-spheric air should thus be recognizable by enhanced values of NO, CO, H2, lower values of water vapour and a
differ-ence in the mean age determined from SF6 and CO2,
re-spectively. Of these different indicators of mesospheric in-fluence CO should have the shortest chemical lifetime, as it is expected to return to its typical stratospheric mixing ra-tios on the order of about 10 to 20 ppb within a few months. Molecular hydrogen has a somewhat longer chemical life-time, whereas the difference in SF6- and CO2-derived mean
age should be conserved, except for dynamical mixing pro-cesses, which should tend to decrease the difference, when mesospheric air is mixed with stratospheric air. NO, another mesospheric tracer, will go into equilibrium with other ni-trogen species in the stratosphere. The total amount of NOy
should, however, stay enhanced. It should also be noted, that due to the different physical and chemical mechanisms these tracers are not expected to be representative of identical air-masses.
3 Observations
During the ENVISAT validation campaign, which was car-ried out from the ESRANGE Balloon and Rocket launch fa-cility near Kiruna, Sweden (67.8◦N, 21.1◦E), a series of bal-loon payloads was launched to measure a suite of chemical species. The measurements of mesospherically influenced air come from several different instruments. The instruments and the observations are described briefly below (see also Ta-ble 1).
3.1 SPIRALE
SPIRALE is a balloon-borne instrument providing simulta-neous in-situ measurements of atmospheric species from the tropopause up to 40 km using tuneable laser diodes in the mid-infrared (3 µm to 10 µm). The six laser beams pass through a 3.5 m multipass Herriott cell located under the gon-dola. Eighty six reflections occur, giving a 300 m optical path. The instrument provides measurements with a vertical resolution of a few meters. Relative uncertainties on concen-trations have been evaluated (3% for CH4and N2O, 5% for
O3and CO and depending on altitude, 3 to 20% for NO2, 5
to 20% for HNO3and 7 to 15% for HCl). A detailed
descrip-tion of the instrument and its operating mode can be found in Moreau et al. (2005).
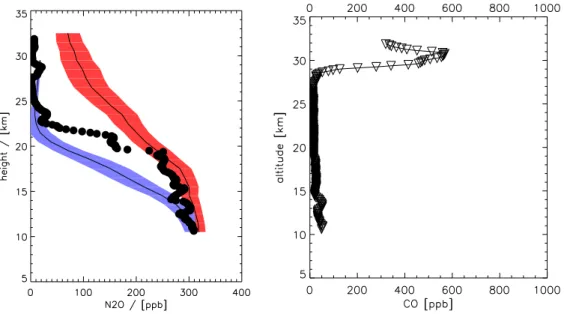
The SPIRALE gondola was launched from ESRANGE on 21 January 2003 and reached a ceiling altitude of nearly 32 km. The observations presented were taken during the as-cent of the balloon. In the lower part of the N2O profile a
lot of structure is observed. Comparison with the two refer-ence profiles shown in Fig. 1 suggests that the observations were partly inside and partly outside of the vortex or in the
Fig. 1. Vertical profiles of selected trace gases observed on 21 January 2003 from Kiruna, Sweden (68◦N) by the SPIRALE TDL instrument. The left-hand panel shows the vertical profile of N2O plotted together with two mean profiles calculated from many observations at mid latitudes during summer/fall (red) and inside the polar vortex (blue). For the details of the mean profiles see Engel et al. (2002). The right-hand panel shows the vertical profile of CO, which is extremely enhanced above 29 km altitude.
vortex edge region. This feature is confirmed by PV maps. Between 15 and 19 km altitude SPIRALE sampled outside vortex air as can be seen from the much higher N2O values
than those of the reference profile. In this region the N2O
values are close to the mid latitude reference profile. Above 20 km altitude there is a sharp decrease in N2O mixing ratios
and above 22 km altitude the SPIRALE observations fall in the range of the reference profile for inside vortex conditions. The CO vertical distribution shows typical stratospheric val-ues between 25 and 10 ppb in the altitude range between 15 and 27 km. Just above 27 km altitude, a sharp increase in CO mixing ratios is observed, with maximum values above 500 ppb of CO in a layer between 30 and 31 km altitude. As explained above, enhanced CO values are typical of the high latitude winter mesosphere. E.g. ISAMS measurements in January 1992 showed values up to 4 ppm of CO in the high latitude winter mesosphere (Lopez-Valverde et al., 1996). The elevated CO is, therefore, a clear sign of mesospheric air in the stratosphere. The SPIRALE observations are dis-cussed in detail in Huret et al. (2006).
3.2 BONBON on TRIPLE
TRIPLE is a multi-instrument payload carrying a cryogenic whole air sampler (BONBON) (Schmidt et al., 1987; Engel et al., 1997), a Chemical Conversion Resonance fluorescence instrument for the measurement of ClO and BrO (Woyke et al., 1999) and a Lyman-α hygrometer (FISH) (Z¨oger et al., 1999). The samples collected by BONBON are analysed for a large suite of trace gases, including the most
promi-nent CFCs, N2O, CH4, H2, CO, SF6and CO2. Most
mea-surements are given relative to the NOAA/CMDL scale (e.g. Elkins et al., 1993; Conway et al., 1994), with the excep-tion of SF6, which is given on the scale defined by Maiss
and Levin (1994) and CO and H2which are calibrated
rela-tive to a standard provided by the Oregon Graduate Institute (OGI) (Khalil and Rasmussen, 1988, 1990). As explained above, H2, CO and SF6can be used to detect the influence of
mesospheric air. The balloon was launched on 6 March 2003 when the polar vortex was well above Kiruna, and reached an altitude of more than 32 km. Figure 2 shows the verti-cal distribution of N2O, H2, CO and SF6. N2O shows a very
steep vertical gradient, with mixing ratios falling below 5 ppb above 22 km, indicating that the samples were collected well inside of the polar vortex. Above this altitude there is a slow increase with altitude, with values at the top of the profile reaching between 18 and 19 ppb. CO and H2 show
maxi-mum values in a layer at an altitude of about 25 km, i.e. sev-eral km above the minimum values of N2O. In the same layer
which shows high mixing ratios of CO and H2, a local
mini-mum in SF6is observed, whereas CO2shows no significant
structures in this region. Just below the maximum of H2, one
sample shows particularly low values of H2. Such values are
expected in the upper stratosphere near 50 km altitude, es-pecially in the summer hemisphere, when the photochemical loss of H2is at its maximum (LeTexier et al., 1988).
How-ever, the model used by LeTexier et al. (1988), also predicts a local minimum in H2in the high latitude winter stratosphere
Fig. 2. Vertical profiles of selected trace gases observed on 6 March 2003 from Kiruna, Sweden (68◦N) by the BONBON whole air sampler instrument on the TRIPLE gondola. The left-hand panel shows the vertical profile of N2O plotted together with two mean profiles calculated
from many observations at mid latitudes during summer/fall (red) and inside the polar vortex (blue). For the details of the mean profiles see Engel et al. (2002). Measured profiles of CO (black), H2(red), and SF6(blue), are shown on the right-hand panel.
3.2.1 Mean age of air from SF6and CO2observations
The observations of SF6 and CO2 were used to derive
the mean age (0) of air in the stratosphere, using tro-pospheric time series derived from SF6 observations by
NOAA/CMDL (Geller et al., 1997, updated) and IUP Hei-delberg (Maiss and Levin, 1994, updated) and CO2
measure-ments by NOAA/CMDL (Conway et al., 1994, updated). As a first approximation we have calculated the mean age using the formulas given in Volk et al. (1997), which requires a pa-rameterisation of the width of the age spectrum (1) to correct for non-linearity in the tropospheric growth rates. We have used a time period of 15 years before the sampling date for the fit to the tropospheric data. The parameterisation of the width of the age spectrum (1=0.7*02)was chosen as in En-gel et al. (2002), which is based on Hall and Plumb (1994) and also showed most consistent results between our CO2
and SF6derived mean age values. In a second step we have
then used the estimated mean age value to explicitly calculate the Greens function describing the age spectrum, again using the same parameterisation for the width of the age spectrum, and integrating it in time, in order to determine the time in-terval over which one should fit in order to represent 98% of the tropospheric input. We then fitted a second order polyno-mial to the tropospheric reference data using this time period, which would cover 98% of the tropospheric input. Using this procedure, shorter fit intervals are used for low mean age
val-ues, which leads to a better representation of the tropospheric data. As the non-linearity in the tropospheric time series of CO2and SF6 are rather small, the differences between this
procedure and the procedure used in Engel et al. (2002) are less than 0.5 years.
As noted above, SF6 can be irreversibly chemically
de-stroyed in the mesosphere. While CO2can also be
photol-ysed in the upper mesosphere, this leads to the formation of CO, which, further down in the atmosphere can be ox-idised again to reform CO2. The observed enhanced
mix-ing ratios of CO indicate that this may have happened, yet the effect is small, as the maximum CO value only reaches about 200 ppb, which corresponds to an error in the mean age derived from CO2 of less than 2 months. In the
ab-sence of loss processes, the age values derived from SF6
and CO2 are expected to agree within their error bars.
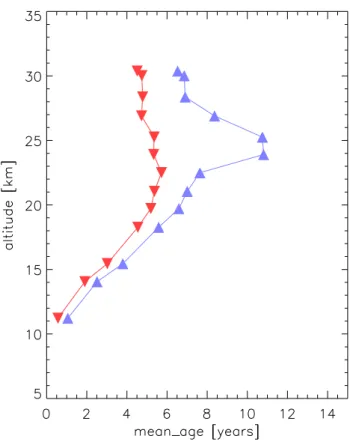
En-gel et al. (2002) showed that for several observations per-formed between 1997 and 2000 this was indeed true when mean ages ranged between 2 and 5 years. The mean age pro-files obtained using SF6 and CO2 are compared in Fig. 3.
There is a large difference in derived mean age around 25 km altitude, with SF6derived mean age of more than 10 years,
in contrast to the CO2derived mean age, which shows values
around 5 years, typical for stratospheric air at these altitudes (see, e.g. Engel et al., 2002). As the measured SF6 must
Fig. 3. Mean age of air calculated from SF6(blue) and CO2(red)
for the vertical profiles observed on 6 March 2003, from Kiruna by the BONBON whole air sampler instrument on the TRIPLE gon-dola, see text for details.
SF6-based result does not represent a mean age equivalent to
mean atmospheric transport times. In the following we will, therefore, call this term the apparent age. Note that the CO2
-derived mean age and these SF6-derived apparent age values
also show differences above and below this level, indicating that air masses above and below the layer at 25 km also have partly mesospheric characteristics.
3.3 MIPAS-B
MIPAS-B is an advanced cryogenic FTIR spectrometer spe-cially tailored to the operation on a stratospheric balloon gon-dola (Friedl-Vallon et al., 2004). Equipped with suitable sub-systems, MIPAS-B allows precise limb emission sounding of IR active atmospheric constituents. Vertical profiles of ozone and a considerable number of key radicals and reser-voir species of the nitrogen, hydrogen, and chlorine families as well as source gases can be obtained simultaneously with an altitude resolution of 2 to 3 km. Retrievals of trace gas profiles are performed with a non-linear least squares fitting procedure (H¨opfner et al., 2002). The error estimation in-cludes random noise as well as the mutual influence of the fitted parameters, temperature errors, line of sight (LOS) in-accuracies, and spectroscopic data errors. The precision of
retrieved profiles is typically 3–7% and the accuracy reaches 7–15 % (see, e.g. Wetzel et al., 2002).
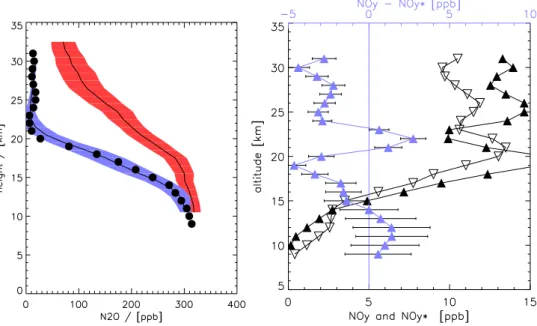
The MIPAS-B instrument was launched on 20 March 2003 from Kiruna. The balloon reached a ceiling altitude of 31 km. Several series of limb scans were performed. The instrument can be adjusted in order to observe in a specified direction. Here we present results of a limb scan measured during the night (around 22:00 UT) when the instruments field of view was directed into the vortex. Figure 4 compares the N2O
observations of MIPAS-B with our reference profiles. Over the entire altitude range there is a remarkable agreement. As with the in-situ observations from the cryogenic whole air sampler, the lowest values of N2O are not observed at the top
of the profile but rather around 22 to 23 km altitude. In the same altitude layer, a marked difference between the NOy
values (derived from the observed mixing ratios of HNO3,
ClONO2, NO and NO2 ) and NOy*, the expected NOy
de-rived from a correlation between N2O and NOyunder
undis-turbed polar winter conditions) is observed (Fig. 4, right hand panel). The difference is higher than could be explained by the error bars of the measurements. As noted above, NO is enhanced in the mesosphere. The presence of mesospheric air could thus explain the observed enhancement in NOywith
respect to NOy*.
4 Model calculations and data intercomparison
In order to investigate when the mesospheric air was trans-ported into the stratosphere, we performed model calcula-tions using the KASIMA model and trajectory calculacalcula-tions with the FUB model. In particular, we will use the apparent age derived from modelled and measured SF6as a tracer of
mesospheric air for the comparison.
4.1 Model calculations
The model experiments were made with the KASIMA model environment. A multi-annual run in a similar manner as de-scribed in Reddmann et al. (2001) was started in model year 1989. As meteorological input the ERA40 re-analysis and subsequent operational analyses were used up to 1 Pa, us-ing only the ECMWF temperature as a tendency term (see Kouker et al., 1999). Resolution was T21 in the horizontal corresponding to about 5 deg in spherical coordinates, and 750 m in the vertical from 10 up to 25 km. Above 25 km lev-els increase to about 3 km at 120 km pressure altitude, which is the top level of the model. From the eight different SF6
like chemical tracers described in Reddmann et al. (2001), the tracer S3, which describes a standard SF6chemistry, was
used to initialize a short-term transport experiment with a horizontal resolution of T63 (equivalent to about 2 deg) and a vertical resolution of 250 m up to 30 km. The date of initial-ization was chosen to the day of the year (DOY) 340 in 2002. This tracer was transported as a completely inert tracer until
Fig. 4. Vertical profiles of selected trace gases observed on 20 March 2003 from Kiruna, Sweden (68◦N) by the MIPAS-B FTIR spectrometer. The left-hand panel shows the vertical profile of N2O plotted together with two mean profiles calculated from many observations at mid
latitudes during summer/fall (red) and inside the polar vortex (blue). For details of the mean profiles see Engel et al. (2002). Note that the MIPAS-B profile agrees very well with our mean profile for inside vortex conditions. The right-hand panel shows the vertical profiles of NOy
(open triangles), NOy* (closed triangles) and the difference between them (blue triangles). In the absence of de-/renitrification processes or
anomalous mixing events, it is expected that this difference is close to zero. Note the significantly enhanced values of NOyin comparison to
the NOy* expected from the N2O observation in the layer between 21 and 23 km.
March 2003. Note, that the calculation of the tracer distribu-tion in the model results from a 10 year run, where the model is about at equilibrium conditions.
4.2 Comparison of models and observations
Apparent age calculated from modelled SF6 is used as a
mesospheric tracer in the KASIMA model. A direct compar-ison is only possible with the SF6observation from 6 March
2003. Figure 5 shows the comparison of the BONBON ob-servations with the KASIMA data for this date interpolated to the time and coordinates of the BONBON observations. The location of the mesospheric layer is very well reproduced. The apparent age values from the model (maximum of be-tween 12 and 13 years) are a little higher than the observa-tions (maximum about 11 years). This may be due either to the large uncertainties in the mesospheric chemistry of SF6
or to the integration which occurs during the collection of the samples. Similar comparisons with the mesospheric tracers observed during the other flights are shown in Figs. 6 and 7. On 21 January 2003 the sharp increase observed in the SPIRALE CO observations is not very well reproduced in the model. This could be due to the different sink region of CO and SF6 in the mesosphere, as a comparison with
observed CH4 mixing ratios (not shown) shows quite sim-ilar vertical structure. For 20/21 March, KASIMA models
the mesospheric layer at about 24 km, which is about 1 km higher than was actually observed by MIPAS.
KASIMA is able to reproduce the layered structure ob-served on 6 March 2003 and 20/21 March 2003 and also produces the right order of magnitude in apparent age and the correct altitude range of the mesospherically influenced layer. We conclude that there is qualitatively good agreement between the KASIMA calculations and the balloon observa-tions. On 6 March 2003, where a direct comparison is possi-ble, there is also a good quantitative agreement.
4.3 Temporal development of the mesospheric air intrusion
From the observations of the SPIRALE instrument it is clear that mesospheric air was present in the stratosphere already in late January 2003. The SPIRALE observations also indi-cate a layered structure, as observed in the cryosampler and MIPAS-B results. It is thus likely that the observed meso-spheric air was transported into the stratosphere already early during the winter. Figure 8 shows the vertical cross sec-tions of the zonal mean of the apparent age derived from the KASIMA cacluations for the DOY 300–360 in 2002. De-scent of high apparent age values is observed already around November. While an apparent age level of 10 years is ob-served only around 50 km altitude on day 300 (27 October), it has descended to around 42 km on day 320 (16 November)
Fig. 5. Comparison of SF6derived mean age from the KASIMA model (solid line) and from SF6observed on 6 March by the
cryo-genic whole air sampler BONBON.
Fig. 6. Comparison of SF6derived mean age from the KASIMA
model (solid line) with CO observation by SPIRALE on 21 Jan-uaray 2003 as tracer of mesospheric air. Note that CO has a differ-ent chemistry from SF6, so that no direct comparison is possible.
Fig. 7. Comparison of SF6derived mean age from the KASIMA
model (solid line) with differences between NOyand NOy*
obser-vations by MIPAS on 20 March 2003 as tracer of mesospheric air.
and to 35 km on day 340 (6 December). On day 360 (26 De-cember) the model shows apparent age values of 10 years as low as 32 km. At this time, however, there is a layer between about 40 and 50 km altitude, which shows lower, i.e. rather stratospheric values of apparent age, and which separates the regions influenced by mesospheric air above and below. This shows that air masses with more stratospheric character must have been transported polewards at this altitude level some-time during the second half of December.
The high resolution version of the model then conserves the layered structure which was produced in December 2002 during January, February and March 2003, while it is slowly being transported downwards by the descent inside of the vortex. By March 2003 (Fig. 5), the layer of mesospheric air in the model is transported down and is centered around 24-25 km altitude, with peak values of apparent age exceed-ing 10 years, as was observed by the cryogenic whole air sampler.
4.4 Trajectory calculations with the FUB model
Long term trajectory calculations were made with the FUB trajectory model (Reimer and Scherer, 1992). In the ver-sion used in this study, the model uses the ECMWF oper-ational analyses as meteorological input up to 1 hPa. The ECMWF data are interpolated horizontally to a 1.25◦×1.25◦
(a) (b)
(c) (d)
Fig. 8. Zonal mean distribution of apparent age for the DOY 300 (a), 320 (b), 340 (c) and 360 (d), as calculated from the KASIMA model.
The descent of mesospheric air masses with high apparent age values can be seen already on day 300; note the local minimum in apparent age values around 2 hPa (about 45 km) on day 360 at high northern latitudes, which indicates air masses of more stratospheric origin.
latitude/longitude grid and vertically to 25 isentropic levels which extend from the surface up to 1600 K. To consider diabatic processes, heating rates derived from the radiative transfer scheme of the SLIMCAT 3-D chemical transport model (Chipperfield, 1999) are applied.
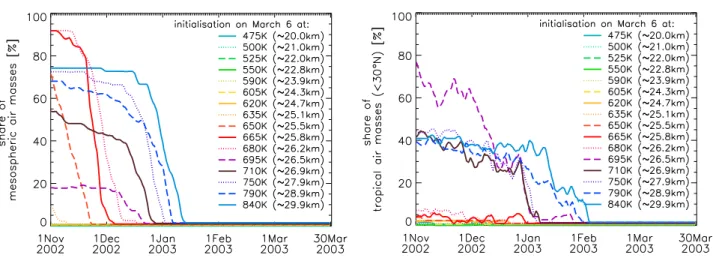
An ensemble of trajectories was initialised on 6 March 2003 (12:00 UT) within a grid around Kiruna (latitude: 66.25◦N–68.75◦N, longitude: 20.0◦E–22.5◦E) at different potential temperature (2) levels between 475 K and 840 K (∼20–30 km). One kilometer (12: 25–50 K) was chosen as altitude distance between two 2-levels. In the altitude range between 24 and 27 km, where the TRIPLE measure-ment showed unusual trace gas concentrations, the altitude distance was scaled down to 15 K (∼0.3 km). Starting on 6 March 2003, the trajectories were calculated backward up to 1 November 2002 and forward up to 30 March 2003.
Figure 9 shows time series of the mean and the standard deviations of the potential temperature of the calculated tra-jectories (not all levels are shown, in order not to overload the plot). The trajectories, which were initialised on 6 March at levels below 640 K (∼25.2 km, yellow line in Fig. 9), stay in the stratosphere over the whole winter. The trajectories initialised at 665 K (∼25.8 km, red line in Fig. 9) enter the
stratosphere on average around the end of November. At the levels above the standard deviation is very high. This indi-cates high variations in the origin and the transport path of the air masses. Figure 10 confirms the different origin of the air masses at the upper levels, arriving in the area around Kiruna on 6 March. Most trajectories of the levels initialised from 710 K to 840 K (∼26.9–29.9 km) descended from the meso-sphere, but there is also a large amount of air masses com-ing from tropical regions. A similar calculation by Rosen-field and Schoeberl (2001) for several winters between 1992 and 2000 actually showed a smaller fraction of air masses which originates in the tropics. The mesospheric part of the air masses descended into the stratosphere between end of December and mid of January. The trajectories initialised at 665 K (∼25.8 km) show nearly no tropical origin, but a high mesospheric percentage entering the stratosphere between November and beginning of December. Due to the absence of tropical air, the mean age of air in this layer is expected to be higher than in the levels above and below (see Sect. 5). This layer of mesospheric air persists over the time and de-scends downward within the polar vortex.
The trajectory calculations can only give a qualitative view of the observed features. Mixing processes cannot be
Fig. 9. Temporal evolution of potential temperature of the trajectories (mean and standard deviation) for selected initialisation levels. The
black vertical lines indicate the measurement days investigated in this paper. The red segments within these black lines denote the altitude range where the observation showed a high fraction of mesospheric air. See text for more details.
Fig. 10. Percentage of the trajectories located in the mesosphere (left-hand panel) and in the tropics (right-hand panel) over the time.
Trajectories leaving the model domain trough the upper boundary (2≥1600 K) considered to be of mesospheric origin. Trajectories residing at tropical latitudes (<30◦N) were counted as tropical air masses. Some air masses are located within the tropical mesosphere, so the sum of mesospheric and tropical percentages can be higher than 100%.
depicted with this kind of investigation. Merely, the main transport phenomena and the main temporal development can be described. As no mixing occurs in these calculations, it is expected that the absolute amount of the mesospheric fraction is overestimated in the peak, whereas it may be un-derestimated in the other regions. The results of the trajec-tory calculation fit very well the mesospheric layers observed by SPIRALE on 27 January and by TRIPLE on 6 March (Fig. 9). At the end of March the mesospheric layer within the stratosphere derived from the trajectory calculation is located around 24 km, a little bit higher than measured by the MIPAS instrument. This result is in agreement with the small disagreement in altitude between the KASIMA model and MIPAS observations. The large fraction of tropical air masses in the backward trajectories in comparison to previ-ous studies (Rosenfield and Schoeberl, 2001) supports the as-sumption that the winter 2002/2003 was extraordinary from a dynamical point of view.
5 Discussion
The measurements presented above show that air masses with mesospheric characteristics were present in the strato-spheric polar vortex during early 2003 (January to March pe-riod). As mesospheric signatures were observed during sev-eral balloon flights (each only representing a snapshot of the stratospheric conditions) it is concluded that this must have been a rather wide spread feature. The observations give a consistent picture of a layer of mesospheric air which is transported downwards in the stratosphere, in the same time being diluted with air of stratospheric origin.
5.1 Downward transport of mesospheric air
The KASIMA calculations show that the mesospheric air descended mainly between November and mid December 2002. In the second half of December the air descending into the polar vortex showed apparent ages characteristic of stratospheric air. As described by Naujokat and Grunow (2003), the first mid winter warming in the lower strato-sphere of the winter 2002/2003 started to develop in the second half of December, i.e. later than the descend of the mesospheric air in the model. In the upper stratosphere, a continuous warming was observed from the beginning of November until mid December. It therefore seems that the warming in late December was not responsible for the down-ward transport of mesospheric air, but could rather be as-sociated with poleward transport of upper stratospheric air, in accordance with the high fraction of tropical air derived from the trajectory calculations. The general mechanisms for stratospheric warmings which was first suggested by Mat-suno (1971) is that an enhanced wave forcing leads to a de-celeration of the polar night jet and a simultaneous poleward meridional circulation. As air from lower latitudes is
trans-ported polewards (see section on trajectory calculations un-der Sect. 4.4), there is descending motion below and ascend-ing motion above at high latitudes, leadascend-ing to warmascend-ing of the stratosphere and a simultaneous cooling of the mesosphere (e.g. Labitzke, 1972). The downward transport and warming at high latitudes in the stratosphere is also necessary for the conservation of geostrophic equilibrium (e.g. Petzold, 1992). As the upper stratospheric air from lower latitudes descended inside the vortex, it cut off the further descent of mesospheric air into the stratosphere. This is reflected in the high frac-tion of air of tropical origin in the trajectories which were started above the mesospherically influenced layer. Haynes et al. (1991) showed that the pole to pole meridional circu-lation in the mesosphere is driven by gravity wave breaking. Plumb et al. (2002) argued that the westerly flow in the winter stratosphere of the northern hemisphere acts as a selective fil-ter allowing only waves with an easfil-terly phase speed to prop-agate upwards. The breaking of these waves leads to a west-erly force which in turn leads to a poleward meridional cir-culation. The deceleration of the stratospheric westerly zonal wind during the stratospheric warming events in late Decem-ber and January would thus let gravity waves with different phase speeds travel upward, leading to a less selective meso-spheric forcing and a weaker forcing of the poleward merid-ional circulation in the mesosphere. This is consistent with a similar observation of mesospheric air based on observations of SF6and CO2measurements on 5 March 2000 (Plumb et
al., 2002; Ray et al., 2002), which did not show such a lay-ered structure but rather increasing mesospheric influence up to an altitude of about 32 to 33 km. The 1999/2000 vortex was much more stable than the 2002/2003 vortex, the selec-tive clipping of gravity waves in the stratosphere would thus have persisted over the winter. A fast poleward meridional transport of air has also been observed in the middle strato-sphere during the major warming in late January (Kleinb¨ohl et al., 2005). Note, however, that these air masses were out-side of the polar vortex, whereas our trajectory calculations show tropically influenced air-masses inside of the polar vor-tex. These air masses were transported poleward above the polar vortex and descended into the vortex.
Previous simultaneous observations of SF6and CO2
(En-gel et al., 2002), which were also partly performed inside the polar vortex showed no such difference between CO2
and SF6 derived mean age values. The only previous
oc-casion when such a large difference between CO2 and SF6
derived mean age was observed by our group was when sam-pling a remnant of the 1996/1997 polar vortex on 23 June in mid latitudes (Strunk et al., 2000). A balloon observation on 5 March 2000 (Ray et al., 2002; Plumb et al., 2002) also showed the influence of mesospheric air, while another ob-servation a few days prior on 1 March 2000 showed quite good agreement between CO2-derived mean age and SF6
-derived mean age (Engel et al., 2002), although both observa-tions were made well inside the vortex. Other simultaneous observations of SF6 and CO2 during January and February
Fig. 11. Fraction of mesospheric air as calculated from the
differ-ence in mean ages derived from SF6and CO2observations of the
cryogenic whole air sampler on 6 March, 2003. The black lines represent assumed difference of 5, resp. 15 years, while the blues dots represent the mesospheric fraction based on the assumed dif-ference of 10 years between SF6-derived apparent age and CO2
-derived mean age.
1997 did not show such a pronounced effect inside the polar vortex, although differences were noted when the air masses showed very high mean age values above 5 years (Engel et al., 2002). The influence of mesospheric air thus seems to be an irregular phenomenon which influences the vortex to largely varying extents in different years, depending on the dynamical evolution over the winter.
5.2 The fraction of mesospheric air in the stratosphere
As shown above, the presence of mesospheric air in the stratosphere has an important impact on the chemistry of the stratosphere and also plays an important role in many studies where tracers or tracer-tracer correlations are used to infer chemical ozone loss or mixing processes. We therefore try to quantify the fraction of mesospheric air which must have been present in the observed air masses, based on the obser-vations on 6 March 2003. We assume that the mean age of air derived from the CO2observations is not affected by
chemi-cal processes, as the photolysis of CO2in the mesosphere is a
reversible process (CO is oxidised back to CO2). This is
sup-ported by the observation of several hundreds of ppb of CO
Fig. 12. N2O - ozone correlations derived from the three balloon
observations. The small blue diamonds represent the SPIRALE ob-servations of 21 January, the red triangles are BONBON observa-tions from 6 March and the green squares are MIPAS observaobserva-tions from 20/21 March 2003. The mesospheric part of the correlaton (based on the respective tracers as explained in Sect. 3) is shown as bold symbols.
in January and only about 200 in early March. Assuming that the 200 ppb of CO observed on 6 March 2003 stem entirely from the photolysis of CO2, this would result in an
overesti-mation of the CO2-derived mean age of less than 2 months.
We assume that the mean age derived from the stratospheric observations of SF6 (0SF6,obs) and CO2 (0CO2,obs) is
pro-duced by a mixture of stratospheric air (with a fraction of fstrat)which is unaffected by mesospheric processes and has
mixing ratios of SF6and CO2which would give consistent
mean age values (0Strat) and a fraction of mesospheric air
(fmes), which is affected by loss of SF6. The apparent mean
age values derived from the SF6transported from the
meso-sphere would be 0app,mes, the true mean age of air entering
from the mesosphere would be 0mes. If we neglect the small
loss of CO2in the mesospheric air we can write the
follow-ing equations for the mean age values determined from SF6
and CO2in the stratosphere:
0SF6,obs=fstrat×0Strat+fmes×0app,mes (1)
0CO2,obs=fstrat×0Strat+fmes×0mes. (2)
Subtracting Eq. (2) from Eq. (1) and solving for fmesyields
fmes=
0SF6,obs−0CO2,obs
0app,mes−0mes
. (3)
In order to derive the fraction of mesospheric air, it is thus necessary to know the difference in mesospheric values of apparent age and of mean age. We have chosen to take this value from the model calculations of KASIMA. As can
be seen from Fig. 8, apparent age in the vicinity of the stratopause (about 50 km altitude) shows a large range of val-ues, between about 10 and 20 years. Typical mean age values in the upper stratosphere and lower mesosphere are estimated to be on the order of 5–6 years. We have therefore chosen to use a mean value of about 10 years as the difference be-tween mean age and apparent age for further calculations, knowing that all results based on this value can only repre-sent rough estimates of the amount of mesospheric air in the stratosphere. As a sensitivity study we have also performed the calculation assuming 5 and 15 years as a difference be-tween apparent age and true mean age for mesospheric air entering the stratosphere. The vertical profile of the meso-spheric fraction of the air calculated in this way is shown in Fig. 11, where the thin lines represent the profiles based on apparent age difference of 5 and 15 years for mesospheric air entering the stratosphere.
The largest fraction of mesospheric air is calculated around 25 km altitude. Depending on the assumed appar-ent difference in age for mesospheric air appar-entering the strato-sphere, a fraction between 36% (assuming a difference of 15 years), 54% (assuming a difference of 10 years) and 108% (assuming a difference of 5 years) is calculated. The calcu-lation of a fraction of 108% shows that the choice of 5 years of apparent age difference for mesospheric air entering the stratosphere is obviously to low, as the observed air mass showed a difference between apparent age and mean age from CO2of about 5.5 years. A fraction above 1 should thus
be interpreted as undiluted mesospheric air within the limits of uncertainty. Based on the assumptions stated above, the air mass observed at 30 km altitude had a mesospheric frac-tion of 20 (14–41)%, whereas the air observed in the lowest part of the stratosphere around 11 km altitude would have a fraction of 3 to 10% of mesospheric air. As can be seen from Fig. 8, the model predicts a large variability of apparent age values with altitude and latitude. It is therefore not possi-ble to extrapolate these results to the entire vortex or attempt to calculate the amount of mesospheric air in the vortex. It is clear, however, that in order to explain significant amounts of mesospheric air in the stratosphere, because of the low pres-sure at the stratopause very large volumes of mesospheric air must have been transported into the stratosphere. Plumb et al. (2002) noted that in their model, the mesosphere was flushed completely during a single winter. One can thus es-timate that the entire mesosphere is flushed into the strato-sphere twice per year (once during northern hemistrato-sphere win-ter, once during southern hemisphere winter). If this quantity of air was mixed over the entire stratosphere above 100 hPa, it would – assuming a mean stratopause pressure of 0.15 hPa – correspond to a mesospheric input of about 0.3% of the air in this layer per year. Therefore, we expect the influence of mesospheric SF6 loss to be low on mid latitude age of
air investigations based on SF6observations. A significant
influence of the mesospheric loss of SF6on mean age
deter-mination should thus only be visible, if the mesospheric air
is confined to an isolated region of the stratosphere, like e.g. the polar vortex.
5.3 Ozone N2O correlations
As noted in the introduction, mesospheric air masses have very different chemical characteristics from stratospheric air masses. In particular, the anti correlation between N2O and
ozone in the stratosphere, changes to a correlation in the mesosphere. The presence of mesospheric air in the strato-sphere, is thus expected to influence studies of ozone loss based on correlation analysis. This method to derive chem-ical ozone loss has recently been reviewed by M¨uller et al. (2005). In their study, however, the presence of large amounts of mesospheric air was not considered. As shown above, the fraction of mesospheric air in such mesospheric intrusions may be as high as 50%. Figure 12 shows the corre-lation between N2O and ozone observed during the three
bal-loon flights. For all flights, the mesospheric data points are shown as bold symbols. There is no clear difference between these data points and the other data. However, as indicated above, the mesospheric influence was not confined to these regions, which makes it difficult to assess the difference be-tween chemical ozone loss in the stratosphere and naturally ozone poor mesospheric air. A more detailed study, includ-ing full chemistry model runs would be needed to investigate the question of the influence of mesospheric air on N2O –
ozone correlations and ozone loss deduced from these.
6 Conclusions
We have shown that air which has been transported from the mesosphere was observed in the Arctic stratospheric vortex in early 2003. This was observed during 3 balloon flights, based on different tracers or combinations of tracers. The mesospherically influenced air propagated downwards with time. It was observed above 30 km altitude in late January, as a layer centred around 25 km altitude in early March and around 22 km in late March. Model calculations show that the descent of mesospheric air occurred during November and December 2002. During the second half of December, when the first minor midwinter warming occurred, air of mainly stratospheric origin was transported polewards in the upper stratosphere and beneath this a layer of mesospheric air was cut off and descended further inside the vortex. The KASIMA model is able to reproduce the vertical distribution of mesospherically influenced air on 6 March. The model also calculates the correct order of magnitude of SF6derived
apparent age. For the MIPAS balloon flight on 20/21 March 2003 a qualitative agreement is found, whereas there is less good agreement on 21 January 2003, probably due to the dif-ferent mesospheric tracers between model and observation. Long term trajectory calculations using the heating rates cal-culated for the SLIMCAT model are also able to reproduce
the layered structure. These calculations also show, that a large fraction of the air above the mesospherically influenced layer was of tropical origin, corroborating the interpretation that air from lower latitudes was transported polewards dur-ing the minor warmdur-ing at the end of December 2002, thereby cutting off the descending mesospheric air. Based on as-sumptions about the difference between apparent age and true mean age for mesospheric air entering the stratosphere, we estimate that the fraction of mesospheric air in the layer observed on 6 March must have been more than 36%. Even at the lowest altitudes (samples taken at 11.2 km altitude) ob-served on 6 March, mesospherically influenced air must have been present. We estimate the fraction of mesospheric air here to be between 3 and 10%.
The clear evidence that mesospheric air was mixed with stratospheric air inside the Arctic polar vortex during the winter 2002/2003 is an important finding, which must be considered when using correlation studies to derive denitri-fication or ozone loss. It is also clear from this kind of ob-servations, that for models to correctly simulate stratospheric polar ozone chemistry, the mesosphere must be included. For example a comparison between observed an modelled pas-sive ozone by Konopka et al. (20061) showed that there were large losses of ozone in the polar vortex in early 2003 which are attributed to chemical ozone depletion due to enhanced NOyvalues, which are in part of mesospheric origin.
Acknowledgements. The balloon launches discussed in this study
were performed by the CNES balloon launch team, under the lead of the late P. Faucon. We would like to thank P. Faucon for his friendship and professional co-operation over many years and to acknowledge the excellent balloon launch operations during the ENVISAT validation campaign. Funding by ESA, CNES and DLR for the balloon operations is gratefully acknowledged.
Edited by: M. Dameris
References
Andrews, A. E., Boering, K. A., Daube, B. C., Wofsy, S. C., and Loewenstein, M.: Mean ages of stratospheric air derived from in situ observations of CO2, CH4and N2O, J. Geophys. Res., 106(D23), 32 295–32 314, 2001.
Bauer, R., Engel, A., Franken, H., Kulessa, G., Schiller, C., Schmidt, U., Borchers, R., and Lee, J.: Monitoring the verti-cal structure of the arctic polar vortex over northern Scandinavia during EASOE: regular N2O profile observations, Geophys. Res. Lett., 21, 1211–1214, 1994.
Chipperfield, M. P.: Multiannual simulations with a three-dimensional chemical transport model, J. Geophys. Res., 104(D1), 1781–1806, 1999.
Conway, T. J., Tans, P. P., Waterman, L. W., Thoning, K. W., Kitzis, D. R., Masarie, K. A., and Zhang, N.: Evidence for interannual variability of the carbon cycle from the National Oceanic and Atmospheric Administration/Climate Monitoring and Diagnos-tics Laboratory Global Air Sampling Network, J. Geophys. Res., 99(D11), 22 831–22 855, 1994.
Elkins, J. W., Thompson, T. M., Swanson, T. H., Butler, J. H., Hall, B. D., Cummings, S. O., Fisher, D. A., and Raffo, A. G.: De-crease in the growth rates of atmospheric chlorofluorocarbons 11 and 12, Nature, 364, 780–783, 1993.
Engel, A., Schmidt, U., and Stachnik, R. A.: Partitioning between chlorine reservoir species deduced from observations in the Arc-tic winter stratosphere, J. Atmos. Chem., 27, 107–126, 1997. Engel, A., Strunk, M., M¨uller, M., Haase, H.-P., Poss, C., Levin,
I., and Schmidt, U.: The temporal development of total chlorine in the high latitude stratosphere based on reference distributions of mean age derived from CO2and SF6, J. Geophys. Res., 107,
4136, doi:10.1029/2001JD000584, 2002.
Fahey, D. W., Solomon, S., Kawa S. R., Loewenstein, M., Podolske, J. R., Strahan, S. E., and Chan, K. R.: A diagnostic for denitri-fication in the winter polar stratosphere, Nature, 345, 698–702, 1990.
Fisher, M., O’Neill, A., and Sutton, R.: Rapid descent of meso-spheric air into the stratomeso-spheric polar vortex, Geophys. Res. Lett., 20, 1267–1270, 1993.
Friedl-Vallon, F., Maucher, G., Kleinert A., Lengel, A., Keim, C., Oelhaf, H., Fischer, H., Seefeldner, M., and Trieschmann, O.: Design and characterization of the balloon-borne Michelson In-terferometer for Passive Atmospheric Sounding, Appl. Opt., 43, 3335–3355, 2004.
Geller, L. S., Elkins, J. W., Lobert, J. M., Clarke, A. D., Hurst, D. F., Butler, J. H., and Myers, R. C.: Tropospheric SF6: Observed latitudinal distribution and trends, derived emissions and inter-hemispheric exchange time, Geophys. Res. Lett., 24, 675–678, 1997.
Greenblatt, J. B., Joost, H. J., Loewenstein, M., et al.: Tracer-based determination of vortex descent in the 1999/2000 Arctic winter, J. Geophys. Res., 107, 8279, doi:10.1029/2001JD000937, 2002. Hall, T. M. and Plumb, R. A.: Age as a diagnostic of stratospheric
transport, J. Geophys. Res., 99(D1), 1059–1070, 1994.
Hall, T. M. and Waugh, D. W.: Influence of nonlocal chemistry on tracer distributions: inferring mean age of air from SF6, J.
Geophys. Res., 103(D11), 13 327–13 336, 1998.
Haynes, P. H., Myers, C. J., McIntyre, M. E., Shappard, T. G, and Shine, K. P.: On the downward control of extratropical diabatic circulations by eddy-induced mean zonal forces, J. Atmos. Sci., 48, 651–678, 1991.
H¨opfner, M., Oelhaf, H., Wetzel, G., Friedl-Vallon, F., Klein-ert, A., Lengel, A., Maucher, G., Nordmeyer, H., Glatthor, N., Stiller, G., von Clarmann, T., Fischer, H., Kr¨oger, C., and Deshler, T.: Evidence of scattering of tropospheric radiation by PSCs in mid-IR limb emission spectra: MIPAS-B observa-tions and KOPRA simulaobserva-tions, Geophys. Res. Lett., 29(8), 1278, doi:10.1029/2001GL014443, 2002.
Huret, N., Pirre, M., Hauchecorne, A., Robert, C., and Catoire, V.: On the vertical structure of the stratosphere at mid-latitude during the first stage of the polar vortex formation and in the polar region in the presence of a large mesospheric descent, J. Geophys. Res., in press, 2006.
Khalil, M. A. K. and Rasmussen, R. A.: Carbon monoxide in the earth’s atmosphere – Indications of a global increase, Nature, 332, 242–245, 1988.
Khalil, M. A. K. and Rasmussen, R. A.: Global increase of atmo-spheric molecular hydrogen, Nature, 347, 743–745, 1990. Kleinb¨ohl, A., Kuttippurath, J., Sinnhuber, M., Sinnhuber, B.-M.,
K¨ullmann, H., K¨unzi, K., and Notholt, J.: Rapid meridional transport of tropical airmasses to the Arctic during the major stratospheric warming in January 2003, Atmos. Chem. Phys., 5, 1291–1299, 2005,
SRef-ID: 1680-7324/acp/2005-5-1291.
Kondo, Y., Koike, M., Engel, A., Schmidt, U., M¨uller, M., Sugita, T., Kanzawa, H., Nakazawa, T., Aoki, S., Irie, H., Toriyama, N., Suzuki, T, and Sasano, Y.: NOy–N2O correlation observed inside
the Arctic vortex in February 1997: Dynamical and chemical effects, J. Geophys. Res., 104, 8215–8224, 1999.
Kouker, W., Beck, A., Fischer, H., and Paetzold, K.: Downward transport in the upper stratosphere during the minor warming in February 1979, J. Geophys. Res., 100, 11 069–11 084, 1995. Kouker, W., Offermann, D., K¨ull, V., Reddmann, T., Ruhnke, R.,
and Franzen, A.: Streamers observed by the CRISTA experi-ment and simulated in the KASIMA model, J. Geophys. Res., 104(D13), 16 405–16 418, 1999.
Labitzke, K.: Temperature changes in the mesosphere and strato-sphere connected with circulation changes in winter, J. Atmos. Sci., 29(4), 756–766, 1972.
LeTexier, H., Solomon, S., and Garcia, R. R.: The role of molecular hydrogen and methane oxidation in the water vapor budget of the stratosphere, Quart. J. Roy. Meteor. Soc., 11, 281–295, 1988. L´opez-Valverde, M. A., L´opez-Puertas, M., Remedios, J. J.,
Rodgers, C. D., Taylor, F. W., Zipf, E. C., and Erdman, P. W.: Validation of measurements of carbon monoxide from the Improved Stratospheric and Mesospheric Sounder, J. Geophys. Res., 101, 9929–9955, 1996.
Maiss, M. and Levin, I.: Global increase of SF6observed in the
atmosphere, Geophys. Res. Lett., 21, 569–572, 1994.
Matsuno, T.: A dynamical model of the stratospheric sudden warm-ing, J. Atmos. Sci., 28, 1479–1494, 1971.
Moreau G., Robert, C., Catoire V., Camy-Perret, C., Huret, N., Pirre, M., Pomathiod, L., and Chartier, M.: SPIRALE: A mul-tispecies in situ balloon-borne instrument with six tunable diode laser spectrometers, Appl. Optics, 44, 5972–5989, 2005. M¨uller, R., Crutzen, P. J., Grooß, J.-U., Br¨uhl, C., Russell, J. M.,
Gernandt, H., McKenna D. S., and Tuck, A. F.: Severe chemical ozone loss in the Arctic during the winter 1995–96, Nature, 389, 709–712, 1997.
M¨uller, R., Schmidt, U., Engel, A., McKenna, D. S., and Proffitt, M. H.: The O3/N2O relation from balloon-borne observations as a measure of Arctic ozone loss in 1991/92, Q. J. R. Meteorol. Soc., 127, 1389–1412, 2001.
Naujokat, B. and Grunow, K.: The stratospheric Arctic winter 2002/03: balloon flight planning by trajectory calculations, Pro-ceedings of the 16th ESA Symposium on European Rocket and Balloon Programmes and Related Research, St. Gallen 2003 (ESA SP-530), 421–425, 2003.
Petzold, K.: Dynamik der Stratosph¨arenerw¨armungen , Promet, 22, 90–96, 1992.
Plumb, R. A., Waugh, D. W., and Chipperfield, M. P.: The effects of mixing on tracer relationships in the polar vortices, J. Geophys. Res., 105, 10 047–10 062, 2000.
Plumb, R. A., Heres, W., Neu, J. L., Mahowald, N., del Corral, J., Toon, G. C., Ray, E., Moore F., and Andrews, A. E.: Global tracer modeling during SOLVE: high latitude descent and mix-ing, J. Geophys. Res., 107, 8309, doi:10.1029/2001JD001023, 2002 (printed 108(D5), 2003).
Podolske, J. R., Loewenstein, M., Strahan, S. E., and Chan, K. R.: Stratospheric Nitrous Oxide distribution in the Southern Hemi-sphere, J. Geophys. Res., 94, 16 767–16 772, 1989.
Proffitt, M. H., Margitan, J. J., Kelly, K. K., Loewenstein, M., Podolske, J. R., and Chan, K. R.: Ozone loss in the Arctic polar vortex inferred from high altitude aircraft measurements, Nature, 347, 31–36, 1990.
Ravishankara, A. R., Solomon, S., Turniseed, A. A., and Warren, R. F.: Atmospheric lifetimes of long-lived halogenated species, Science, 259, 194–199, 1993.
Ray, E. A., Moore, F. L., Elkins J. W., Hurst, D. F., Ro-mashkin, P. A., Dutton, G. S., and Fahey, D. W.: Descent and mixing in the 1999-2000 northern polar vortex inferred from in situ tracer measurements, J. Geophys. Res., 107, 8285, doi:10.1029/2001JD000961, 2002.
Reddmann, T., Ruhnke, R., and Kouker, W.: Three-dimensional model simulations of SF6with mesospheric chemistry, J.
Geo-phys. Res., 106, 14 525–14 537, 2001.
Reimer, E. and Scherer, B.: An operational meteorological diagnos-tic system for regional air pollution analysis and long term mod-eling, Air pollution modeling and its application IX, Proceedings of the Ninetenth NATO/CCMS International Technical Meeting on Air pollution modeling and its application, Sept., 29–Oct., 4, 1991, Crete, Greece, 1992.
Rinsland, C. P., Salawitch, R. J., Gunson, M. R., Solomon, S., Zan-der, R., Mahieu, E., Goldman, A., Newchurch, M. J., Irion, F. W., and Chang, A. Y.: Polar stratospheric descent of NOy and CO and Arctic denitrification during winter 1992–1993, J. Geo-phys. Res., 104, 1847–1861, 1999.
Rosenfield, J. E. and Schoeberl, M. R.: On the origin of polar vortex air., J. Geophys. Res., 106(D24), 33 485–33 497, 2001.
Schmidt, U., Kulessa, G., Klein, E., R¨oth, E.-P., Fabian, P., and Borchers, R.: Intercomparison of balloon-borne cryogenic whole air samplers during the MAP/GLOBUS 1983 campaign, Planet. Space Sci. 35, 647–656, 1987.
Siskind, D. E., Bacmeister, J. T., Summers, M. E., and Russell, J. M., Two-dimensional model calculations of nitric oxide transport in the middle atmosphere and comparison with Halogen Occul-tation Experiment data, J. Geophys. Res., 102(D3), 3527–3546, 1997.
Solomon, S., Garcia, R. R., Olivero, J. J., Bevilaqua, R. M., Schwartz, P. R., Clancy, R. T., and Muhelman D. O.: Photochem-istry and transport of carbon monoxide in the middle atmosphere, J. Atmos. Sci., 42, 1072, 1985.
Strunk, M., Engel, A., Schmidt, U., Volk, C. M., Wetter, T., Levin I., and Glatzel-Mattheier, H.: CO2and SF6as stratospheric age
tracers: consistency and the effect of mesospheric loss, Geophys. Res. Lett., 27, 341–344, 2000.
Volk, C. M., Elkins, J. W., Fahey, D. W., Dutton, G. S., Gilligan, J. M., Loewenstein, M., Podolske, J. R., Chan, K. R., and Gun-son, M. R.: Evaluation of source gas lifetimes from stratospheric observations, J. Geophys. Res., 102, 25 543–25 564, 1997. Waugh, D. W. and Hall, T. M.: Age of stratospheric air:
The-ory, observations, and models, Rev. Geophys., 40, 1010, doi:10.1029/2000RG000101, 2002.
Wetzel, G., Oelhaf, H., Ruhnke, R., Friedl-Vallon, F., Kleinert, A., Kouker, W., Maucher, G., Reddmann, Th., Seefeldner, M., Stowasser, M., Trieschmann, O., von Clarmann, T., and Fischer, H.: NOypartitioning and budget and its correlation with N2O in
the Arctic vortex and in summer mid-latitudes in 1997, J. Geo-phys. Res., 107(D16), 4280, doi:10.1029/2001JD000916, 2002. Woyke, T., M¨uller, R., Stroh, F., McKenna, D. S., Engel, A.,
Margi-tan, J. J., Rex, M., and Carslaw, K. S.: A test of our understanding of the ozone chemistry in the Arctic polar vortex based on in situ measurements of ClO, BrO, and O3 in the 1994/1995 winter, J. Geophys. Res., 104(D15), 18 755–18 768, 1999.
Z¨oger, M., Afchine, A., Eicke, N., Gerhard, M.-T., McKenna, D. S., M¨orschel, U., Schmidt, U., Tan, V., Tuitjer, F., Woyke, T., and Schiller, C.: FISH: A novel family of balloonborne and airborne Lyman-a photofragment fluorescence hygrometers, J. Geophys. Res., 104, 1807–1816, 1999.