Publisher’s version / Version de l'éditeur:
Cement Technology, 3, 1, pp. 5-14, 1972-04-01
READ THESE TERMS AND CONDITIONS CAREFULLY BEFORE USING THIS WEBSITE.
https://nrc-publications.canada.ca/eng/copyright
Vous avez des questions? Nous pouvons vous aider. Pour communiquer directement avec un auteur, consultez la
première page de la revue dans laquelle son article a été publié afin de trouver ses coordonnées. Si vous n’arrivez pas à les repérer, communiquez avec nous à PublicationsArchive-ArchivesPublications@nrc-cnrc.gc.ca.
Questions? Contact the NRC Publications Archive team at
PublicationsArchive-ArchivesPublications@nrc-cnrc.gc.ca. If you wish to email the authors directly, please see the first page of the publication for their contact information.
NRC Publications Archive
Archives des publications du CNRC
This publication could be one of several versions: author’s original, accepted manuscript or the publisher’s version. / La version de cette publication peut être l’une des suivantes : la version prépublication de l’auteur, la version acceptée du manuscrit ou la version de l’éditeur.
Access and use of this website and the material on it are subject to the Terms and Conditions set forth at
Density and porosity studies of hydrated portland cement
Feldman, R. F.
https://publications-cnrc.canada.ca/fra/droits
L’accès à ce site Web et l’utilisation de son contenu sont assujettis aux conditions présentées dans le site LISEZ CES CONDITIONS ATTENTIVEMENT AVANT D’UTILISER CE SITE WEB.
NRC Publications Record / Notice d'Archives des publications de CNRC:
https://nrc-publications.canada.ca/eng/view/object/?id=b67edfee-2bbd-4a72-b55e-8f1c8f7b8e9d https://publications-cnrc.canada.ca/fra/voir/objet/?id=b67edfee-2bbd-4a72-b55e-8f1c8f7b8e9dDensity and porosity studies of
hydrated Portland
cement
R. F.
Feldman
Research Officer, Materials Section, Division of Building Research,
National Research Council of Canada
Density and porosity studies of
hydrated Portland cement
R. F. Feldman
Research Officer, Materials Section, Division of Building Research,
National Research Council of Canada
Summary
The density and porosity of Iydrated Portland cement are usually measured using aqueous saturated solutions of
Ca(OH), as a medium on cement in the d-dried state.
However, measurements made with a comparison pycnometer using helium, and conventionally using an aqueous saturated solution of Ca(OH), and methanol show that the porosity and density values obtained using aqueous solutions are too high. The assumption that d-dried hydrated Portland cement does not retlydrate even when exposed to water is incon-ect.
The values obtained with helium and methanol as media are very similar. Measurements were made on pastes having w:c ratios of 0.4, 0.6, 0.8 and 1.0 using helium as a medium from samples dried only *om 1 1
%
r.h. to beyond d-dry. At 11%
r.h. the density values, after conection, were 2.34 g/cm3 using helium and 2.35g/cm3 using the aqueous solution. I t is concluded that the properties of d-dried hydrated cement that led to the concept of gel pores are due to paytially collapsed interlayer spaces. Gel pores as such do not exist.Density is a basic property of hydrated Portland cement. Density or its inverse, the specific volume of the hydrated products formed during the hydration of a paste, is an important factor in determining the porosity of a rigid body.
Porosity is one of the major factors in controlling the chemical resistivity and strength of cement mortars and concrete, but it is not easy to define or measure. Pores in hardened hydrated Portland cement have been defined as spaces that can be occupied by water that is evaporable a t the vapour pressure of ice a t -7g°C(l) (the d-dried state). This definition has the obvious disadvantage of including as pores some of the hydrate water that dissociates at such low pressures. I t has been shown
(2) that this water contributes mechanically to the
solid phase and should be regarded as part of it. The present definition for porosity, then, cannot be regarded as satisfactory, and to compound the problem it has become traditional to measure both density and porosity from the d-dried state using pycnometric methods, with a saturated solution of calcium hydroxide in water as the fluid. ( 3 v 4, I11
this technique, not only is an attempt being made to measure the properties of a material that is not in its normal or original state but a method is being used that changes the material during the course of measurement. Previous work c 5 9 6 , has shown that the d-dried material rehydrates during exposure to water. I n the present paper, several techniques of density measurement are used and the conditions of the samples are varied from the state before d-drying a relative humidity (r.h.) of 11% to the state beyond d-drying. I n this way it is possible to observe the changes in density and to redefine conditions for density and porosity measurements. Materials
The following materials were used.
1. Reagent grade NaCl and Ca(OH), in the form of powder and compacts. The compacts were fabricated a t various pressures to provide specimens covering a wide range of porosities. Ca(OH), has a surface area of 15 m2/g and NaCl a surface area of 0.5 m2/g determined by nitrogen adsorption.
2.
Porous silica glass in the form of broken pieces of 20 mm diameter tubing of 2 mm wall thickness. I t has a pore volume of 50% and a surface area of175 m2/g. Its average pore radius is about 25A. 3. Normal Type I hydrated cement prepared in three ways.
a Pastes were prepared in the form of 3.18 mm
diameter cylinders, mixed in vacuum ; the cylinders were placed horizontally on rotating wheels to prevent any segregation before set occurred. Specimens were prepared with water: cement (w:c) ratios of 0.4, 0-6, 0.8 and 1.0 and were allowed to cure in the wet state in rubber mem- branes for 2$ years.
b I n the second method, paste was prepared in
the same way but with a variety of admixtures. Thirteen different samples were made a t water: cement ratios of 0.5 and 0.8; hydration con- tinued for 2 years.
c The third method of preparation was by
bottle hydrating cement for
2$
years a t a water: cement ratio of 5. I n all cases the samples were dried initially to 1 1 O h r.h. In the bottle-hydratedmaterial the powder was screened through a 100-mesh sieve. Large C a ( 0 H )
,
crystals were separated, ground, and remixed with the powder. Some of the powder was made, at nine different pressures from 27.6 to 828 MN/m2, (4 000 to 12 000 lbf/in2), into compacts 1.3 mm thick and 3.18 mm in diameter.Surface areas were measured by nitrogen adsorption and were found to be 30, 55, 51 and 57 m2/g for the 0-4, 0.6, 0.8 and 1.0 w:c-ratio pastes. The value for the bottle-hydrated cement was
22
m2/g. The carbon dioxide content of all the paste samples varied between 1.8 and 2.2% by weight. The carbon dioxide content of the bottle-hydrated cement was 1%
by weight and hydration was practically complete.Methods
Three fluids were used in this work: a saturated aqueous solution of C a ( 0 H )
,,
dried methanol, and helium. With the first two, measurements were made at two conditions, at 11% r.h. before drying and a t the d-dry condition. With helium, measure- ments were made, in general, in many steps from the condition a t 11%
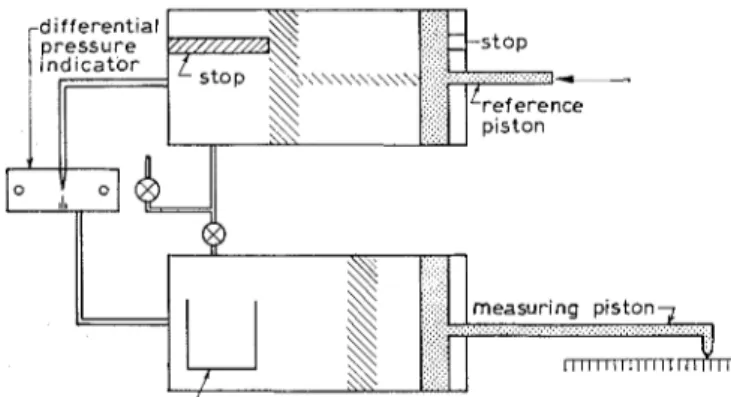
r.h. to beyond the d-dry condition. Helium comparison pycnometry (7)This technique uses the gas laws and the assumption of an ideal gas to calculate the solid volume of a sample. Where there is a high surface area and small pores, some provision has to be made for the interac- tion of the gas with the surface and for the delayed flow of gas into the small pores. Figure 1 gives a simplified illustration of the apparatus. There are two chambers, one containing the sample, and the other acting as a reference. The chambers have pistons and the reference is arranged so that on compression the volume of the chamber is exactly halved. T h e volume of the chamber with sample can also be halved by moving the piston until the pressure is doubled (from one to two atmospheres). This is done by maintaining equal pressure with the reference chamber through a differential manometer. As stated, and with certain limitations, the absolute volume of the solid can be measured and thus the Figure I : Simplijed sclzematic diagmnz of helium comparison )ycnometer.
i s a m p l e cup
density. With a known apparent volume, the porosity can be calculated.
I n the actual experiment helium was used as the fluid. This is an inert gas commonly used for dead- space measurements in adsorption isotherm deter- minations and no interaction is expected with the surface of a material. Nitrogen gas, on the other hand, gives fictitious values with materials having significantly high surface areas, because it is adsorbed during the compression of the gas to two atmo- spheres. During the experiment the sample in the chamber is evacuated for 10 min, when helium is admitted to the sample for 15 s. Pressure equali- zation and compression take a further 1 min 45 s.
The damp-dry technique
The damp-dry technique was used on d-dried samples with a saturated aqueous solution of C a ( O H ) 2 and methanol as fluids. The samples were vacuum saturated with the respective fluids and weighed while suspended in the fluid. The surface of the samples was then wiped until the sheen was just removed and rapidly weighed in air. From the difference in the above weights the volume of the sample could be calculated, and the pore volume determined from the difference between the damp- dry and dry weights. From these results, porosity on the basis of volume and density may be calculated, although high accuracy in determining density by this technique is not expected.
Sample thicknesses and diameters were measured for a large group of samples, and the sample volumes did not vary by more than 1.5% from those deter- mined by the damp-dry technique.
Weld's pycnometer
Pycnometers were used with both the aqueous saturated solution of & ( O H ) , and the methanol as fluids. T h e experiment was done at 24 & 0-1C
",
and the fluid was introduced into the bottle over the sample under vacuum conditions. This density was measured on bottle-hydrated cement in the 1 1%
r.h. condition and in the d-dry condition. T o avoid blowing the sample when the air was pumped out of the pycnometer the sample was lightly compressed into small pellets, using a pressure of 4.1 MN/m2 (600 lbf/in2).Results
Determining the density andporosity of JVaCl and Ca(OH), by helium pycnometl;y
The helium comparison pycnometer has not been widely used for porous high surface area materials. Other materials were therefore used in this work to check the technique.
NaCl and C a ( O H ) , were used largely as compacts. Figure 2 shows the relationship between the porosity (determined by the helium pycnometer) and the
Compaction pressure p s i
Figure 2 : Relationship between pore volume and compaction pressure for N a C l and C a ( O H ) , .
compaction pressure (plotted logarithmically) for the two materials. The porosity relationship of C a ( O H ) , is linear, and the porosity varied from 46 to 8 % by volume. At 8.27 MN/m2 (120 000 Ibf/in2) NaCl has been reduced to virtually zero porosity. Figure 3 shows the density results. I t is clear that for both materials there is no variation with porosity or compaction pressure.
The value for NaCl powder was also measured and is plotted on the figure at zero compaction pressure. One determination for Ca(OH), was made with the sample placed in the sample holder while a t 75°C to avoid the adsorption of any water. This operation was performed in a gloved box at a relative humidity of less than 2%. A value of 2.235 g/cm3 was obtained, and a value of 2.164 g/cm3 was obtained for NaCl. Both are close to handbook values. The conclusion is that helium enters the porous bodies rapidly, and the size of pores for the range of compacted samples presents no restriction to its rapid flow.
Determining the density ofporous glass by helium comparison and Weld's pycnometer
Porous glass was used in the experiments because it is a typical fine-pored material with a high surface area and should provide a severe test to the helium comparison method of determining density. I t has a pore volume of approximately 50% and a surface area of 175 m2/g. Its average pore radius is 25
A.
A value of 2-146 g/cm3 was obtained for porous glass that had been heated and dried in vacuum a t 175°C. Using a Weld's pycnometer and water, a value of 2.137 g/cm3 was obtained. The determina- tion of density of these high surface area materials by adsorbable liquids becomes difficult because a correction has to be made for the density of the adsorbed liquid deviating from its normal bulk density. This correction was applied in these experi- ments. I t was assumed that one monolayer had a density of 1.19 g/cm3. The agreement between the two methods was considered to be good.0 calcium hydroxide
O calcium hydroxide loaded a t 75'C
sodium chloride
E sodium chloride powder
I
Compaction pressure. p s i
Figure 3: Relatiotlship between absolute densi!g and co~npaction prcssure,fir N a C l and Ca ( O H ) ,.
Following compression, and the taking of the final reading on the helium comparison pycnometer, readings were continued for several hours. Any change in the reading was of the same order as a blank for the instrument without any material. From this and the density values it is concluded that helium flows rapidly into the 25
A
radius pores, giving a true value for the solid volume of the sample. This technique is thus adaptable to porous materials having a high surface area. Helium must be used as the fluid, and the samples should be of the thickness described.Determining the density of hydrated Portland cement using a helium comparison pycnometer
The samples of paste formed a t water: cement ratios of 0.4, 0-6, 0.8 and 1.0 and equilibrated at 1 1
%
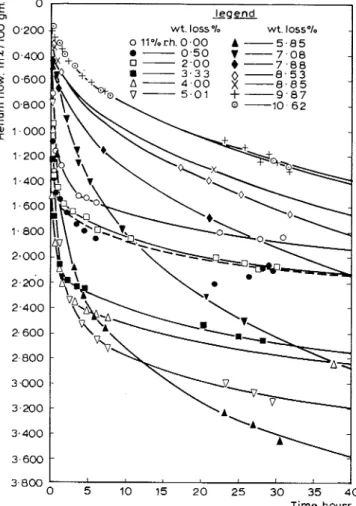
r.h. were tested in the helium comparison pycnometer. After the procedures outlined above, helium continued to flow into the samples. This flow phenomenon has been discussed in a previous paper,(9) where it was shown that the flow entered spaces
that nitrogen could not enter and that, as the samples dried from the 11
%
r.h. condition, the flow rate curves changed in character. Figure 4 illustrates these rate curves for the sample a t a w:c ratio of of 0.8 and for different moisture losses. Figure 5 illustrates the increased and decreased flow rates as water was removed from the sample.I t had previously been concluded(g) that the helium flowed into interlayer spaces partially vacated when water was removed. The further removal of water caused partial collapse. T h e data could only be explained by proposing a new model of hydrated Portland cement.(lo) I t was also shown that in the d-dry condition the collapse of the layers was not complete and that helium could enter the remaining space only very slowly. Other helium techniques had been usedc4) where the problem of the slow penetration of helium was observed, but the connection with moisture content and interlayer
2-35 legend
+
0 0 . 4 wlc std paste E.
0.6 1 1 8 1&
A 0.8 I , !# a , I 5 10 15 20 25 30 35 4 0 Tirne,hoursFigure 4 : Heliutnjlow itrto 0 . 8 w : c ratio cemetrt paste at dzyerent water contents as a ft~nction of titne.
0 1 2 3 4 5 6 7 8 9 1 0 1 1
I Wt,loss, p e r c e n t on d r y ~ n g
Figure 5 : Heliutnjlow at 5 0 minutes and 4 0 hoursplotted as afirtrctiotz of
weight loss f o r 0 . 8 w : c ratio cettzent paste.
structure was not recognized and the helium method was not pursued.
The use of the helium pycnometer allows the density to be measured before helium has entered the vacated interlayer spaces, and a consideration of this helium flow can be made by further calculation. This means that the 'solid volume' can be estimated to include or exclude vacated interlayer spaces up to a certain degree of dehydration.
The measurement of density using the solid volume obtained without considering helium flow was made
Wt. loss, p e r cent
Figure 6 : Relatiotrshil, between detzsib and weight loss for cement pastes wit11 w : c ratios of 0 . 4 , 0 . 6 , 0 . 8 and 1 . 0 .
in the following way. Helium was allowed to flow into the sample for 40 hours at n pressure of two atmospheres. The pressure was thcn reduced to one atmosphere and subsequently increased to two. From this procedure, the solid volume was determined, the value being taken from the average of five readings. I t was found, however, that taking the solid volume immediately after the first exposure to helium (i.e. taking the average of determinations 2 to 6 made immediately after the exposure of the sample to helium) gave the same value as the average of five determinations made after 40 hours exposure to two atmospheres of helium.
The densities of two series of pastes prepared at w:c ratios of 0.4, 0.6, 0.8 and 1.0 are shown in Figure 6 as a function ofwater loss from the 11
%
r.h. condition. The curve for the 0.4 w:c ratio is well below those for the 0.6, 0.8 and 1.0 w:c ratio pastes, all of which are clustered together. In general, the curves show a slight decrease in density until a weight loss of 6 to 7%, when all the samples increased in density. This is the weight loss at which a sudden collapse in the structure occurs. The density of the 0.4 w:c ratio sample was approximately 2.19 g/cm3 at a weight loss of 8.25% (approximately d-dry), while the other w:c ratios varied between approxi- mately 2-26 and 2.30 g/cm3. At the 11% r.h. condition the 0.4 w:c ratio paste was approximately 2.23 g/cm3 and the other pastes varied between 2-25 and 2.29 g/cm3. The surface area, as determined by nitrogen adsorption, was 30 m2/g for the 0.4 w:c ratio paste and approximately 55 m2/g for the other pastes. Beyond a 3% loss of weight from the 1 1%
r.h. condition, the scatter of experimental points was not great and may be attributed to the slower rate of helium flow at these water losses.At each point on the curves of Figure 6, helium flow rate curves were obtained up to 40 hours. The volume of helium flowing in at 40 hours was sub- tracted from the solid volume obtained during the
E 0, >, C .- n 0 0 . 4 w l c s t d p a s t e 0.6 n I 1 V 0.8 u r r A l . 0 l I I I 2.30 0 L O , , , , , ,
,
, , , ,I
0 1 2 3 4 5 6 7 8 9 1 0 1 1 1 2 W t loss p e r c e n tFigure 7 : Relationshil betrueen density (corrected for helium i~$ozu) artd weight loss,for cerneritpastes with ru:c ratios of 0.4, 0.6, 0.8 and 1.0.
0 adsorbed w a t e r
X interlayer water
sheets of C - S
h e 1 i u m a n d methanol s a t aqueous calcium
h y d r o x i d e solution
A-(d-dry)
{
-
1
8-( d-dry)Figure 8 : Scl~err~atic models for densib calc~tlatio~~s in Table I .
determination of density and a new diagram of density against weight loss plotted for one set of pastes, with w:c ratios of 0.4, 0-6, 0.8 and 1.0. These curves (Figure 7) show increasing densities with weight losses up to 5 to 6%. This is equivalent to 2.30 to 2.41 g/cm3 for the 0.4 w:c ratio paste and approximately 2.34 to 2-45 g/cm3 for the other pastes. Beyond a weight loss of 6% the density decreases abruptly down to 2.31 g/cm3 for the 0.4 w:c ratio paste and 2.34 to 2-38 g/cm3 for the other pastes. The decrease in density is a manifestation of the collapse of the layers, thus 'trapping' space
vacated by water that cannot be penetrated by helium in 40 hours.
The fact that the layers do not collapse completely and that space is trapped has been demonstrated.(g) It has also been observed (Figure 4) that the flow curves flatten out to the same rate as a blank for samples with a weight loss of up to 5 to 6%. This indicates that, up to this loss, all the space vacated by water can be occupied by helium. Using the density for the 0-8 w:c ratio paste with 5.75% of water removed fi-om the 11% r.11. condition as 2.451 g/cm3 as in Figure 7, it is possible to calculate the density, excluding the interlayer spaces. A further weight loss of 2.5% would give approximately d-dry conditions, and assuming the density of this water to be approximately 1-25 g / ~ m ~ , ( ~ ) the density excluding interlayer spaces is 2.5 1 g/cm3.
Betermining density using TVeld's pycnometer
Bottle-hydrated cement was used in these measure- ments at the 11
%
r.11. and d-dry conditions: 8% by weight of water was removed to obtain the d-dry state. The three fluids were used, including helium with the comparison pycnometer, and the results are tabulated in Table 1. Values are given for each fluid and four different sets of data are shown for the 1 1%
r.11. condition. These represent corrections or different conditions, as shown in Figure 8. T h e density value is for the space in each model that is surrounded by the heavy line. Methanol and helium are represented by the same model.In Figure 8, (A) shows the uncorrected value, including adsorbed water. I t is assumed that when water is the fluid, it opens and enters the layers so that density is that for the model shown. The density of the & ( O H ) , solution was taken as 1.0006 g/cm3. The value by helium comparison is also represented and is the value without taking the subsequent helium flow into consideration. I t is assumed(g) that subsequent helium flow enters the partially dehydrated layers. Methanol gives a somewhat lower value than helium, partly because helium may enter some portion of the layers when the density value is taken. Results from the d-dry samples support this theory.
Again in Figure 8, (B) represents the situation where the density values are corrected for adsorbed water. This is based on the value of the nitrogen surface area and a computation of the quantity of adsorbed water to complete a monolayer on this area. It is assumed that the area determined by nitrogen is correct. lo' 11, 12) The volume of helium that flows in is subtracted from the solid volume (B), giving volume (C) and a higher density. This helium flow correction was applied to the methanol. It is also assumed that water that had occupied the same space had a density of 1.25 g/cm3. A correction is made for this on the result obtained by the C a ( O H ) , solution method, which gives a value of
Table 1. Densitv of bottle-hvdrated Portland cement Condition 11% r.h. Helium g/cm3 Methanol g/cm3 Saturated aqueous Ca(OH), solution g/cm3 (A) No correction (B) Monolayer adsorbed water correction (C) Helium flow taken
into account (D) Interlayer water
in helium flow space
d-dry state
1
Table 2. Pore volume and densitv of d-dried hvdrated cement Dastes determined with different fluids
(A)
-
d-dry (B)-
d-dry Calculation for layers themselves (uncorrected for free Ca (OH) ,)/
Pore volume percentage (by volume)I
Density g/cm3]
Surfacew: C
ratio
/
Helium1
WaterI
Methanol2.28 0.01 2.51 & 0.01 of paste (w: c ratio = 0.8) Helium 2.285 i 0.02
I
2.61 & 0.01 -I
2.5 1+
0.01 (i) 2.19 & 0.015 (ii) 2.19*
0.015 (i) 2.28 i 0.015 (ii) 2.26 0.015 (i) 2.30*
0.015 (ii) 2.27*
0.015 (i) 2.29 (ii) 2.26 area (N,) Methanol Water1
~
~
1
2.38 g/cm3 for (C), compared with a value of 2.37 g/cm3 by the helium method.
Alternatively, a calculation was based on model (D). For the helium method, using the solid volume of model (B) and adding the extra water the density became 2.34 g/cm3. Again, it is assumed that the space into which helium flows at 11% r.h. is inter- layer space, which retains interlayer water (with a density of 1.25 g/cm3) at a higher humidity. The same model (D) for the Ca(OH), solution method was arrived at from model (C), by adding both a volume and a weight, and density of 2-35 g/cm3 was obtained. Very close agreement is thus possible between the helium comparison and Ca(OH), solution pycnometric methods.
Results from the three techniques used on the sample in the d-dry (A) condition are also shown
(Figure 8). No correction is made for the methanol adsorbed to the surface, but this is thought to be negligible because of the small area. The similarity between the helium and methanol values is striking. I t confirms the idea that the higher value given by helium than by methanol for the 11
%
r.h. condition comes about because some helium has already flowed in when the density reading is taken. At the d-dry condition the layers have largely collapsed and helium flows in slowly. The very high value obtained using aqueous solution (1.0006 g/cm3 for density without further correction) is expected from previous work. During the pycnometric experiment, water opens and re-enters the layers and expands the material. (It had been assumed by other workers that the layers remained closed (33 41lost between the 11
%
r.h. and the dry conditions has a density of 1.25 g/cm3, the volume of the inter- layer space may be calculated and a value derived for the density, excluding the space between the layers. A value of 2.51 g/cm3 emerges, the same as for the independent calculation from helium density and flow measurements on the 0.8 w:c ratio paste. This last calculation is illustrated in Figure 8 (see (B) and d-dry). T h e calculated value does not, however, include any correction for free Ca(OH),.The porosi~y of compacts of bottle-hydrated cement
Compacts of bottle-hydrated cement covered a wide range of porosities and were thus convenient to use. All were made with the same material and had the same degree of hydration. They were d-dried before measurement. Porosities using a Ca(OH), aqueous solution and methanol were obtained using the damp-dry technique, assuming bulk values for the fluids, and by helium, using the comparison pycno- meter. The results in Figure 9 show that the poro- sities obtained with helium and methanol are very similar overthe whole range, 59 to 7% by volume. This was expected from the density results on the d-dried powder. The porosity obtained by the aqueous solution has a value of about 12% more than the others over the whole range and this becomes significant at the low porosity end: at 828 MN/m2 (120 000 lbf/in2) the porosities are 20 to 8%, respectively.
Porosities of hydrated Portland cement pastes
The results for both sets of pastes are plotted in Figure 10. Again there is a large difference between the porosities obtained with aqueous Ca(OH), and those obtained with methanol and helium. At a w:c ratio of 0.4, for example, the porosities are 37.8% for aqueous Ca(OH), and 23.3% for methanol and helium. This difference is equivalent to 8.6 cm3 per 100 g of d-dried cement. As a bulk value for the density of the fluid was used, this is 8.6% by weight of the d-dried material and compares well with the value estimated by scanning isotl~erms(~) to be the quantity of interlayer and hydrate water. Table 2 includes the porosity and density values for pastes at the d-dried condition using the different techniques. The 0-5 and 0.8 w:c ratios marked a represent the average of 13 pastes made with different admixtures. The main observations are shown clearly; namely the similarity between helium and methanol porosities and densities and their contrast with those obtained by using aqueous Ca(OH),.
Discussion
I n much previous work ('9 3p 43 11, 13, 14) where adsorption, density, porosity, surface area and other measurements were made on d-dried hydrated Portland cement, using water or aqueous solutions,
I I 1 1 1 , , 1 1 1 1 1 , , 1 0 1 1
1,000 10,000 100.000
Compaction pressure, psi
Figtrre 9: Relafionsirip belween porosip and cornpaclion pressttre for bolfle-lydraled cement.
a methanol 0 helium 10 w a t e r O ol4 I I
J
0.5 0 - 6 0-7 0 - 8 Water-cement r a t i oFi,nure 1 0 : Relalionship befweer~ porosily and
w : r ratio-for Porlland cerrzenf pasles.
it was assumed that the layers had completely collapsed and that they did not reopen on re-exposure to water vapour or liquid water.
I t is now evident that if water is used in measuring the density of the d-dried material it rehydrates, leading to the determining of an incorrect porosity or density for the hydrated cement. If this is recog- nized, however, the density of the layers themselves may be obtained by correct calculation. I n addition, in this type of measurement the porosity is con- siderably overestimated because it includes, as porosity, 'trapped space' normally occupied by interlayer water and the new space created by the water itself in re-expanding the layers. I t is evident that re-expansion due to, for example, an addition of one molecular layer of interlayer water does not cause as large an expansion as might be expected, because the collapse of the layers in the first instance is not complete.
It has been that interlayer water functions as part of the solid and that, because it is present in the normal state in which hydrated Port- land cement is used, density and porosity should
ideally be measured with it present. This is possible with the techniques and approximations now described, although more should be known about the state of the hydrate a t relative humidities higher than 11%. I n the present experiments it was assumed that at 11
%
r.h. some of the interlayer water had already been removed (this was measured by helium flow) but that it would be intact at higher humidities. I t was also assumed that a monolayer of adsorbed water is complete a t 11% r.h., and this involved the measurement of surface area by nitrogen adsorption. A calculation, using the densities obtained with helium at the 11%
r.h. and d-dry conditions, showed that an estimation of porosity by measurement of the d-dry sample, using the helium and thus the methanol technique, would be in error by less than 4% of its value. For most purposes then, it is satisfactory and simpler to measure porosity by the use of methanol 01- heliumon d-dried hydrated Portland cement.
Previous density values for hydrated Portland cement differ from those obtained in this experiment. Most measurements were made on d-dried samples. Taylor, (I5) however, published a value of 2.38 g/cm3, calculated from refractive-index measurements for C3S paste. I t appears that the ratio of water to the silica of the hydrate was 1.5, but it is not clear how the sample was dried. I n another paper ( I 6 ) values of
several badly crystallized natural specimens of tobermorite minerals are given, and none of these exceeds 2-35 g/cm3. Powers and Brownyard ( 4 ) used
a variety of fluids as displacement media on dried samples and were satisfied only with the results obtained with water, which gave a value of about 2.55 g/cm3. The results obtained with helium were in the order of those now described, but the problem of the slow penetration of helium into the structure was observed and its connection with the moisture content and layered structure was not recognized. T h e method was not -pursued. Copeland(li) deter- mined the density of the hydration products of hydrated Portland cement by a different technique, but it involved the use of the normal definition of 'evaporable water'. I t appears that this reported value of 2.51 g/cm3 is, in fact, that of the layers themselves (uncorrected for free C a ( 0 H ) ,)
.
This is in good agreement with the present work.This report confirms what recent work (99 Is) has suggested: that the concept of gel pores is not valid and that the properties ascribed to gel pores are due to the vacated interlayer spaces. I t is also clear that the use of the definition of 'evaporable water' for pore volume is unsatisfactory because it includes interlayer water.
One further point may be observed. I t had been generally assumed that the properties of hydrated Portland cement do not vary with the water-cement ratio of the preparation. Subsequently it was shown
(I9) that the ratio of calcium to silicon and the surface area by nitrogen adsorption vary with the water-cement ratio. Now it may be seen that the density also varies and that this variation appears to be related to the surface areas, as measured by nitrogen adsorption.
Conclusions
T h e following conclusions may be drawn. The density or porosity of d-dried hydrated cement cannot be measured accurately with aqueous solu- tions, which give values that are too high. The density or porosity a t 11
%
r.11. can be measured by using helium, methanol or aqueous C a ( O H ) , with appropriate corrections. An estimate of the porosity of hydrated paste can be made in the d-dried condition with helium or methanol. T h e density is not independent of water-cement ratio of t h e preparation. The properties of hydrated cement that led to the concept of gel pores are due to vacated interlayer spaces. Gel pores, as such, do not exist. T h e concept of 'evaporable water' as a measure of porosity is unsatisfactory.Acknowledgement
The author wishes to acknowledge the valuable assistance of S. E. Dods and E. G. Q ~ ~ i n n in performing most of the experi- ments.
This paper is a contribution fkom the Division of Building Research, National Research Council of Canada, and is
published with the approval of the Director of the Division.
REFERENCES
I . C O P E L A N D , L . E . A N D H A Y E S , J . C . The determina-
tion of non-evaporable water in hardened Portland cement paste. American Society for Testing and Materials. Bulletin No. 194, 1953. pp. 1-9.
2. S E R E D A , P . J . , F E L D M A N , R . F . A N D S W E N S O N , E . G .
Effect of sorbed water on some mechanical properties of hydrated cement pastes and compacts. Washington, Highway Research Board, 1966. Special Report No. 90. pp. 58-73.
3. B R U N A U E R , S., K A N T R O , D . L . A N D C O P E L A N D , L . E .
The stoichiometry of the hydration of p-calcium silicate and tricalcium silicate at room temperature. Journal of the Ameri- can Chemical Society, Vol. 80, 1958. pp. 761-767.
4. P O W E R S , T . C . A N D B R O W N Y A R D , T . L . The studies
of physical properties of hardened Portland cement paste. Journal of the American Concrete Institute Proceedings, Vol. 43, 1946-1947.
5. F E L D M A N , R . F . Sorption and length change scanning
isotherms of methanol and water on hydrated Portland cement. Proceedings of the Fifth International Symposium on Chemistry of Cement. Tokyo, 1968, Part 111, Vol. 111. pp. 53-66.
6. F E L D M A N , R . F . Assessment of experimental evidence
for models of hydrated Portland cement. T o be published. 7. V O N M E I E R - G R O L M A N , F . W . A N D D I E T R I C H , H .
The open and closed pore space in cement mortar and the influence of chemical and mineral admixtures. Zement-Kalk- Gips, No. 4, 1969. pp. 165-174.
8. H E L M U T H , R . A . A N D T U R K , D . H . Elastic moduli of
hardened Portland cement and tricalcium silicate pastes: Effect of porosity. Washington, Highway Research Board, 1966. Special Report No. 90. pp. 135-144.
9. F E L D M A N , R . F . The flow of helium into the interlayer
spaces of hydrated Portland cement paste. T o be published.
10. F E L D M A N , R . F . A N D S E R E D A , P . J . A model for
hydrated Portland cement paste as deduced from sorption- length change and mechanical properties. Materiaux et Constructions. Vol. 1, No. 6, 1968. pp. 509-520.
11. BRUNAUER, S . , ODLER, I . A N D Y U D E N F R E U N D , M .
The new model of hardened Portland cement paste. To be published.
12. F E L D M A N , R . F. A N D S E R E D A , P . J . Discussion of
'The new model of hardened Portland cement paste' by Brunauer, S., Odler, I. and Yudenfreund, M. To be published. 13. MIKHAIL, R. SH., C O P E L A N D , L. E. A N D BRUNAUER, S.
Pore structures and surface areas of hardened Portland cement pastes by nitrogen adsorption. Canadian Journal of Chemistry. Vol. 42, 1964. pp. 426-438.
14. M T K H A I L , R . S'I. A N D S E L I M , S . A . Adsorption of or-
ganic vapors in relation to the pore structure of hardened Portland cement pastes. Washington, Highway Research Board, 1966. Special Report No. 90. pp. 123-134.
15. T A Y L O R , H . F. W . Relationships between calcium
silicates and clay minerals. Clay Minerals Bulletin, Vol. 3, 1956. pp. 98-1 1 1 .
16. I-IOWISON, J . W . A N D T A Y L O R , H . F. W . A method
for the calculation of the specific gravities of calcium silicates from their refractive indices. Magazine of Concrete Research, Vol. 9, No. 25, 1957. pp. 13-16.
17. C O P E L A N D , L . E . Specific volume of evaporable water
in hardened Portland cement pastes. Journal of the American Concrete Institute Proceedings. Vol. 52, 1956. pp. 863-874.
18. V E R B E C K , G . J . A N D I I E L M U T H , R . A . Structures and physical properties of cement pastes. Fifth International Symposium on Chemistry of Cement, Tokyo, 1968. Vol. 111. pp. 1-32.
19. KANTRO, D . L., B R U N A U E R , S . A N D WEISE, C . H .
Development of surface in the hydration of calcium silicates. Solid Surfaces and the Gas Solid Interface, Advances in Chemistry Series 33. American Chemical Society, Washington,