HAL Id: hal-01123792
https://hal.inria.fr/hal-01123792v2
Submitted on 12 Dec 2013
HAL is a multi-disciplinary open access
archive for the deposit and dissemination of
sci-entific research documents, whether they are
pub-lished or not. The documents may come from
teaching and research institutions in France or
abroad, or from public or private research centers.
L’archive ouverte pluridisciplinaire HAL, est
destinée au dépôt et à la diffusion de documents
scientifiques de niveau recherche, publiés ou non,
émanant des établissements d’enseignement et de
recherche français ou étrangers, des laboratoires
publics ou privés.
Ontology matching benchmarks: generation, stability,
and discriminability
Jérôme Euzenat, Maria Rosoiu, Cassia Trojahn dos Santos
To cite this version:
Jérôme Euzenat, Maria Rosoiu, Cassia Trojahn dos Santos. Ontology matching benchmarks:
gen-eration, stability, and discriminability.
Journal of Web Semantics, Elsevier, 2013, 21, pp.30-48.
�10.1016/j.websem.2013.05.002�. �hal-01123792v2�
Ontology matching benchmarks:
generation, stability, and discriminability
✩ Jérôme Euzenata,∗, Maria-Elena Roşoiua, Cássia Trojahnb,∗∗a
INRIA & LIG, Grenoble, France
b
IRIT & UTM2, Toulouse, France
Abstract
The OAEI Benchmark test set has been used for many years as a main reference to evaluate and compare ontology matching systems. However, this test set has barely varied since 2004 and has become a relatively easy task for matchers. In this paper, we present the design of a flexible test generator based on an extensible set of alterators which may be used programmatically for generating different test sets from different seed ontologies and different alteration modalities. It has been used for reproducing Benchmark both with the original seed ontology and with other ontologies. This highlights the remarkable stability of results over different generations and the preservation of difficulty across seed ontologies, as well as a systematic bias towards the initial Benchmark test set and the inability of such tests to identify an overall winning matcher. These were exactly the properties for which Benchmark had been designed. Furthermore, the generator has been used for providing new test sets aiming at increasing the difficulty and discriminability of Benchmark. Although difficulty may be easily increased with the generator, attempts to increase discriminability proved unfruitful. However, efforts towards this goal raise questions about the very nature of discriminability. Keywords: Ontology matching, Matching evaluation, Test generation, Semantic web.
1. Introduction
Heterogeneity is inherent to open environments like the semantic web. Thus, ontology matching is very important to overcome ontology heterogeneity and many systems have been proposed for this purpose [10]. However, matching ontologies is not a deductive task for which it is possible to check if a matcher is compliant with a specification, like for SPARQL querying or OWL reasoning. Hence, evaluation of ontology matchers is of paramount importance.
Evaluating ontology matching systems may be achieved in different ways. The most common one consists of providing matchers with two ontologies and comparing the returned alignment with a reference alignment [9]. However, this raises the issue of the choice of ontologies and the validity of the reference alignments.
Since 2004, the Ontology Alignment Evaluation Initiative (OAEI)1 makes available a collection of test
sets for evaluating matching systems. One such test set is Benchmark (we use the term Benchmark with a capital B for referring to this test set). It is a well-defined set of tests in which each test is composed of two ontologies and a reference alignment. The tests are based on one particular ontology, from the bibliographic domain, and systematic alterations of this ontology, e.g., removing classes, renaming properties.
✩This paper improves over [18], in particular by providing results based on more extensive test bases and in generating
difficult and discriminant test sets. It has been thoroughly revised.
∗Corresponding author
∗∗Work performed when this author was with INRIA.
Email addresses: [email protected] (Jérôme Euzenat), [email protected] (Maria-Elena Roşoiu),
[email protected](Cássia Trojahn)
1
The Benchmark test set was designed with the aim of covering the various situations in which a matcher may be (called problem space). However, this test set can be criticised on three main aspects: (a) lack of realism: tests are mechanically generated, (b) lack of variability: it always uses the same seed ontology altered in the exact same way, and (c) lack of discriminability: the tests are not difficult enough to discriminate well matchers. While the drawback (a) has been overcome by other test sets made available by OAEI, in this paper we are particularly interested in investigating (b) and (c).
To that extent, we have developed a test generator that may be used with any seed ontology and that allows for fine tuning the input parameters, as well as randomised modifications over the ontology entities. The generator framework is extensible – it is possible to add new alteration capabilities – and flexible – it can be used through a clearly defined API to generate various kinds of tests.
This generator enables us to evaluate the relevance of the Benchmark test set: by reproducing this test set and using it to evaluate different matchers, under the same conditions, we can assess how much the obtained results were dependent on the particular seed ontology or on the particular matcher.
We ran a set of matchers on the generated tests, which sheds light on the results obtained so far with Benchmark. Concerning Benchmark, we establish that:
– Results obtained by different generations of Benchmark are very stable, i.e., their standard deviation is less than 1 percentage point on average.
– The difficulties encountered by a particular matcher at a test are preserved across seed ontologies, even if the difficulty of each test set is different.
– A bias towards the original Benchmark and its domain can be observed.
– It is not possible to identify a general order between matchers consistent across seed ontologies. These points support the initial design goals of Benchmark: to be able to identify strengths of matchers over the whole problem space and not to find which matcher is “the best one”. The last point may however be related to the lack of discriminability of the test set: matchers obtain very close scores.
Furthermore, we have extended the framework in order to generate tests of increasing difficulty and discriminability. The test generator can easily generate test sets of increasing difficulty. However, such tests do not provide increased discrimination. Increasing discrimination has proved challenging. This may be due to two main factors: matchers may be very similar, and discriminability is not precisely defined. We use the test generator to discuss and illustrate these issues.
In summary, as main contributions, this paper: – provides a very versatile benchmark generator (§3),
– uses this generator to measure meaningful properties of ontology matchers and to assess the validity of Benchmark principles and its stability (§4),
– shows how new tests may be generated on the same model for evaluating scalability, difficulty and discriminability (§5).
The remainder of the paper is structured as follows. In Section 2, we present the state-of-the-art in ontology matching test generation. Section 3 presents the architecture of our test generator and the strategy to reproduce the Benchmark test set. In Section 4, we experimentally establish properties of Benchmark using new generated test sets. Section 5 investigates different ways to use the test generator in order to generate more difficult and discriminant benchmarks. Finally, conclusions and future work are presented in Section 6.
2. Ontology matching evaluation and test generation
In this section, we briefly present the current setting of ontology matching evaluation (§2.1), the Bench-mark test set (§2.2) and its limitations (§2.3). We survey the state-of-the-art in alignment test generators (§2.4). The interested reader can find a broader overview of ontology matching evaluation in [9].
2.1. Evaluating ontology matching systems
Ontology matching [10] can be seen as an operation that takes as input two ontologies (o and o′), a set
of parameters, a possibly empty partial alignment (A′) and a set of resources, and outputs an alignment (A)
between these ontologies (Figure 1, dotted lines). A resource may be a particular lexicon used for matching terms or an ontology that may be used as an intermediate ontology between the ontologies to be matched. Parameters may be different weights put on features of the ontologies, e.g., labels, structure, instances, or switches indicating which part of the program may be activated, e.g., for fast computation or for emphasising recall.
In this paper, a matcher is a particular program performing the ontology matching operation together with its resources and parameters, so it is always the exact same piece of program run under the same conditions.
An alignment can be defined as a set of correspondences. A correspondence between two ontologies o and o′ is a triple he, r, e′i, such that e is an entity belonging to the first ontology, e′ is an entity belonging
to the second ontology, and r is a relation, e.g., equivalence or subsumption, between them.
o′ o matcher A R evaluator m Test generator
Figure 1: Test generation (plain lines), ontology matching (dotted) and evaluation (dashed). The test generator provides two ontologies (o and o′) and a reference alignment (R). The matcher outputs an
alignment (A) that the evaluator compares to the reference alignment in order to compute a measure (m). A matcher can be evaluated by comparing its output alignment (A) with a reference alignment (R) using some measure (Figure 1, dashed lines). Typical measures are precision, recall and F-measure [9]. Thus, in order to evaluate a matching system, one has to generate test sets in which a test is composed of two ontologies to be matched (o and o′) and a reference alignment (R). The test generation considered here
starts with a seed ontology (o) for which the test generator provides both an altered ontology (o′) and the
corresponding reference alignment.
In order to abstract from actual ontology matching problems, we distinguish between the problem space, the solution space and the alteration space. The problem space corresponds to the space of various manifes-tations of ontology heterogeneity which require matching ontologies. The solution space defines the space of ontology matching problems that can be solved by matchers. The alteration space is a space of ontology matching problems that may be obtained by altering ontologies (as in Figure 2). We use the term space be-cause these situations are not unrelated and their proximity is expected to be meaningful. This is illustrated in §3.4.
2.2. The Benchmark test set
The Benchmark test set aims at assessing the strengths and the weaknesses of matching systems, de-pending on the availability of ontology features, i.e., the availability of instances, properties or labels in the ontology. This test set has 111 tests, requiring to match an ontology written in OWL-DL with another one: – Tests 1xx - compare the original ontology with itself, a random one and its generalisation in OWL-Lite. – Tests 2xx - compare the original ontology with the ontology obtained by applying the following set of
203 208 209 210 204 201-2 205 206 207 251-2 249-2 250-2 248-2 252-2 202-2 230 231 259-8 259 266 260-4 260-6 260-8 254 262 260-2 251-4 258-2 251-6 258-4 251 258 260 265 240 261-2 247 261-4 252-8 252 261-8 261 248-4 253-2 254-2 248-6 253-4 254-4 262-2 202-6 250-8 248-8 251-8 249-8 202-8 254-8 250 249 258-8 248 257-8 253-8 202 225 228 239 233 236 259-2 249-4 257-2 259-4 249-6 257-4 259-6 254-6 253-6 262-4 262-8 250-6 261-6 257-6 262-6 202-4 252-6 258-6 237 246 253 250-4 257 238 252-4 201-4 241 201 101 222 221 224 223 232 201-6 201-8
Figure 2: The Benchmark semi-lattice – the higher the test in the hierarchy, the easier it is. Dashed lined tests were not generated in the experiments reported here (see §4).
– names (naming conventions: synonyms, random strings, different generalisations, translation into other language),
– comments (no comment),
– hierarchy (flattened hierarchy / expanded hierarchy / no specialisation), – instances (no instance),
– properties (no property, no restriction), – classes (flattened classes / expanded classes).
– Test 3xx - compare the original ontology with real ones found on the web.
Since 2004, Benchmark has been generated from the same seed ontology through the same set of XSLT stylesheets. This means, in particular, that no random modification is applied to these ontologies: the same 20% of classes are renamed and this renaming is always the same, i.e., “editor” is always renamed as “dzajj”. This has advantages for studying the evolution of the field, because the test is strictly the same, but it has drawbacks as well, because the alterations are known in advance by evaluation participants.
2.3. Benchmark limitations
The Benchmark test set can be criticised on three main aspects:
Lack of realism Benchmark is not realistic because it covers a whole systematic alteration space and, in reality, a matcher is not faced with such a space.
Lack in variability Benchmark is always the same test set, hence it is not variable. This covers three slightly different kinds of problems: (a) it can only be used with one seed ontology, (b) it always applies the same transformations (to the same entities), instead of applying them randomly, and (c) it is not flexible in the sense that it is not possible to produce an arbitrary test (such as 12% renaming, 64% discarding properties).
Lack of discriminability Benchmark seems, in general, easy enough to OAEI participants so that it does not really allow them to make progress and it is not discriminant enough to compare them [13]. This is because many of the proposed tests are easy and only a few of them are really difficult.
Our goal is to address variability and discriminability by producing a test generator (a) independent from the seed ontology, (b) with random modifications, and (c) which allows for fine tuning parameters in order to cover the alteration space with any precision. With such a test generator, it is also possible to generate different tests than Benchmark, focusing on particular application profiles or particularly difficult cases.
We do not address the lack of realism because Benchmark has been designed to cover the problem space and not to offer one realistic profile. One may argue that we currently consider an alteration space, instead of a problem space, and that the term “problem space” assumes some realism, i.e., that these problems actually occur. This is right, but this alteration space is our attempt to cover the problem space, and not to represent the problem space itself. Other initiatives, such as other tracks of OAEI and other generators, address the realism issue [2, 9].
Some general purpose requirements for semantic web knowledge-based system benchmarks are scalabil-ity, openness to new participants, platform independence, meaningful metrics, and reproducibility [14]. These criteria are those which are targeted by a new Benchmark generation: having a variable and flexible test generator allows for scalability and reproducibility (as will be shown in §4); using standardised input and output formats ensures openness; platform independence is the goal of both the test generator and the SEALS platform2; finally, we think that §4 shows that Benchmark indeed measures permanent and
meaningful properties of matchers.
Moreover, five properties were found essential (though not exhaustive, but good enough) for ontology matching evaluation test sets [13]. These are: complexity: that it is hard for state-of-the-art matching sys-tems; incrementality: that it is effective in revealing weaknesses of the state-of-the-art matching syssys-tems; discriminability: that it discriminates sufficiently among the various matching solutions; monotonicity: that the matching quality measures calculated on the subsets of the test set do not differ substantially from the measures calculated on the whole test set; and correctness: that it can be considered as a correct tool to support the improvement of matching solutions.
Of those, complexity, incrementality and discriminability resort to what we identified as lack of difficulty and discriminability. Later (§5), we will consider both discriminability and difficulty in an incremental way. Monotony is not sufficiently precisely defined for qualifying. Obviously, if a test set like Benchmark offers various configurations, it will not be monotonous with any subset. However, we will show in §4 that Bench-mark is indeed monotonous in different ways. Finally, under this informal definition of correctness, there are good reasons to consider Benchmark as “correct” (it is widely used by matcher developers, participating or not to OAEI).
Three different properties have also been considered [2]: consistency: each test should evaluate a particular feature; completeness: there is a test for any (important) feature; and minimality: there is no more than one test per feature. As soon as a combination of alterations can be considered a feature, Benchmark can be considered as following these rules.
2.4. Related work
Many efforts took inspiration from the original OAEI Benchmark in generating test sets through al-teration. Both IIMB [11] and ONTOBI [25] benchmarks have been developed for testing instance-based ontology matching systems. On the basis of Benckmark-like tests, they add a large amount of instances based on external sources (the internet movie database or wikipedia data). These efforts publish the resulting test set and not the generator.
The Swing approach [12], based on the experience of IIMB, is a further effort to generate instance matching test sets. Swing classically distinguishes between the TBox, i.e., the vocabulary, and the ABox, i.e., the data. It works in two steps: a data acquisition step collects data to be matched and induces a TBox from this data. It then adds expressiveness to this TBox both automatically and manually. In the test generation step, from that ontology which remains the same over all tests, different ABoxes (test cases)
2
are generated by altering data values, e.g., token addition, name style abbreviation, changing data format or number format, and properties, e.g., adding or suppressing properties, changing property depth.
In XML schema matching, STBenchmark [1] offers a schema generator (SGen) which generates tests (pairs of schemas) by altering a source schema based on the specification of 11 scenarios (base alterators). It does not generate any reference results. The scenarios are defined through a set of input parameters which include the characteristic parameter, e.g., nesting depth, number of sub-elements, length of joint paths, the standard deviations to be applied for sampling each characteristic, and a repetition parameter. Schema instances can also be included in the generated schemas. Like Benchmark, STBenchmark uses XSLT.
XBenchMatch [7] provides a way for benchmarking schema matching systems, but is not a test generator. However, it provides a testbed involving a large schema corpus that can be used to benchmark new schema matching algorithms. It aims at providing a systematic way for analysing if a schema matching tool is appropriate in a given context. XBenchMatch takes as input sets of correspondences or integrated XML schemas produced by matchers and applies a set of metrics for evaluating the quality of the input and performance of the matching tool, for instance. XBenchMatch can be extended programmatically.
Another automatic generator inspired by Benchmark [3] takes as seed ontology a random tree which is computed using a Gaussian distribution of the number of children per node. The second ontology is obtained from the first one by applying a set of alterations, similar to the ones used in Benchmark, such as label replacement, word addition or removal in labels, node deletion and node child addition and children shuffling. Then, these two generated ontologies are used to generate alignments between them. The aim of generating the original ontology is to perform realistic tests and to allow a wider coverage of variations in their structure. The same technique has been used for testing web service matching in the geographical domain [22].
An automatic generator aiming at realism has been proposed in [20]. This generator satisfies two require-ments: (a) to generate the structure and the instances of two taxonomies, and (b) to generate an alignment between these two generated taxonomies. Both taxonomies must have a fixed size and a Boltzmann sampler is used to achieve this. The probabilistic model used ensures an equal probability of appearance of a tree having a given size. Therefore, the input data is controlled using this sampler. The number of child nodes is controlled as well. Then, the alignment between the two taxonomies is generated in a way that does not contradict the generated data. To achieve this goal, three constraints were enforced: the alignment must not introduce a cycle in the newly obtained graph (the alignment and the two given taxonomies), the alignment must not contradict the knowledge of the two taxonomies and they must not entail each other.
For directory matching, the TaxMe test set [13] is built from existing web directories with the aim of providing large scale and realistic test sets for matching evaluation. However, this test set only contains a subset of the reference alignment and the generation mechanism matches “concepts” which are indexing documents in common. It is thus comparable to a matching technique and thus prone to bias towards similar techniques.
Table 1 compares the different work. Some of them have not been made available as generators (ONTOBI and TaxMe); some are dedicated to XML (or database) schemas (STBenchmark and XBenchMatch). Swing is dedicated to the alteration of the ABox part of the ontologies. In fact, the approach developed here is complementary to that of Swing and could take advantage of its ABox alterators. The most suitable systems for ontology matching test generation are the systems described in [3] and [20] which were not available to reuse and offer little flexibility.
In conclusion, none of the available generators is both able to generate OAEI Benchmark and go beyond it by offering the flexibility that the original Benchmark lacked as discussed in §2.3. Hence, we developed the test generator that is described hereafter.
3. A modular benchmark test generator
The OAEI Benchmark test set suffers from lack of variability and discriminability. These problems affect the relevance of Benchmark as a good basis for comparing matchers, but not for matcher developers themselves. In order to overcome these problems, we developed a test generator in Java, based on the Jena
O AEI [9] ONTOBI [25] Swing [12] STBenc hmark [1] XBenc hMatc h [7] [3] [20] TaxMe [13] This pap er
Input owl owl owl xml xml owl owl ? owl
TBox alteration √ √ √ √ √ √
ABox alteration del √ √ √ del
Variable ontology √ √ √ √ √
Extensible alterators √ √
Parameterisable alterators √ √ √ √ √ √ √
Variable pattern √ √ √
Available generator √ √ √
Table 1: Comparison of the different test generators.
API3 and integrated within the Alignment API4. We present the principles of the generator (§3.1) and illustrate them through an example of generation (§3.2). We present preliminary tests (§3.3) and show how generating a test set allows for characterising matchers (§3.4).
3.1. Generator principles
The main principle of the test generator is that, from one ontology, it can generate an altered one. The input ontology may be a regular ontology or an artificially generated one: this may be useful for generating scalability tests.
Because the alteration is known, if an input alignment is provided it can be altered in the same exact way, providing a new reference alignment. If no input alignment is given, an implicit alignment between all named entities of the input ontologies is assumed.
We designed the Alterator interface taking as input an ontology and an alignment between this ontology and the seed ontology. This module outputs an altered ontology and its alignment with the seed ontology (Figure 3). This allows for applying alterations in sequence and retrieve a test at each step.
alterator p o A o′ A′
Figure 3: Modular structure of test generators (Alterator).
Thus, extending the test generator is easy since it is sufficient to implement new alterators and to declare them to the AlteratorFactory.
Elementary alterators. Elementary alterators are implementation of the Alterator interface that apply one particular alteration to an ontology. In order to assess the capability of matchers with respect to particular ontology features, we consider the following alterations: remove percentage of classes; remove percentage of properties; remove percentage of comments; remove percentage of restrictions; remove all
3
http://jena.sourceforge.net/ontology/index.html
4
classes from a level; rename percentage of classes; rename percentage of properties; add percentage of classes; add percentage of properties; add a number of classes to a specific level; flatten a level; remove individuals. A detailed description of elementary alterators is provided in Appendix C.
Alterators may be composed and manipulated programmatically, so as to dynamically adapt the degree of alteration for instance.
Generating a test case. To modify an ontology according to a set of parameters we have defined Test-Generator as illustrated in Figure 4. It receives as input the seed ontology and the parameters which represent the alterations to be applied. The output is the modified ontology and the reference alignment. The implementation of the TestGenerator composes Alterators in a serial manner. This can produce an arbitrary test. o Ao,o o′ R p
rename classes flatten hierarchy rename properties
40% 1 100% o1 Ao,o1 o2 Ao,o2 A o,o′
Figure 4: One-shot test generation by composing alterators (TestGenerator). Subscripts on the arrows illustrate the evolution of the alignment which always refers to the input ontology (o).
Generating a test set. The test generator framework can also be used to reproduce test sets such as Benchmark. For that purpose, we designed the TestSet abstraction, in which test sets are described as applications of TestGenerator. The program will either generate all the required tests independently, by runningTestGeneratoreach time from the beginning (Figure 5), or generate them sequentially, as the initial Benchmark test set, by using a previous test and altering it further (Figure 6). In the latter case, this corresponds to selecting paths in the semi-lattice of Figure 2 which cover the whole test set.
o 258-4 258-4 254-4 254-4 202-4 202-4 rename classes 40% flatten hierarchy 1 remove instances 100% rename classes 40% flatten hierarchy 1 remove properties 100% rename classes 40%
Figure 5: Random test set generation by combining test generators (TestSet).
The proposed approach is extensible because it allows for implementing new alterators as very simple components that can be exploited in generating test sets. It is also flexible, as it can be used to generate complete test sets covering the whole alteration space with a varying degree of precision (incrementing the alteration proportion by 50% or by 2%), or more specific test sets aiming at identifying specific problems (see §5).
3.2. Example of test case generation
As an example, consider the generation of test #258-4 from the classic Bibliography ontology. Figure 7 presents a simplified view of the different generated ontologies and alignments. This test renames 40% of the classes, suppresses one class level and suppresses all instances. For this purpose, it uses four different alterators which, at each step, generate a well-identified test:
o 258-4 258-4 254-4 254-4 202-4 202-4 40% rename classes 1 flatten hierarchy 100% remove instances 100% remove properties
Figure 6: Continuous test set generation (forcing monotony) (TestSet).
Empty does not modify the ontology but generates an alignment expressing all equivalences between named entities of the ontologies. This outputs test #101 (see §2.2).
Rename classes, provided with a parameter of 40%, will randomly rename that amount of entities, in Figure 7, InProceedings is renamed into Culbrdeo and creator is renamed into ovxylty. This may affect individuals because they are described through properties and classes. The alignment is altered in the same way by renaming the same entity URIs. This outputs test #202-4.
Flatten level, with level 1 as parameter, will suppress all classes at level 1 in the hierarchy. All con-straints applying to these classes will be attached to their subclasses (which will be attached to their superclasses) and all individuals attached to these classes will remain attached to their superclasses. Correspondences involving the suppressed entities are suppressed from the alignment. This outputs test #251-4.
Remove instances, with parameter 100%, will simply suppress all individuals from the ontology. Since the individuals are not present in the alignment, nothing is changed in it (except using the URIs of the newly produced ontology). This outputs test #258-4.
3.3. Preliminary observations
Before evaluating matchers in the large, we proceeded with a preliminary evaluation of matchers. We report some of the observation from this first use of the test generator, because they may be useful to others. We first noted that matcher behaviour was often not monotonic with respect to the expected difficulty of tests. This did not occur in the original Benchmark because tests were generated from one another in increasing difficulty order. We validated this interpretation by adding the opportunity to generate more continuous test sets (§3.3.1). We also noticed that randomly generated tests may have variable results depending on the order in which alterators were applied and we adopted a suitable generation order (§3.3.2). 3.3.1. Random vs. continuous policies
Contrary to expected, matchers did not show a continuous degradation of their performances as more alterations were applied: it may happen that a matcher had better results at a particular test than at a less altered one. This may be caused by two different sources: (i) Matchers have a non deterministic behaviour, i.e., they use randomisation methods as do systems based on evolutionary computation. Such matchers usually find a local optimum depending on the initial alignment. So they can, by chance, return a better result to a more difficult test. Other matchers analyse the ontologies to match and run different matching components depending on their characteristics. They may have a non homogeneous behaviour because the generated ontologies have different characteristics. Finally, other matchers use resources on the web changing over time, such as search engines, so that the results are dependent of the query context. (ii) Because tests are generated independently from each others (Figure 5), it may happen by chance that a test with more alteration is easier than a test with less alteration. In the former case, matcher developers
A101,202-4 A101,251-4 A101,258-4 101 Reference creator title Misc Part author InProceedings InBook Article ≤ 1 ≤ 1 ≤ 1 a4395 author: Mädche title: Simillarity Reference Misc Part InProceedings 202-4 Reference ovxylty title Hthpyz Part kpzkmv Culbrdeo InBook Article ≤ 1 ≤ 1 ≤ 1 a4395 kpzkmv: Mädche title: Simillarity Reference Hthpyz Part Culbrdeo 251-4 Reference ovxylty title Culbrdeo kpzkmv InBook kpzkmv Article kpzkmv ≤ 1 ≤ 1 ≤ 1 ≤ 1 ≤ 1 a4395 kpzkmv: Mädche title: Simillarity Reference Culbrdeo 258-4 Reference ovxylty title Culbrdeo kpzkmv InBook kpzkmv Article kpzkmv ≤ 1 ≤ 1 ≤ 1 ≤ 1 ≤ 1 Reference Culbrdeo ≡ ≡ ≡ ≡ ≡ ≡ ≡ ≡
Figure 7: Test generation example (classes are in rounded boxes, properties are in italics, instances in rectangular boxes). The upper part shows the evolution of the ontology; the lower part that of the alignment (always between the 101 ontology and the target ontology).
are used to the behaviour of their systems, but the latter case will affect all matchers and puzzle matcher developers.
This behaviour is only observable locally, i.e., on one test set, and only for a few matchers. When averaging several test set results, matcher behaviours are, on average, continuous. However, this made difficult for tool developers to read one Benchmark test result.
We countered this effect by generating continuous tests (Figure 6) the same way as the initial Benchmark was generated. In this case, new tests are generated from previous ones with the modular architecture of the generator. However, we also observed that the averaged results are the same with either random or continuous generation (see §4.3). In the results reported below, unless stated otherwise, the results are generated randomly.
3.3.2. Modification dependencies
We observed that test difficulty may not be the same across tests supposed to have the same amount of alteration. This is explained by the dependency between alterations. For instance, if one wants to remove 60% of classes and to rename 20% of classes, three extreme cases may happen (as illustrated in Figure 8):
– rename 20% of classes and then remove 60% of classes, including all renamed classes. In this situation, the test is easier than expected because all renamed classes have been removed;
– rename 20% of classes and then remove 60% of classes, including a part of renamed classes. In this situation, the test is as hard as expected because the required proportion of the renamed classes has been removed;
– rename 20% of classes and then remove 60% of classes, without removing any of the renamed classes. In this situation, the test is harder than expected because none of the renamed classes has been removed.
easier removed classes renamed classes expected removed classes renamed classes harder removed classes renamed classes
Figure 8: Test dependency: depending on which entities are affected by changes, the test difficulty may vary.
Hence, a random disposition of parameters might reduce the really hard cases. As can be seen from the example, the nominal expected case may be restored by removing 60% of the classes before renaming 20% of the remaining ones. Therefore, we established a relevant order for parameters: remove classes, remove properties, remove comments, remove restrictions, add classes, add properties, rename classes, rename properties. In this way, we obtained the expected results. This order helps determining the paths in Figure 2 used for generating Benchmark. Such an order was not previously observed in the Benchmark test set because the value of parameters, but rename resources, was always 100%.
3.4. Characterising matchers
Benchmark has been created for characterising matchers, i.e., indicating in which situation they perform adequately. This may, of course, be obtained by running the test corresponding to the actual situation, e.g., #258-4, and compare the results of matchers. This may also be obtained by considering a more detailed view of the whole Benchmark, instead of an aggregated figure such as average F-measure. Indeed, the more natural way of doing it would be to display Figure 2 with an indication, e.g., colour, of matcher performances. This would be still uneasy to understand because there are many tests and their horizontal ordering is quite random. labels properties instances hierarchy l lp lip li ip p lph liph hil i hi phi ph h hl .99 .99 1.0 .99 .47 .47 1.0 1.0 1.0 .99 .12 .27 .78 .52 .23 1.0
Figure 9: Matcher performance display on a grid preserving as much as possible the topology of tests (left). Each cell corresponds to the availability of some features in the test (l=labels and comments, p=properties, i=instances, h=hierarchy). A sample display of F-measure (the darkest the best) generated byGroupOutput
of the Alignment API (right).
Figure 9 provides a display that synthesises the obtained results by aggregating in one cell a group of tests in which the ontologies to compare share a common set of characteristics, namely, that the same set of features has been altered [8]. Each cell is presented with a colour representing the average of the F-measure in each of these tests. The darker the cell, the better the algorithm. These diagrams are topologically correct, i.e., if a cell touches another cell on one side, they differ from only one “feature”, but not complete, i.e., it is not possible to present all these connections in a planar way.
Such diagrams may be obtained for any measure that can be rendered in colour: we use them with F-measures here.
Their use for an application developer consists of characterising the cell in the diagram which corresponds to the application data (by the presence/absence of labels, properties, instances or hierarchy) and to select the best matcher with regard to this cell.
1 2 3 4 5
6 7 8 9 10
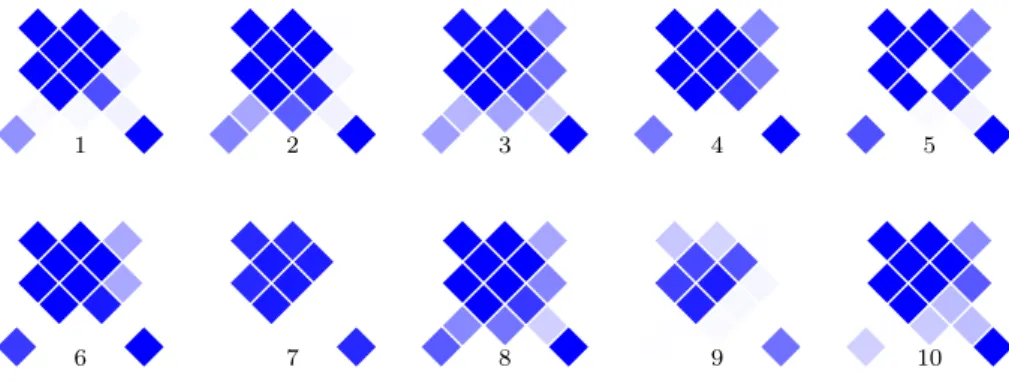
Figure 10: Matcher F-measure signature on the bibliography benchmark (matchers are those presented in §4).
For instance, Figure 10 displays the grid for each matcher that will be considered below on the newly generated Benchmark test set. It seems that matcher 7 is only able to provide results if labels are preserved and is not useful otherwise. It is also surprising that matcher 5 works incorrectly when nothing has been altered. In fact, only in this case and only for biblio, this matcher outputs peculiar results which are syntactically incorrect. Finally, it seems that matcher 8 is better at compensating the alteration of both instances and labels than matcher 4 or 6.
4. Benchmark assessment
In order to test the validity of Benchmark principles, we used the test generator to reproduce it with different characteristics. Then, we used 10 different matchers in order to compare the results obtained with the different tests.
Our goal was to explore the properties of Benchmark with respect to what they measure. All our results are given with respect to F-measure. We used F-measure because, given the number of evaluation modalities (random/continuous, four test sets, difficulty, etc.), considering both precision and recall would have complexified the analysis. In particular, the strategy of matchers with respect to trading recall in favour of precision does not help having an independent analysis. We provide in appendix and in the associated material, everything necessary for conducting the same analysis with other measures.
We presented preliminary results in [18] using a limited set of matchers, a reduced set of seed ontologies and a different set of tests. This gave different results from what we obtain now: we still observe strong robustness of results and preservation of difficulty for a matcher across test sets. However, the results allow for identifying a bias in favour of the initial Benchmark test set and the order of matchers across seed ontologies does not seem preserved.
In order to remove the possibility that the obtained results are an artefact of generated tests, we ran the tests five times for each method (continuous and random) and then we computed the average among the obtained results. Likewise, the tests are the same at each run (these tests are 101, 201-202, 221-225, 228, 232-233, 236-241, 246-254, 257-262, 265-266, so 94 tests). We decided not to reproduce the ones in which the labels are translated into another language or the ones in which the labels are replaced with their synonyms, because the corresponding alterators are not sufficiently good. The same algorithms with the same parameters have been used for all tests (the tests with the original Benchmark have been run again and restricted to these same tests).
4.1. Test sets
In order to assess the accuracy of the results obtained over the years with the Benchmark test set, we have generated new test sets from different seed ontologies with exactly the same structure and modalities, and compared the results on F-measure. These modalities were chosen because we assume that, since participants have had the opportunity to test their systems with the original Benchmark, their results may be higher on this test set.
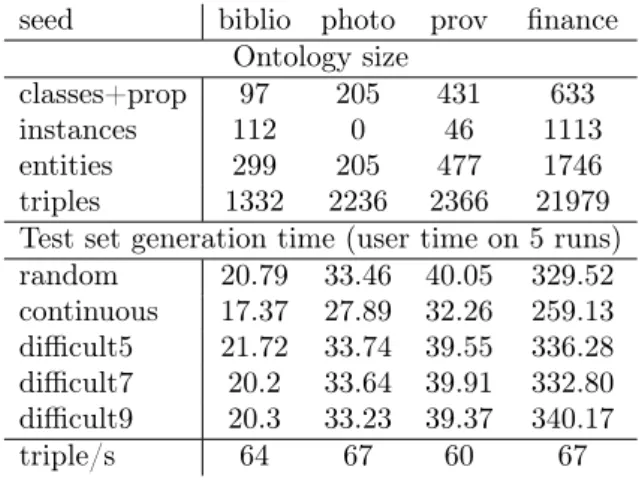
New benchmark test sets have been generated from the same seed ontology (bibliography or biblio) and different ontologies of various sizes5:
photography (photo): http://www.co-ode.org/ontolo gies/photography/photography.owl
provenance (prov): http://lsdis.cs.uga.edu/projects /glycomics/propreo/ProPreO-060506.owl
finance : http://www.fadyart.com/ontologies/data/Fi nance.owl
The characteristics of these seed ontologies are summarised in Table 2. Seed ontologies may be selected on the basis of their size, e.g., number of classes, properties, axioms, their domain, e.g., biomedical and tourism ontologies have different vocabularies, or their expressivity. The main criterion for these ones was size.
seed biblio photo prov finance Ontology size
classes+prop 97 205 431 633
instances 112 0 46 1113
entities 299 205 477 1746
triples 1332 2236 2366 21979 Test set generation time (user time on 5 runs) random 20.79 33.46 40.05 329.52 continuous 17.37 27.89 32.26 259.13 difficult5 21.72 33.74 39.55 336.28 difficult7 20.2 33.64 39.91 332.80 difficult9 20.3 33.23 39.37 340.17 triple/s 64 67 60 67
Table 2: Progression of the various test sets.
The test sets have been generated using a MacBook Pro Intel Core2Duo 2.66GHz running MacOS X.6.8 (timing performed with the Unix time command).
Table 2 shows that there is a strong constant correlation between the time taken to generate a test set and the number of triples in the test set (and not the number of entities). This is partly due to Jena which forces to go through all triples when renaming entities and when changing the namespace of entities. This performance could be improved, but the linear time is reasonable.
The continuous generation of tests needs around 20% less time than the random generation. This is a benefit of having a modular generation framework allowing for optimising the generation process (we will see in Section 4.3 that the continuous and random tests provide the same results).
4.2. Matchers
The results reported below have been achieved with 10 matchers selected for two reasons:
5
System version URL Anchor-Flood [15] - http://www.kde.ics.tut.ac.jp/~hanif/ Aroma [6] 1.1 http://aroma.gforge.inria.fr/ CSA [21] (2011) -Falcon-AO [16] - http://ws.nju.edu.cn/falcon-ao/ Lily [23] 2011-0.2 http://cse.seu.edu.cn/people/pwang/lily.htm LogMap [17] 1.0 http://www.cs.ox.ac.uk/isg/projects/LogMap/ MapEVO [4] 1.0.1 http://sourceforge.net/projects/mappso/files/ MapSSS [5] 1.1 Rimom [19] (2006) http://keg.cs.tsinghua.edu.cn/project/RiMOM/ SOBOM [24] (2009) http://gudu-yebai.appspot.com/Download.jsp
Table 3: Matchers used in the experiments.
– they were available to us, either because they participated to OAEI evaluation under the SEALS platform or because they were generally available;
– they were the fastest systems among a panel of 20 systems, allowing us to run more tests.
Incidentally, these matchers cover 3 out of the top-5 OAEI 2011 performers in terms of F-measure on Benchmark as well as matchers participating in previous OAEI campaigns. These matchers are presented in Table 3. They have been anonymised in the remainder of the paper, because our purpose is to evaluate test generation and not these systems. Systems however, keep the same numbers across all experiments.
In that sense, we will not provide individual timing of matchers. However, the time taken for running these tests evolve with the size of the test set to the extent that they can be differentiated on this basis. For bibliography, the time taken to run the 94 tests in a test set varies from 58 seconds to 48 minutes, while for finance, it varies from 9 minutes to 75 hours with different matchers being the fastest and the slowest (one matcher times out at finance).
4.3. Robustness
The first result that can be observed with the test generator is its robustness. Regardless the seed ontology and independently from the generation modality, matchers usually have the same results. All the tests reported here (but those on the original Benchmark) have been obtained over five different generations of each test. However, this is barely useful because the results always reach very close F-measure.
This applies even for non deterministic matchers which may have large variations: these variations do not show up at that level, because these F-measures correspond to the average over 94 ontology matching tasks.
Table 4 shows that the maximum variation that we observe overall on F-measure is .02 on random bibliography. We chose the maximum variation which is much larger than the standard deviation (always less than 1%). This .02 variation occurs in only one instance for bibliography and one instance for finance. If we consider it on precision or recall, the variation does not exceed .02 on random tests (see Appendix B). The continuous test sets have more variation: up to .04 in one instance on bibliography and .02 on average. The reason is that, since tests are not independent, any deviation occurring early in the test generation process will be preserved throughout the test set with little opportunity to be compensated.
The variation between random and continuous test sets is so small that it justifies that we concentrate on the random test sets.
In fact, observing large variations (.05) was a sign that something went wrong in the test execution (usually testified by error messages or by the absence of alignments). This is what happened in some of the cancelled matcher results (see Appendix B for details).
Matcher 1 2 3 4 5 6 7 8 9 10 avg biblio random .01 .00 .00 .00 .00 .02 .01 .01 .00 .01 .0 continuous .04 .02 .01 .02 .02 .01 .01 .02 .02 .01 .02 rand-cont -.03 -.02 -.01 -.02 -.02 +.01 .0 -.01 -.02 .0 photo random .00 .00 .00 .00 .01 .00 .00 .0 continuous .01 .01 .01 .00 .01 .01 .01 .01 rand-cont -.01 -.01 -.01 .0 .0 -.01 -.01 prov random .00 .01 .01 .00 .00 .00 .00 .00 .00 .00 .0 continuous .00 .01 .01 .01 .01 .00 .00 .00 .00 .00 .0 rand-cont .0 .0 .0 -.01 -.01 .0 .0 .0 .0 .0 finance random .01 .00 .01 .00 .00 .00 .00 .01 .00 .0 continuous .00 .00 .00 .00 .01 .00 .01 .00 .01 .0 rand-cont +.01 .0 +.01 .0 -.01 .0 -.01 +.01 -.01
Table 4: Maximum F-measure variation across 5 runs for the different seed ontologies. Empty results correspond to syntax errors explained in Appendix B.
4.4. Conservativeness
We noticed that the difficulties encountered by a matcher at a test are preserved across seed ontologies. What we mean is that by looking at the results, test by test, the relative performance at a test for a matcher is preserved across seed ontologies.
So, in order to assess the stability of differences across seed ontologies for a matcher, we have designed a specific indicator. It is relative to a matcher m and a set S of test sets which corresponds to test sets with the same structure generated from different seed ontologies (in our case, S contains biblio, photography, provenance and finance). The indicators are expressed with respect to a particular evaluation measure M : M (m, Ti) is the measure obtained by matcher m on test Ti. Here we consider measure for M . These
F-measures are averaged across values obtained with five independently generated tests for each seed ontology. We still do not use standard deviation because of the difficulty to read it with values between 0 and 1.
First, we define, for each particular test Ti, the average of results ASm(i) across all seed ontologies:
AS m(i) =
P
T∈SM (m, Ti)
|S|
This is a level of difficulty of a particular test (Ti) for a particular matcher (m). Then, for each test set,
we compute the average difference to this average: EmS(T ) = P|T | i=1M (m, Ti) − A S m(i) |T |
This is a signed difference: it is positive if the test set is easier and negative if it is harder. This is a theoretical measure of the test set T difficulty for a particular matcher m (relative to the others in S).
We observe on Table 5 that the ES
m values seem to induce a general agreement that photography and
provenance are harder than bibliography and finance. Indeed, no matcher, but 7, found bibliography more difficult than average, and no matcher but 9 found finance more difficult than average.
Finally, the expected value for m at a particular test Ti will be ASm(i) + ESm(T ). For measuring the
globally observed deviation that a matcher has with these expected measures, we compute: ∆Sm= P T∈S P|T | i=1|M(m, Ti) − (ASm(i) + EmS(T ))| |S| ∗ |T |
The result is a cummulative difference because of the absolute value: positive and negative differences are not compensated. A non cummulative difference (without the absolute value) would yield 0. This is a very strong measure which means that the observed value is on average at ±∆S
Matcher (m) 1 2 3 4 5 6 7 8 9 10 avg ES m(biblio) .03 .10 .03 .08 .11 .04 -.07 .04 .09 .01 .05 ES m(photo) .00 -.05 -.07 .02 -.05 .03 -.08 -.03 ES m(prov) -.03 -.15 -.05 -.05 -.07 -.07 .02 -.02 -.08 -.01 -.05 ES m(f inance) .05 .03 .04 .01 .03 .02 .03 -.04 .07 .03 ∆S m .03 .05 .05 .06 .08 .07 .02 .05 .07 .05 .05
Table 5: Conservativeness of test difficulty.
Matcher 1 2 3 4 5 6 7 8 9 10 avg 0 .76 .84 .85 .78 .84 .76 .60 .84 .40 .87 .75 continuous .76 .81 .77 .76 .84 .78 .56 .82 .37 .74 .72 0-continous .00 +.03 +.08 +.02 .00 -.02 +.04 +.02 +.03 +.13 +.03 random .75 .82 .78 .76 .84 .78 .56 .82 .37 .74 .72 0-random +.01 +.02 +.07 +.02 .00 -.02 +.04 +.02 +.03 +.13 +.03 photo .69 .63 .66 .66 .72 .25 .67 .61 0-photo +.15 +.15 +.18 -.06 +.12 +.15 +.20 +.13 prov .68 .73 .67 .60 .53 .67 .66 .74 .12 .73 .61 0-prov +.08 +.11 +.18 +.18 +.31 +.09 -.06 +.10 +.28 +.14 +.14 finance .80 .79 .70 .67 .77 .64 .79 .19 .79 .68 0-finance +.04 +.06 +.08 +.17 -.01 -.04 +.05 +.21 +.08 +.07
Table 6: Difference between results obtained through standard benchmarks (reduced to the relevant tests) and newly generated tests.
We can indeed observe the low level of difference between the observed and the expected results (∆). All the values are well below .1 variation.
This supports the observation that the results at a test set would provide a signature for a particular matcher, not in the sense that it allows for distinguishing a matcher among others – see the discussion about discriminability in Section 5.2 –, but in the sense that difficulty always evolves in the same way for that matcher.
4.5. Systematic bias
Because the original Benchmark has been used for many years with the same ontologies and public reference alignments, it is to be expected that matchers have been particularly trained for this test set.
We compared the results obtained with the original Benchmark to those obtained on newly generated test sets with the same seed ontology, either continuously or randomly, and other seed ontologies. This comparison only covers the 94 tests which are reproduced in the generated test sets (so the results are different than those already published in OAEI results).
Results are synthesised in Table 6. Two of the 10 systems (2 and 3) have many errors in their results which lowers the results they obtain on Benchmark. Only one of the systems (6) has better results on the original Benchmark than on the generated bibliography test sets. Matcher 7, as already observed in §4.4, is the only system finding the bibliography test set more difficult than the others.
These results correspond to a general bias towards the original Benchmark, since matchers obtain, nearly systematically, better results with it.
There does not seem to be an overfitting to the actual precise tests since the average difference with newly generated test sets from the same seed ontology is only .03, while with other newly generated tests, the advantage is much larger. Hence, matchers seem biased toward the bibliographic ontology rather than towards the initial Benchmark test set itself.
seed ontology 0.
F-measure
1.
biblio finance provenance photography
1 2 3 4 5 6 7 8 9 10
Figure 11: Average F-measure of each system with different seed ontologies. Seed ontologies have not been ordered by size but by average F-measure.
4.6. Order preservation
Similarly, we wanted to know if the order between matchers, in terms of F-measure, would be preserved across seed ontologies. Figure 11 shows the evolution of F-measure. Seed ontologies are ordered from the easier to the more difficult (based on average F-measure).
If globally matchers evolve in the same direction, decreasing F-measure with difficulty, the global result obtained with one seed ontology cannot be transposed to another. So, from Figure 11, the order between matchers does not seem preserved. This may be amended when considering the bias for the initial Benchmark test set. Indeed, the three other test sets provide ordered clusters of matchers (8, 2, 10, then 3, 6, 1, then 7, 5, 4 then 9). But it is very difficult to evaluate precisely this order preservation, because matcher results are often very close. This is related to the lack of discriminability between matchers. Figure 11 shows that for these tests, all the matchers evolve very closely (except for the black outlier). Hence, if one wants to draw conclusions for comparing matchers, it is necessary to use more discriminant tests.
4.7. Conclusion
This study revealed several properties of the Benchmark setting for evaluating ontology matchers: Robustness The results will be the same for a matcher across different randomly generated test sets from
the same ontology. This is also true when the test set is generated in a random or continuous way. This provides confidence in the generator and in the initial Benchmark test set.
Conservativeness Benchmark is good for studying matcher behaviour, and even relative matcher be-haviour, because matcher profiles with respect to test difficulty is preserved. Hence, independently from the seed ontology, the difficult cases for a matcher will remain the same tests.
Bias It is better to compare systems on the basis of seed ontologies different from the original one. Arguably, matchers are biased towards this particular test set or domain albeit to different extents.
Order The order between matchers is not preserved across seed ontologies. Hence, Benchmark is not good for identifying the best matcher. However, having the ability to generate a test set from an ontology allows for selecting the one suited for a particular test set.
This shows that Benchmark is indeed adequate for finding the profile of a matcher, but not for comparing matchers. Matcher comparison will depend on the particular situation, e.g., the seed ontology.
In addition, it is difficult to have a definitive judgement about the preservation of matcher order across different seed ontologies, because the tests do not allow for sufficient discrimination. Hence, we consider this problem in the remainder.
5. Difficulty and discriminability
One of the drawbacks of the initial Benchmark test set is its lack of difficulty and discriminability (§1). A new test generator allows for addressing such drawbacks in an interesting way. As mentioned, Benchmark, being focussed on paving the problem space regularly, contains many easy tests. We present here two ways to use the test generator in order to generate more difficult (§5.1) and discriminant (§5.2) test sets. 5.1. Increasing difficulty
The first way to increase difficulty has consisted of altering differently the labels in the test sets. Instead of having a regular alteration of 20, 40, 60, 80 and 100% of the labels, we decided to modify the benchmark generator so that it alters more radically the labels depending on the required test difficulty. Hence, the alteration pα(i) at level i for difficulty α is:
pα(i) = 1 − (1 − α)i
The corresponding values are given in Table 7.
i\α 0. .5 .7 .9 0 0% 0% 0% 0% 1 20% 50% 70% 90% 2 40% 75% 91% 100% 3 60% 87% 97% 100% 4 80% 94% 99% 100% 5 100% 97% 100% 100%
Table 7: Percentage of altered labels depending on each of the modalities (the first modality does not follow the pα(i) formula).
This kind of modification in the test generation process could be applied to any type of alteration (see §5.2), but this way preserves the structure of the original Benchmark, so we used it for comparison purposes. 5.1.1. Setting
We have generated three new test sets, based on the same ontologies, with three new difficulty levels (.5, .7 and .9) using the random generation modality. This has been possible by simply introducing a parameter in the BenchmarkGenerator class which generates the Benchmark test set (the implementation of Figure 5 and Figure 6).
The same matchers as above (§4.2) have been used on these tests. 5.1.2. Results
Figure 12 shows that the proposed technique indeed results in more difficult tests. All systems have decreasing F-measure as difficulty increases. This is correctly observed across all seed ontologies.
This shows that the difficulty of tests can be systematically and uniformly controlled by the test genera-tion process. However, this does not increase discriminagenera-tion: matchers remain as close as in the initial test set. Other techniques are necessary for increasing discriminability.
5.2. Increasing discriminability
Looking at results on bibliography (iteration 0 of Figure 14), it seems clear that the tests discriminate between matchers 5, 1, 10, 7, and 9. These are also clearly distinguishable from the group of matchers 6, 8, 4, 3 and 2. But among this latter group, the marchers are very close to each others. In particular, 8 and 4 are barely distinguishable. We describe a general use of the generator for increasing discriminability of a given test set.
difficulty (biblio) 0. F-measure 1. 0. .5 .7 .9 difficulty (photo) 0. F-measure 1. 0. .5 .7 .9 1 2 3 4 5 6 7 8 9 10
Figure 12: Average F-measure of each system with increasing difficulty (0., .5, .7, .9) tests on the bibliography (left) and photography (right) seed ontologies.
If we know what is discrimination between two matchers (their F-measure is at a large distance), we do not know what it is for several matchers at once. Hence, if discrimination seems a desirable property of a test set, the notion of discrimination put forward in [13] would gain in being formally defined so that we could measure that test sets indeed discriminate.
We thus designed a measure based on the spread of values which we call ideal spread distance. It is represented by the difference between the actual spread of values and a uniform spread, so for results of a set S of matchers:
isd(i) =
|S|−1X k=0
|M(ι(k), Ti) − k/(|S| − 1)|
with ι a function ordering the matchers by increasing F-measure. This value goes from |S|/2 (5 in our case) when all measures are the same to 0. when they are equi-distributed over the unit interval. The ideal spread distance is used here as a possible discriminability indicator, other definitions may be retained.
One may argue that it is possible to increase discrimination by just spreading evenly the result values to the unit interval, preserving the order. This would indeed, reduce the ideal spread distance to 0., but then (a) discrimination would be useless since it would only amplify a measure that was already available (no information gain), and (b) the obtained values would be meaningless (these would be ordinals).
This is why we try to proceed by adding new tests which are chosen on the basis of discrimination expectation and not an artificial guarantee of discrimination. The difficulty is to find such tests.
The process is the following:
1. Generate the full alteration space on all (n) dimensions with the simplest parameters: 0% and 100% alteration. This is N0= 2n tests.
2. Run a set of matchers and compute a value, e.g., average F-measure, for each tests which has no such value.
3. Select the adjacent pair of tests with the highest difference between these values, if a threshold is reached, then exit.
4. Generate an intermediate test with the following parameters: if the two tests are characterised by pa-rameter vectors hp1, . . . pni and hp′1, . . . p′ni, then generate the test with parameters h
p1+p′ 1
2 , . . . pn+p′n
2 i.
5. Optionally, complete (close) the set of tests so that for any pair of tests hp1, . . . pni and hp′1, . . . p′ni,
there exists hmin(p1, p′1), . . . min(pn, p′n)i and hmax(p1, p′1), . . . max(pn, p′n)i within the test set.
6. Go to Step 2.
Figure 13 provides an example of running such a process.
This process can itself be parameterised in several manners in addition to the seed ontology and the set of matchers:
N0= 8 1. .9 .7 .9 .6 .8 .6 0. N1= 12 1. .9 .9 .8 .7 .9 .8 .6 .8 .7 .6 0. N2= 16 1. .9 .8 .9 .8 .7 .7 .9 .8 .7 .6 .8 .7 .3 .6 0. N3= 24 1. .95 .9 .85 .8 .75 .9 .8 .7 .7 .65 .9 .85 .8 ..6 .7 .5 .6 .8 .7 .3 .6 .4 0.
Figure 13: Iterative execution of the adaptive test generation (3 iterations). Each vertex is labelled by average F-measure from which difference at each edge is computed.
– The number of dimensions;
– The type of values computed: this may be average F-measure or other measures, such as standard deviation or the difference between the highest and the lowest F-measure in the test;
– The output threshold may be a number of iterations, a maximum or minimum value for the previous measure or a global evaluation of difficulty or discriminability on the test set;
– The completion or not of the test set;
– The continuous or random generation of the new tests. 5.2.1. Setting
Such an adaptive process can be implemented with the given test generation architecture. The difficulty of this particular generator is that generation depends on test results. Hence it is necessary to combine generation, matching and evaluation. Although the Alignment API allows for such a combination, we implemented the computation by hand, i.e., we generated a priori all the necessary tests and used the relevant ones at each iteration.
We generated test sets of 125 tests corresponding to 5 levels of alteration on three dimension (53= 125),
already present in the initial Benchmark tests: 1. property removal;
2. comment removal; 3. label scrambling.
Five such test sets based on the bibliography seed ontology were generated. The initial iteration (0) of Figure 14 corresponds to the use of 8 tests offering either 0% or 100% alteration on each dimension. Increasing discrimination was attempted by adding new tests.
We ran the same 10 matchers as above (§4.2) on these new test sets and simulated the effect of the above process.
5.2.2. Results
The computations necessary for deciding which dimension to further develop were initially based on two different criteria:
– largest difference in the difference between the maximum and the minimum F-measure (across all systems);
– largest difference in standard deviation (between F-measures).
We compared the results obtained by selecting the dimension based on the largest value between two vertices or the largest value on average between all vertices in which the alteration matters. This provided the same result.
iteration (maxdiff) 0. F-measure 1. 0 1 2 3 iteration (stdev) 0. F-measure 1. 0 1 2 3 1 2 3 4 5 6 7 8 9 10
Figure 14: Average F-measure at different iterations of the discriminability procedures with the bibliography seed ontology when difficult tests are added on a whole dimension at once (left: with maximum difference, right: with standard deviation). Standard deviation stops after two iterations because it always selects the same dimension to further develop.
iteration (stdev) 0.
F-measure
1.
0 1 2 3 4 5 6
iteration (spread difference) 0.
F-measure
1.
0 1 2 3 4 5 6
1 2 3 4 5 6 7 8 9 10
Figure 15: Average F-measure at different iterations of the discriminability procedures with the bibliography seed ontology when difficult tests are added one by one (left: with standard deviation; right: with the spread difference measure).
In each case, we iterated three times. In most cases, the selected dimension was the label scrambling dimension.
The results, provided in Figure 14, show that this approach does not allow us to discriminate much more the matchers than the initial tests. The ideal spread distance of the initial state (iteration 0) is 2.78, the resulting values for maxdiff and stdev are respectively 2.94 and 2.72. Hence the proposed procedure does not succeed in significantly increasing discrimination.
We tried to directly use the ideal spread distance in order to identify the most promising dimension to develop. Indeed, it is possible to compute the ideal spread distance for any single test and when the difference between this measure is high for two adjacent tests, an intermediate test may raise the overall spread. When applying the ideal spread distance to the tests with either 0% or 100% alteration, the obtained value is maximal (4.83) when nothing has been altered and minimal (1.65) when everything has been altered. However, there are lower values in the other generated tests.
Using the ideal spread distance with the closing modality provides comparable results to those of Figure 14 for the maximum difference criterion (left). Figure 15 displays the results of the procedure when tests are added one by one, instead of dimension per dimension (closing modality) for standard deviation and ideal spread distance difference. In both cases, the final ideal spread distance was 2.88, failing again to improve on this measure.
iteration 4 8 st.dev. 4 8 st.dev. 0 .8825 .8825 .0000 .8825 .8825 .0000 1 .8893 .8892 .0001 .8720 .8842 .0086 2 .9040 .9098 .0041 .8754 .8926 .0122 3 .8684 .8900 .0153 4 .8412 .8657 .0173 5 .8534 .8718 .0131 6 .8639 .8796 .0111
Table 8: Increased discrimination between two systems based on standard deviation by adding the single most discriminating dimension (left) or the most discriminating test (right) at each iteration.
We performed the same tests in order to better discriminate between only two matchers. In this case, using the maximum difference or the standard deviation of average F-measure gave the same results. We chose to discriminate between the two matchers with the closest average F-measure, i.e., where discrimination is needed. We obtained a better discrimination as is shown in Table 8 by the increase of average standard deviation. However, this increase in discrimination brought a difference in which system is best. When working specifically with these two systems, adding blindly the test that increases standard deviation makes that 4 has a higher F-measure than 8 at iteration 1, then 8 has a higher F-measure than 4 at iteration 2. In fact, this could change at further iterations. Similar observations were possible with the other discrimination experiments.
Indeed, modifying tests for the sole purpose of increasing discriminability does not guarantee that results are preserved. This is a problem with putting the requirement of discrimination above other requirements such as the ability to measure something. As we have already mentioned, some systems are so close to each other, not only in terms of performance but in terms of design, that discriminating between them is not informative.
6. Conclusion
In this paper we have brought three contributions to ontology matching evaluation: – an ontology alignment test generator which is extensible and flexible;
– extensive experiments with the Benchmark modality used in OAEI, showing that it indeed measures permanent properties of matchers;
– Benchmark-like tests with improved variability and difficulty.
We have developed a test generator which follows a simple modular architecture and API. This generator does not depend on the seed ontology. It allows for different modifications at each run of the program and the set of input parameters can be adjusted in order to cover the problem space with any precision. It is also extensible and flexible: it can be extended by adding new ontology alterators and it can be used for generating individual tests with controlled characteristics as well as full test sets.
This generator has been used for generating test sets on the model of Benchmark with different seed ontologies and different modalities. This largely improved the variability of generated tests. Some of these generated tests have been used in OAEI 2011. From these new generated test sets, we have been able to assess (a) the robustness of evaluation results which remains the same for differently generated test sets and (b) the preservation of the relative difficulty across test sets generated with different seed ontologies. On the other hand, we also identified (c) an apparent bias towards the initial Benchmark test set and seed ontology, and (d) a poor preservation of the order between matchers across seed ontologies.
These observations confirm that the Benchmark test set is suited for finding the strengths and weaknesses of matchers, but not suited for ranking matchers universally. This remark may also be related to the relative
proximity of results provided by matchers at such evaluations. It may be due to the intrinsic proximity of matchers or to the lack of discriminability of the proposed test sets.
We have used the same test generator to address the problems of difficulty and discriminability by generating specifically designed test sets. This has shown that increasing test difficulty is not a problem, but increasing discriminability proved to be more difficult than expected. Indeed, improving discriminability through the addition of new tests in a test set would require a precise definition of what is expected, which would lead to a practical evaluation measure. All those that we tried (standard deviation, maximum span, average distance) did not provide convincing results.
Moreover, discrimination, taken as an absolute property may lead to twist results so that they dis-criminate more instead of providing an objective assessment of matcher quality. Hence, we think that discriminability should not be taken as an absolute criterion for test sets. It is more important to have test sets providing meaningful and interpretable results than discriminant ones.
In conclusion, a test generator as the one presented in this paper is a valuable tool for introducing variability in benchmarks. In addition, assessing the properties of generated tests is important to understand what is evaluated and exposing benchmarks to critical discussion. This can be achieved theoretically or experimentally. In the latter case, a flexible test generator is precious.
This test generation framework has been used for generating new test cases OAEI 2011.5 and OAEI 20012 campaigns, focusing in particular on scalability. We also consider extending it for generating networks of ontologies instead of pairs of ontologies, and further analysing the notion of test hardness applied to the ontology matching problem.
Acknowledgements
This work has been partially supported by the SEALS project (IST-2009-238975). Appendix A. Additional material
Appendix A.1. Directory structure
In order to allow for reproducibility and result analysis, we provide the following resources: ontologies/ The seed ontologies used for generating these tests are those of §4.1.
origin/ The original Benchmark test set.
dataset/seed/modality/run/test The different generated test sets (onto.rdf and refalign.rdf) and results provided by matchers: seed is the ontology name, modality is one of benchmark, continuous, disc, difficult5, 7, or 9, run is the number of the generated test set (0 is the initial bibliography test), and test the particular test number.
results/ The results computed and aggregated (in LaTeX, html and as spreadsheets). Various scripts for regenerating or manipulating these data are also available.
These test sets and results are available at ftp://ftp.inrialpes.fr/pub/exmo/datasets/bench2012. zip(the zip file is around 700MB).
Appendix A.2. Test generation
The test generator for generating new independent test sets is available in the Alignment API 4.3 (http: //alignapi.gforge.inria.fr).
Tests may be generated from command lines with the following script:
#!/bin/sh
JAVALIB=/Java/alignapi/lib JAVA=/usr/bin/java CP=