Publisher’s version / Version de l'éditeur:
PERD/CHC Report 26-189, 1998-03
READ THESE TERMS AND CONDITIONS CAREFULLY BEFORE USING THIS WEBSITE.
https://nrc-publications.canada.ca/eng/copyright
Vous avez des questions? Nous pouvons vous aider. Pour communiquer directement avec un auteur, consultez la première page de la revue dans laquelle son article a été publié afin de trouver ses coordonnées. Si vous n’arrivez pas à les repérer, communiquez avec nous à [email protected].
Questions? Contact the NRC Publications Archive team at
[email protected]. If you wish to email the authors directly, please see the first page of the publication for their contact information.
For the publisher’s version, please access the DOI link below./ Pour consulter la version de l’éditeur, utilisez le lien DOI ci-dessous.
https://doi.org/10.4224/12340898
Access and use of this website and the material on it are subject to the Terms and Conditions set forth at
Moored Vessel Stationkeeping in Grand Banks Pack Ice Conditions
Wright, B.
https://publications-cnrc.canada.ca/fra/droits
L’accès à ce site Web et l’utilisation de son contenu sont assujettis aux conditions présentées dans le site LISEZ CES CONDITIONS ATTENTIVEMENT AVANT D’UTILISER CE SITE WEB.
NRC Publications Record / Notice d'Archives des publications de CNRC:
https://nrc-publications.canada.ca/eng/view/object/?id=7bdb1fdd-3754-4880-b1ae-ff700a67691a https://publications-cnrc.canada.ca/fra/voir/objet/?id=7bdb1fdd-3754-4880-b1ae-ff700a67691a
submitted to
The National Research Council of Canada
(on behalf of PERD Sub-Task 5.3 Oil & Gas)
PERD/CHC Report 26-189
by
B. Wright & Associates Ltd.
Canatec Consultants Ltd.
AKAC Inc.
moored vessel stationkeeping in the pack ice conditions that will be periodically encountered on the Grand Banks. In terms of scope, the report includes:
• a review of the data that is currently available about pack ice conditions on the Grand Banks and the development of relevant statistics for a number of representative locations in the region
• the definition of several representative moored vessel systems that may be used in future Grand Banks developments, including:
- the type of FPSO vessels that may be used as production platforms
- the type of tanker loading systems that may be used to offload oil from both floating and fixed production platforms
- the type of support vessels that may be available to provide as-required ice management services
• the estimation of probable ice load levels on these moored vessel systems in the pack ice conditions that are expected on the Grand Banks, based on:
- previous experiences with moored vessel stationkeeping operations in moving pack ice, and the range of full scale ice loads that have been measured - some of the model testing work that has been done on vessel stationkeeping
in simulated pack ice conditions, and one of the analytic methods that has been developed to predict ice loads
• a brief review of the advantages of moored vessel systems that are capable of operating in pack ice in terms of probable downtime reductions and improved project economics
• a summary of the type of future work that would increase current levels of confidence about conducting moored vessel stationkeeping operations in moving Grand Banks pack ice conditions
The statistics that are developed for current and potential development locations on the Grand Banks suggest that pack ice occurrences in the region are not particularly frequent, and that the characteristics of the pack ice are not particularly severe. However, certain locations on the Grand Banks do experience an average of 20 to 30 days of pack ice coverage annually, with 50 to 70 days of pack ice coverage being seen at some of the more exposed sites in extreme years. Clearly, these pack ice occurrence levels could result in substantial levels of
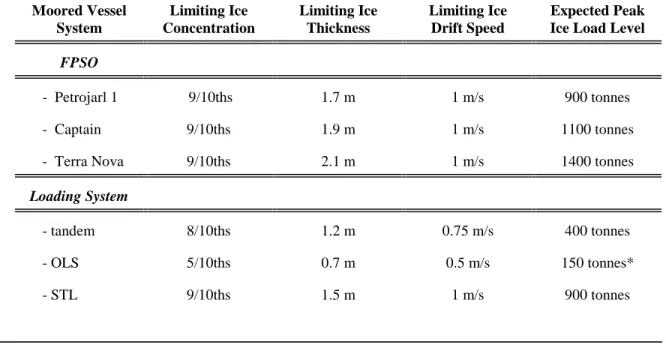
a thousand tonnes, which is well within the capability of their mooring systems. Similarly, expected ice loads during tanker loading operations on the Grand Banks should also be within acceptable levels for typical mooring and loading arrangements, again provided that these tanker loading systems have reasonable in-ice capabilities and adequate levels of ice management support. Previous full scale experiences, together with mooring load data that was obtained during operations with drillships and the Kulluk in the Beaufort Sea, are summarized and provide a strong basis for supporting the foregoing view about moored vessel stationkeeping operations and expected ice load levels in moving Grand Banks pack ice conditions. Ice model tests and analytic results are also used to provide further substantiation. However, it is also important to acknowledge that environmental conditions on the Grand Banks are unique. For example, the combination of pack ice and waves, along with the occurrence of growlers, bergy bits and small icebergs within the Grand Banks pack ice cover, will pose new challenges for moored vessel stationkeeping operations in the area. Floating development systems that are based on the use of ice strengthened vessels, capable mooring systems, and a good level of ice management support should enable stationkeeping operations in moving Grand Banks pack ice conditions, with little if any downtime. This suggests that location dependent downtimes that are caused by pack ice intrusions, which can have annual averages in the range of 20 to 30 days and annual extremes in the order of 50 to 70 days at some locations, should not necessarily be assumed for FPSO and tanker loading operations. In terms of project economics, this suggests that NPV increases in the order of $50 to $150 million may be seen because of lower pack ice downtime levels, particularly for smaller oil field developments at more exposed locations on the Grand Banks. In more direct terms, 20 to 30 days of production “uptime” for a development system that is producing 80,000 BOPD would generate additional revenues of $32 to $48 million per year, at $20/barrel. The maintenance or loss of this level of revenue is a particularly important consideration over the first few years of any development project. In addition, should an extremely bad pack ice year be encountered within the first year or two of a small development project, with ice related downtime levels of 60 days or so, the large revenue losses that could accrue would have a very adverse effect on project economics.
Further work should be done to address the question of moored vessel operations in moving Grand Banks pack ice conditions in more detail, to improve confidence levels and ensure the safety, efficiency and reliability of any “in-ice” vessel stationkeeping approach that may be selected for future developments. This work could be directed in a number of ways, including:
- more refined analytic modelling - further ice model testing
of moored vessel stationkeeping in pack ice, at least in the short term. The reason for this is that analytic modelling results will always await confirmation from full scale and model testing data. Without this type of confirmation (calibration) process, the validity of any analytic results will always be open to skepticism and ongoing debate. Further work in this area is seen as a fairly low priority at the present time, at least until a more substantial body of validation data becomes available. However, it is worthwhile staying abreast of the new analytic developments that are being made.
• further ice model testing work is warranted, as specific moored vessel concepts arise and are being evaluated. Physical model tests provide very good insights into ice interaction processes, approximate ice load levels, and moored vessel response behaviours. However, some of the limitations of ice model tests should be clearly recognized, particularly when trying to simulate managed ice conditions, along with the effectiveness of ice management support. For example, without having self propelled vessels (in model scale) that can help clear ice build-ups (including prop wash) around a moored vessel and create some looseness in the model ice, model tests will usually produce conservative results. In addition, test basin walls often have the effect of constraining the flow of broken ice pieces around a vessel, leading to ice build-ups and “under-hull ice piece movements” that are not often seen in full scale. Further model testing work is seen as a relatively high priority, but only once specific moored vessel concepts have been defined by industry for the Grand Banks, and are being evaluated. Assessments of the in-ice performance of generic moored vessel designs in model scale have some merit from an R&D perspective, but this area is considered to be outside the scope of a practical PERD study program. Again, it is worthwhile staying abreast of the results of new model testing programs that are being conducted on moored vessel stationkeeping in ice. For example, model tests are being done for tanker loading and FPSO concepts or use in areas like the Pechora Sea and the offshore Sakhalin region. These new model test results should substantiate the view that moored vessel stationkeeping operations in the relatively light pack ice conditions seen on the Grand Banks will not be particularly difficult.
• there is a considerable amount of full scale data on moored vessel stationkeeping in pack ice conditions that is currently available, over and above the information that is highlighted in this report. Although further and more detailed analyses about ice loads and effects could be carried out with this additional data, and specific case history examples could be shown to address specific concerns, the basic message
have been successfully used to support moored vessel stationkeeping operations in moving pack ice areas like the Beaufort Sea in conjunction with this full scale load data, along with their implications for the Grand Banks region, is also warranted once specific floating development systems are better defined. In addition, some thought should also be given to carrying out a more complete assessment of ice management vessel capabilities for the Grand Banks region and as importantly, the availability of suitable ice management vessels.
• the highest priority, by far, should be given to participation in any field evaluation projects that involve moored vessel stationkeeping in moving pack ice. These types of prototype (or full scale) field projects will have the largest impact in terms of confirming and/or gaining new insights into the question of ice load levels and ice interaction effects on moored vessels, and equipment and ice management support requirements. Perhaps more importantly, projects of this nature can be designed to be real demonstrations, and to provide a high degree of confidence that moored vessel stationkeeping can be effectively and safely accomplished in moving Grand Banks pack ice conditions.
There are no opportunities for moored vessel field evaluations that are immediately obvious, and it is clear that costs for this type of project will not be small. Thus, a PERD role that involves promoting this type of project within the context of an industry JIP and providing seed funding is most realistic. Examples of the kinds of opportunities that could be pursued include observations of tanker loading at the Hibernia OLS when pack ice is present, and observations of tanker loading operations around the Molikpaq in moving pack ice off Sakhalin Island. Future work initiatives that have this full scale demonstration direction are seen as providing the most benefit in terms confirming the feasibility of moored vessel stationkeeping in Grand Banks pack ice conditions, with a view to supporting the safe and economic development of future oil fields in the area.
1.0 Introduction 1
1.1 Background 1
1.2 Objectives 2
1.3 Approach 3
2.0 Pack Ice Conditions 5
2.1 General 5
2.2 Representative Locations 6
2.3 Description of Conditions 7
2.3.1 Occurrence & Coverage 7
2.3.2 Characteristics 12
2.3.3 Movements 15
2.4 Data Limitations & Needs 16
3.0 Moored Vessel Systems 18
3.1 General 18
3.2 Representative Systems 19
3.2.1 FPSO Vessels 19
3.2.2 Tanker Loading Systems 21
3.2.3 Ice Management Support 24
3.3 Key Considerations 25
3.3.1 Regulatory Requirements 25
3.2.2 Technical Issue Areas 26
4.0 Previous Experience 32
4.1 General 32
4.2 Beaufort Sea Systems 32
4.2.1 Drillships 33
4.2.2 Kulluk 37
4.3 Other Operations 47
4.4 Physical Model Tests 50
5.2.1 Moored FPSO 58
5.2.2 Tanker Loading Systems 61
5.3 Other Ice Effects 64
6.0 Stationkeeping in Grand Banks Pack Ice 65
6.1 General 65
6.2 Stationkeeping Limits 65
6.3 Downtime Levels 67
6.4 Further Work 68
7.0 Summary & Recommendations 72
1.0
Introduction
1.1
Background
Most of the development approaches that are currently being considered for moderately sized oil fields on the Grand Banks involve the use of floating production concepts, similar to the FPSO system that is now being designed for the Terra Nova project. Developments that are based on the use of bottom founded production structures, like the current Hibernia project and its GBS platform, are also under consideration but only for any large oil fields that may be found in the area in future years. All of these development approaches may, at times, require vessel stationkeeping operations in the pack ice conditions that can periodically be experienced on the Grand Banks. For example, to be effective, an FPSO vessel will have to stationkeep in a safe and efficient manner in most of the storm wave, iceberg and pack ice events that can be encountered in the area. Otherwise, related downtime could significantly impact the economic viability of the floating production approach. Although fixed production structures are much less susceptible to downtime due to these environmental influences, the tanker loading operations that will be carried out from them can be adversely effected by the occurrence of storm waves, icebergs and pack ice. From a tanker loading perspective, prolonged periods of downtime could lead to significant delays in production, depending upon the amount of storage that is available on a particular platform.
Pack ice occurrences on the Grand Banks are relatively infrequent in comparison to storm wave and iceberg events. However, the question of FPSO stationkeeping and tanker loading operations in pack ice conditions is an important issue area (Wright, 1997). Extended periods of downtime caused by the presence of pack ice on the Grand Banks could have a detrimental effect on the economics of any development project. In addition, once offshore production begins, there will be strong operational pressures to continue production in pack ice. NRC, on behalf of PERD Sub-Task 5.3, has contracted B. Wright & Associates to address the question of moored vessel stationkeeping in the moving pack ice conditions that will be periodically encountered on the Grand Banks. The results of this work, which was undertaken in association with Canatec Consultants Ltd., AKAC Inc., and Capt. P. Dunderdale of St. John’s, Newfoundland, are presented in the remainder of this report. The primary goal of this study is to demonstrate that FPSO and tanker stationkeeping should be possible in most of the pack ice conditions expected on the Grand Banks and in fact, relatively easy compared to the type of moored vessel stationkeeping operations that are now being considered for offshore developments other ice infested areas of the world.
1.2
Objectives
The primary purpose of this study is to address the question of moored vessel stationkeeping in the range of pack ice conditions that are expected on the Grand Banks. The intent of the work is to demonstrate that this type of marine operation should be considerably less difficult than is currently perceived, provided that systems with reasonable ice capabilities are used. More specific study objectives are:
• to review the information that is available regarding pack ice conditions on the Grand Banks and develop relevant statistics for a number of representative locations in the region
• to define several representative moored vessel systems that may be used in future Grand Banks developments, including:
- the type of FPSO vessels that may be used as production platforms
- the type of tanker loading systems that may be used to offload oil from both floating and fixed production platforms
- the type of support vessels that may be available to provide as-required ice management services
• to estimate probable ice load levels on these moored vessel systems in the pack ice conditions that are expected on the Grand Banks and discuss the question of in-ice stationkeeping, based on:
- previous experiences with moored vessel stationkeeping operations in moving pack ice and the range of full scale ice loads that have been measured - some of the model testing work that has been done on vessel stationkeeping
in simulated pack ice conditions and recent analytic methods that have been developed to predict ice loads
• to highlight the advantages of moored vessel systems that are capable of operating in pack ice in terms of potential downtime reductions, and the type of future work that would increase current levels of confidence about conducting these operations in Grand Banks pack ice conditions
1.3
Approach
In this study, the question of moored vessel stationkeeping in pack ice has been addressed within the context of the following Grand Banks development scenarios.
Floating Development Systems
• FPSO stationkeeping operations in moving pack ice conditions, with and without ice management support
• tanker loading operations in moving pack ice conditions from an FPSO with a tandem (ship to ship) loading arrangement, with and without ice management support Fixed Platform Developments
• tanker loading operations from a submerged loading arrangement in moving pack ice conditions, without the benefit of a protective open water wake behind a structure, with and without ice management support
• for this scenario, typical OLS (offshore loading system) and STL (submerged turret loading) systems have been used as representative examples
The work itself has been subdivided into a number of different topic areas. In the next section of this report, the range of pack ice conditions that should be expected on the Grand Banks is first reviewed, and related statistics given for typical locations in the area. Section 3 then defines several moored vessel systems that are considered to be representative for potential Grand Banks oil field developments, and highlights key in-ice stationkeeping considerations. Following this, Section 4 describes some of the full scale experiences that have been gained with moored vessels in moving pack ice, along with some typical model test and analytic results. The ice load levels that should be expected for moored vessel systems on the Grand Banks are then discussed in Sections 5, and other ice effects identified. In Section 6, probable stationkeeping limits and likely downtime levels for representative Grand Banks systems are considered, and the benefits of having the capability to stationkeep in pack ice highlighted. Although this downtime assessment reflects the implications of various model test programs and analytic models, a considerable amount of reliance has been placed on the lessons learned from full scale experiences with moored vessels in moving ice. Summary comments about moored vessel stationkeeping in Grand Banks pack ice conditions are given in Section
7, along with recommendations for related research work that would benefit the safe and economic development of oil fields in the area.
As part of this study, a considerable amount of effort has been made to discuss the question of moored vessel stationkeeping in Grand Banks pack ice conditions with various industry, government and expertise group representatives. These interactions have been an important component of the work, since they have provided a range of views about the problem area, the associated risks, and the incentives for in-ice stationkeeping operations from a variety of stakeholders. A list of the individuals who have been contacted in conjunction with this work is given below.
Individual Organization - Location
W. Spring Mobil Research & Development - Dallas
P. Clarke Petro Canada - Calgary
G. Vance Terra Nova Project - St. John’s
J. Henley HMDC - St. John’s
W. Smink Husky - Calgary
A. Knudvid Norske Hydro - Calgary
D. Blanchet Amoco - Houston
D. Burley CNOPB - St. John’s
W. Bobby CNOPB - St. John’s
B. Dixit NEB - Calgary
M. Dweyer Transport Canada - St. John’s
G. Crocker C-Core - St. John’s
T. Brown IFN Engineering - Calgary
2.0
Pack Ice Conditions
2.1
General
The Grand Banks region is generally recognized as having one of the most hostile operating environments in the world. The primary environmental constraints in this area include high waves, icebergs and sea ice, all of which have influenced the exploration approaches used to date and the design philosophies for the development systems that have been planned. Strong winds, structural icing and poor visibility are also of concern, but are more important in terms of affecting operations than influencing design. In all cases, floating ice in the form of both icebergs and pack ice, has been viewed as the key environmental constraint for Grand Banks development systems. Clearly, the presence of floating ice is the only factor that makes this region unique in comparison to most other offshore areas of the world.
Icebergs have a dominant influence on the design of Grand Banks development systems. Large icebergs are of most importance in terms of the global forces that they may exert on structures, and the potential for deep iceberg keels to damage subsea facilities. Bottom founded structures must be designed to withstand iceberg impact forces, while most floating structures must avoid them. Smaller glacial ice masses are also of concern to both fixed and floating systems, due to the high local impact loads that they can impose. Similarly, the presence of icebergs and small ice masses is an important consideration for vessels navigating or stationkeeping in the area, since interactions with them may result in structural damage. Iceberg detection, monitoring and management techniques can be used to reduce the risk of iceberg and small ice mass interactions but often, these techniques lack reliability, particularly for smaller ice masses and unstable iceberg forms. Additionally, when icebergs and small ice masses occur in combination with storm wave, pack ice and/or poor visibility conditions, ice detection, monitoring and management can be difficult.
Sea ice is also an important consideration for any development systems that will be used on the Grand Banks, since these systems will unquestionably be exposed to sea ice over typical project lifetimes. Although sea ice is not an annual occurrence on the Grand Banks, it can be advected into the area from more northerly waters, where locally formed ice and pack ice moving southwards from Baffin Bay, Davis Strait and the Labrador Sea can be found each winter. Typically, pack ice intrusions are experienced on the Grand Banks every several years, lasting anywhere from a week to a month or more. On the northern and eastern parts of the Grand Banks, these pack ice occurrences can be more frequent.
The sea ice comprising the East Coast pack is normally quite thin, in the order of 0.3 to 0.7m, and is usually not continuous in terms of its coverage. Floe sizes that vary from tens of metres to hundreds of metres in extent are typical. However, more extreme sea ice conditions can also occur, which include slightly thicker first year ice, pressure ridges and rafted ice areas, and small multi-year ice floe fragments. Icebergs and small glacial ice masses can also be contained within the East Coast’s moving pack ice cover.
Any fixed platform on the Grand Banks will have to be capable of withstanding the forces that are associated with these sea ice conditions, both globally and locally. However, these load levels are typically low compared to the design loads that are associated with iceberg impacts. Conventional floating platforms that are not ice strengthened will avoid pack ice incursions by moving off location. In the case of purpose built floating platforms, an adequate level of ice strengthening, a capable mooring system, and the use of ice management support vessels should permit stationkeeping in sea ice, but would need a high level of reliability. Clearly, ice strengthened floating systems would also require effective and reliable protection against any glacial ice masses embedded within the pack ice cover to remain on location with confidence. The occurrence of drifting pack ice will also influence other marine operations, such as tanker loading from either fixed or floating production platforms, regional ship transits, and platform resupply. However, the overall significance and consequences of pack ice encounters will depend on the design and performance characteristics of the vessels and loading systems that are employed.
2.2
Representative Locations
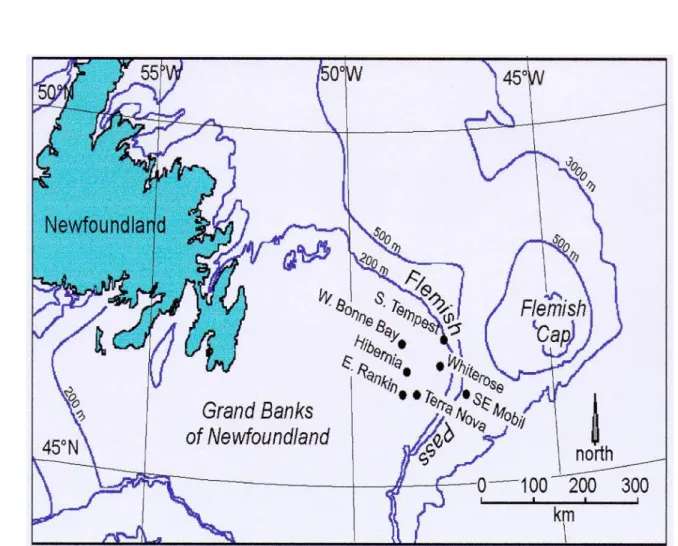
As noted earlier, pack ice occurrence frequencies are known to vary across the Grand Banks, while the influence of these pack ice occurrences will depend on the particular development system and development operation under consideration. For the purposes of this study, seven Grand Banks locations have been chosen as being representative of potential development sites in the area. These seven locations have been selected to span the acreage that is currently under lease and reflect the fact that most of the prospective development sites lie within the Jeanne d’Arc Basin, where all of the significant discoveries have been made to date. Current Grand Banks leases, along with significant oil and gas discoveries, are shown in Figure 2.1. Table 2.1 summarizes the seven representative locations that have been chosen, while Figure 2.2 gives their locations in map format. The pack ice conditions that should be expected in the Grand Banks area are reviewed in relation to these seven locations, including pack ice occurrence frequencies and characteristics. Related ice statistics are also
presented for these locations, and used to assess stationkeeping limits and possible pack ice-related downtimes for different FPSO and tanker loading systems in subsequent sections of this report.
Table 2.1: Representative Grand Banks locations selected for this study
Location Reference Coordinates
1 South Tempest area 47°10’N and 47°58’W 2 West Bonne Bay area 47°10’N and 48°50’W 3 Whiterose area 46°50’N and 48°05’W 4 Hibernia area 46°48’N and 48°50’W 5 Southeast Mobil block 46°27’N and 47°30’W 6 Terra Nova area 46°27’N and 48°’35’W 7 East Rankin area 46°27’N and 48°54’W
2.3
Description of Conditions
2.3.1 Occurrence & Coverage
The Grand Banks lies close to the extreme southern limit of the pack ice cover that forms off the East Coast each winter. As mentioned earlier, pack ice is not an annual occurrence on the Grand Banks, but can be advected into the area from more northerly waters. Source areas for the pack ice that is sometimes found on the Grand Banks include Baffin Bay, Davis Strait, the Labrador Sea, and the waters off northeast Newfoundland. As ice drifts southwards from these areas towards the Grand Banks, warmer air and water temperatures in combination with more open ocean conditions tend to dissipate the pack ice.
Regionally, the East Coast’s annual ice cycle begins in September with the formation of new ice in northwest Baffin Bay, following the near complete clearance of ice from all the areas
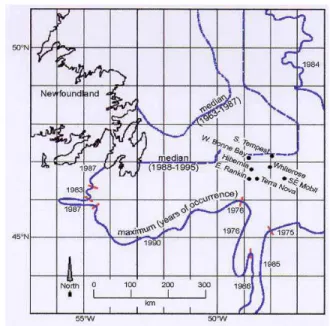
between Canada and Greenland south of 78°N each summer. A combination of local pack ice growth and predominantly southerly ice drift, driven by the prevailing northerly winds and the strong cold Baffin Current, advances the ice southwards beginning in October. Coverage increases most rapidly in western areas of Baffin Bay and Davis Strait. By December, on average, the leading edge of the advancing pack lies off the northern coastline of Labrador. In typical years, the ice edge reaches the northern tip of Newfoundland in early January and the Grand Banks in the mid-February time frame. The annual pack ice cover that is found off Newfoundland generally reaches its maximum coverage in March but can sometimes remain at high coverage levels through May and occasionally, well into June. To give some feel for the extent of this pack ice cover, median and extreme ice edge advances off Newfoundland and out onto the Grand Banks are shown in Figure 2.3 for the mid March period (Terra Nova Development Application, 1997). The environmental work that was done for the Terra Nova Development Application included an analysis of 33 years of ice charts for the Grand Banks region (1963-1995), and noted higher pack ice incursion probabilities since 1983. This coincides with a period of fairly high industry activity levels on the Grand Banks, along with improved ice reconnaissance methods (eg: satellite imagery, airborne SLAR and SAR imagery), and may reflect the increased frequency of regular good quality sea ice observations in the area. In this study, the bulk of the work that has been done to characterize representative Grand Banks pack ice conditions has been based on data for this period of more frequent high quality observations. Here, ten years of Environment Canada ice charts (1985-1994) with daily, twice-weekly and weekly publication frequencies have been used as the main data source. Information on pack ice coverage and characteristics has been extracted from these charts to provide ice statistics for the seven Grand Banks reference locations previously described.
Since the Grand Banks area lies at or near the margin of the most southerly advance of the East Coast pack, sea ice may not encroach on the region of likely development in some years. In other years, only peripheral parts of the Grand Banks will be affected, while the rest of the area will be left in open or bergy water. Overall, pack ice incursions onto the Grand Banks are limited, in time to periods from mid January to late April, in some but not all years. The historical pattern of pack ice occurrence at the Whiterose location is shown in Figure 2.4, based on the Environment Canada ice charts from 1985-1994. It may be seen that pack ice has been present at this location in 8 of 10 years, with pack ice incursions affecting the location for time periods lasting anywhere from about a week to more than a month. Over this 10 year period, higher occurrence frequencies have been seen at the South Tempest and West Bonne Bay locations, both of which lie towards the north, closer to the advancing pack. The more southerly locations typically have lower pack ice occurrence frequencies, although the southeast Mobil block shows a high frequency of pack ice presence. This location lies
in the path of a recurring “tongue” of pack ice that tends to drift southwards from the main pack ice cover. The position of this feature is consistent with a south setting current that is located between the eastern margin of the Grand Banks and the Flemish Cap (Figure 2.2). Pack ice occurrence statistics for the seven Grand Banks reference locations defined for this study are summarized in Table 2.2. In this table, the number of weeks of pack ice occurrence in any concentration are shown by year.
Table 2.2: Number of weeks of pack ice occurrence (in any concentration) by year.
Ye ar Hiberni a Terra Nova Whiterose South Tempest West Bonne Bay East Rankin SE Mobil block 199 4 4.0 1.0 3.0 3.0 4.0 1.0 5.0 199 3 1.0 1.0 5.0 11.0 6.0 0.0 5.0 199 2 0.5 0.0 0.0 5.0 2.0 0.0 1.5 199 1 1.0 0.5 1.5 4.0 5.5 0.5 1.5 199 0 6.0 3.0 6.5 6.5 6.5 3.0 6.0 198 9 0.0 0.0 0.0 2.0 0.5 0.0 0.5 198 8 0.0 0.0 0.3 0.3 0.0 0.0 0.3 198 7 1.4 0.4 1.7 1.4 2.4 0.3 1.1 198 6 1.0 0.0 0.5 4.0 2.0 0.0 2.0 198 5 6.0 2.5 5.5 8.5 8.0 1.5 6.5 Tot als 20.9 8.4 24.0 45.7 36.9 6.3 29.4
It may be seen that pack ice can cover these locations for substantial time periods, varying from a low of about 2 % of the time at locations in the south and west, to a high of nearly 9 % of the time at more exposed sites. From the perspective of development economics, pack
ice related downtimes of several percent of the time are not particularly significant, unless prolonged delays occur in the first several years of a fairly short duration project. However, downtimes approaching ten percent of the time will be of economic significance for any Grand Banks development project. The Terra Nova and East Rankin sites show significantly lower pack ice occurrence frequencies than the other five locations. From the historical ice charts, it was evident that the central and southwestern sections of the Grand Banks tend to lie in a pocket of bergy water, while the northern and eastern parts of the region often lie inside the southern boundary of the advancing pack and the southward drifting ice tongue that is seen off the Flemish Cap.
In terms of timing, pack ice has occurred on the Grand Banks as early as mid January and as late as mid April over the 1985-1994 data period, with the heaviest pack ice occurrences being in March. The manner in which the pack ice advances into the area of interest depends upon the particular year, but may be in one, two, or three distinct intrusion episodes, often separated by periods of bergy water occurrences across the region. The timing of pack ice occurrences at any one of the seven different Grand Banks reference locations over the 1985-1994 period is summarized in Table 2.3.
Table 2.3: Earliest and latest pack ice occurrences at any one of the seven reference locations. Year 1994 1993 1992 1991 1990 1989 1988 1987 1986 1985 Earlies t Feb 14 Jan 18 Feb 10 Feb 7 Feb 19 March 9 April 3 Feb 26 Feb 23 Feb 3 Latest March 21 April 19 March 23 April 22 April 9 March 20 “ March 16 April 9 April 10
In Table 2.4, the coincidence of ice thickness and ice concentration is given for each of the Grand Banks reference points over the years 1985-1994. Values are expressed as percentages of the total number of distinct weekly occurrences of pack ice at the respective locations. In years when twice-weekly or daily charts only were available, a “distinct weekly occurrence” was defined as the greatest ice concentration and greatest thickness combination occurring within consecutive ice charts totalling seven day periods. The information is presented in
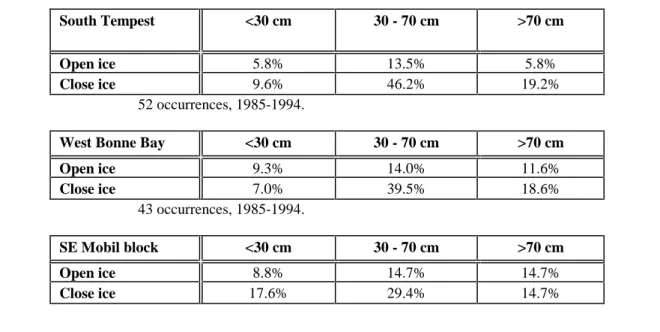
descending order of the total number of weekly pack occurrences over the ten-year ice chart record. Ice thickness levels have been reduced to three ranges that are considered most relevant for moored vessel stationkeeping operations. Concentrations have been combined to represent “open ice” (1-6/10ths concentration) and “close ice” (7-9/10ths concentration). From this table, it may be seen that ice types in the 30-70 cm range predominate throughout the Grand Banks region, either in close or open concentrations. Close ice concentrations are usually more frequent, except at the Terra Nova and East Rankin locations, which experience the least pack ice presence. There is also a sharp division between the four locations most often covered by pack ice and the remaining three, with respect to the occurrence of thicker ice (exceeding 70 cm) in close concentrations. Between 13 % and 20 % of the close pack ice incursions that occur at these four locations are made up of at least one-tenth medium first-year ice (70-120 cm) or greater. An additional distinction between the upper four and lower three locations (in terms of severity) lies in the frequency of close and open pack. Frequencies of open conditions at the three locations of least pack ice occurrence equals or exceeds 50 %. Open conditions at the other four locations are more limited, ranging from 25% to 45%.
Table 2.4: Occurrence frequencies for combined ice thickness and ice concentration categories. South Tempest <30 cm 30 - 70 cm >70 cm Open ice 5.8% 13.5% 5.8% Close ice 9.6% 46.2% 19.2% 52 occurrences, 1985-1994.
West Bonne Bay <30 cm 30 - 70 cm >70 cm
Open ice 9.3% 14.0% 11.6% Close ice 7.0% 39.5% 18.6% 43 occurrences, 1985-1994. SE Mobil block <30 cm 30 - 70 cm >70 cm Open ice 8.8% 14.7% 14.7% Close ice 17.6% 29.4% 14.7%
34 occurrences, 1985-1994. Whiterose <30 cm 30 - 70 cm >70 cm Open ice 10.3% 20.7% 13.8% Close ice 6.9% 34.5% 13.8% 29 occurrences, 1985-1994. Hibernia <30 cm 30 - 70 cm >70 cm Open ice 10.7% 32.1% 7.1% Close ice 10.7 35.7% 3.6% 28 occurrences, 1985-1994. Terra Nova <30 cm 30 - 70 cm >70 cm Open ice 0.0% 50.0% 7.1% Close ice 7.1% 35.7% 0.0% 14 occurrences, 1985-1994. East Rankin <30 cm 30 - 70 cm >70 cm Open ice 0.0% 50.0% 10.0% Close ice 0.0% 40.0% 0.0% 10 occurrences, 1985-1994.
2.3.2 Characteristics
There is a limited amount of information available about the characteristics of the pack ice cover that is found on the Grand Banks. This comment applies to a variety of pack ice characteristics, ranging from ice floe sizes, through the presence of ridges and rafted ice areas, to the occurrence of old ice floe fragments and glacial ice features within the pack ice cover. Several investigations have been carried out to assess pack ice conditions on the Grand Banks and in its general vicinity, including:
- Nolte, K.G. and M.E. Trethart. North Atlantic Sea Ice Survey. Report prepared by
AMOCO Canada Petroleum Co. Ltd., Calgary. 1971.
- Blenkarn, K.A. and A.E. Knapp. Ice conditions on the Grand Banks. Canadian Institute - Dobrocky Seatech. Field Data Report. Sea ice documentation in the vicinity of the
Hibernia drilling area, February 14-22, 1985. Report prepared for Mobil Oil Canada
Ltd., Calgary. 1985.
- Ledrew, B.R. and S.T. Culshaw. Ship in the ice data report. C-CORE Publ. No.
77.28. St. John’s, NF. 1977.
- Convey, A.D. 1972 Grand Banks Aerial Reconnaissance Engineering
Memorandum. AMOCO Canada Petroleum Co., Ltd., Calgary. 1972.
- Dobrocky Seatech. Field Data Report. Sea ice documentation in the vicinity of the
Hibernia drilling area, February 14-22, 1985. Report prepared for Mobil Oil Canada
Ltd., Calgary. 1985.
- Seaconsult. Physical environmental data for production systems at Terra Nova. Report prepared for Petro-Canada Inc., Calgary. 1988.
- The Labrador Ice Margin Experiment (LIMEX), prepared by C-CORE, St. John’s, 1989-90.
These and other ice information sources have been examined, and their data incorporated in the Terra Nova Development Application of 1997. Ice observations from these studies, in combination with ice reconnaissance data collected by Canadian government agencies, have been used as a basis for the ice characteristics outlined in this study and summarized below. Floe Sizes
Site specific information on ice floe sizes is sparse and irregular, owing largely to the tendency for drilling units to avoid the relatively short periods of pack ice presence in what is now the area of potential Grand Banks development. Five pack ice characteristics studies in or near the area of interest to this work were undertaken by various researchers between 1969 and 1985. In addition, regularly published Environment Canada ice charts were examined, both in this study and by Seaconsult (1988), for observations of predominant floe size categories.
A general trend in floe size gradation was noted in the area south of 49°N latitude, which includes the Grand Banks study area. Floe diameters tend to decrease from west to east, with the decrease being influenced by the following circumstances:
- decreasing ice concentrations toward the pack ice margin - increasing sea temperature toward the pack ice margin
- higher sea state toward the pack ice margin.
The analysis of 1985-94 ice charts carried out in this work revealed extensive reporting of two floe size categories across the Grand Banks area. They were “small floes” (20 to 100 m diameter range) and “strips of 9+/10ths”. The latter notation is used to describe the wind-driven form of ice fragments, less than 20 m diameter remaining from the destruction of larger ice floes. In late February and early March, on rare occasions, Environment Canada ice charts over the 1985-94 period noted floes greater than 100 m diameter, but only at the more northerly reference locations. These floes were of grey white thickness (15 to 30 cm) and would reduce to small floe size category or strips of brash ice before the end of March. The Seaconsult chart analysis, incorporated in the Terra Nova Development Application, dealt with the 1964-87 period and reflects the trends observed from 1985-94, with only ten percent of the ice approaching within 50 km of Terra Nova having floes exceeding 100 m diameter.
The five ice studies undertaken between 1969 and 1985 indicate mean ice floe diameters of less than 30 m on the Grand Banks south of 49°N latitude, with floe diameters that exceed 60m being rare. Extreme floe sizes of several hundred metres in diameter should be expected during maximum ice incursion periods, in the most severe pack ice seasons.
Figures 2.5 through 2.7 illustrate representative pack conditions on the Grand Banks over the March-May period of 1989. The pack ice in these figures was actually photographed to the north of the Grand Banks area, but is considered to be representative for the area in years of ice incursion. The individual ice floes that are seen in these figures are small in size, are quite angular in shape and in some instances, are conglomerate floes comprised of smaller ice cakes frozen together at an earlier stage. Although there is no indication of scale on these figures, the largest floes are only tens of metres in diameter.
By way of summary, the Grand Banks area should only experience the smallest of ice floes in the advancing pack ice cover, due to its location near the pack edge margin. Warmer sea temperatures and swell effects from the adjacent open seas combine to reduce floe diameters updrift of the Grand Banks. Mean floe diameters will usually be less than 50m, with extremes rarely exceeding 100 m. In the highest pack ice concentration periods during the most severe ice seasons, floes with diameters in the hundreds of metres range may be seen at the most northerly of the reference locations.
Ridges, Rubble, and Rafted Ice
on ridges, rubble and rafted ice that is specific to the Grand Banks region. Information about the deformed ice that is likely to reach the Grand Banks has been extrapolated in three separate reports, from conditions observed much further to the northwest, off the coastlines of southern Labrador and Newfoundland. The following results were obtained.
• 2 m maximum sail heights, based on measurements of uplifted and broken ice blocks in small ice floes, and very short ridge lengths (Dobrocky Seatech, 1985).
• 3.5 m maximum sail height, based on February-March observations in south Labrador pack ice conditions, but not allowing for significant melt and disintegration during the southward ice drift towards the Grand Banks (Seaconsult, 1988).
• 1 m average sail heights, again based on northern Grand Banks and southern Labrador
pack ice conditions (Nolte and Trethart, 1972).
Based upon the above, a keel to sail ratio of 3:1, and allowing for melt and disintegration as the pack ice cover moves southwards, average ridge thicknesses of between 3m and 5m and extremes of about 15m are suggested for the Grand Banks. These features should be quite limited in lateral extent, and are best viewed as very small ridge fragments. Similarly, rubbled and rafted ice areas should be limited to several metre in thickness and again, should be very small in terms of their areal extent (a few metres to extremes of a few tens of metres).
Other Considerations
In isolation, the first year sea ice conditions that are found on the Grand Banks are quite mild, in comparison with most other ice infested areas of the world. However, the presence of icebergs, small glacial ice masses, and old ice floe fragments within the East Coast’s pack ice cover can make this ice regime quite challenging. Iceberg, bergy bit and growler occurrences on the Grand Banks are largely determined by the sea ice conditions that are seen off Labrador each winter, which control the wave action, melt and mass losses that these glacial ice features experience. Pack ice intrusions onto the Grand Banks are normally associated with relatively high densities of icebergs in the area, and to a lesser extent, high frequencies of small glacial ice masses. There are no statistics available on mixed sea ice and iceberg occurrences in the area, but this is a significant consideration in terms of vessel operations in the pack ice environment on the Grand Banks.
Remnants of old sea ice floes that originate off the coast of Baffin Island and drift eastwards from Lancaster, Jones and Smith Sounds can also be found off Labrador and, in smaller amounts, off Newfoundland (Wright, 1980). Based on Environment Canada’s ice charts, old ice floe fragments are rare on the Grand Banks. A review of the 1985-94 ice charts indicated only trace amounts of old ice, and only in the 1994 season over a four week period from late March to mid April. The relatively small size of the old ice floe fragments that may be seen on the Grand Banks make these features roughly equivalent to the growlers and bergy bits that can be encountered in the area.
The combination of ice, together with significant seas and/or swells, is another consideration that should be recognized. These combined conditions will result in small ice floe fragments that may move cyclically at relatively high speeds. However, this type of “moving sea ice occurrence” is not viewed as a significant factor for any moored vessels that are appropriately ice strengthened, since ice impact speeds will be less than those seen during ship transits.
2.3.3 Ice Movement
Pack ice movements, more so than iceberg movements, are dependent on winds. From the perspective of pack ice occurrences on the Grand Banks, sustained northerly winds will move pack ice closer to the area of interest, with the smallest ice floes being first to react to the wind. Swell generating winds from the southerly directions will tend to break up floes at the leading edge of the pack ice boundary. During the February-March period of strong storms across the region, the combination of winds and high swell from the southwest will often completely disperse the local pack ice, as occurred in late February of 1993 (Canadian Coast Guard, 1993). When pack ice is present over the Grand Banks area, significant increases in local ice concentrations due to wind action can occur within a matter of hours. Changes can be seen within a 24 hour period, which is the normal delivery time for government ice reconnaissance chart products.
As outlined in the Terra Nova Development Application (1997), the amount of relevant pack ice drift data for the Grand Banks area is limited. Petro-Canada carried out a program of ice mounted satellite tracked drift buoy deployments over the 1984-1987 period, beyond the northern margin of the Grand Banks area. The resulting ice drift patterns and velocities are characteristic of the slope regions off the Grand Banks, and relate more closely to the Whiterose, South Tempest, and East Mobil reference locations than the sites on the crest of the Banks. Ice drift data from February-April, 1985 was analysed and the ice drift speed exceedence distribution shown in Figure 2.8 was generated. It may be seen that in 1985, 80% of the measured ice drift speeds were less than 0.6 m/sec. The preferred drift direction was
towards the southeasterly quadrant, with 75% of the drift being towards the east, southeast and south, and basically unidirectional over time scales of many hours. A mariner’s experience with ice motions over the Grand Banks confirms this data, and estimates average ice speeds at about 0.25 m/sec during the February-March period, with extremes of roughly 0.75 to 1.0 m/sec (P. Dunderdale, personal communication). These estimates were compared with the daily forecast ice vectors available on the Ice Patrol charts from 1985 and 1987. In these two years, calculated average pack ice motions were between 0.2 and 0.3 m/sec. In the 1985 season, extreme ice movements of more than 0.6 m/sec were reported.
2.4
Data Limitations and Needs
The most consistent data source for characterizing the historical pack ice conditions on the Grand Banks remains the Environment Canada ice chart series. These charts are produced on a daily basis and are also consolidated into twice-weekly composite products. The composite charts offer a good means of following the historical advance and retreat of the pack ice and zone of icebergs. The positional accuracy and detail of observation are particularly good from the early 1980s onwards, when petroleum exploration activities gave additional importance to the area and ice remote sensing techniques began to improve. The ice charts, however, have limitations in characterizing the forms of pack ice that are likely to be present at any given location. The chart coding convention is limited to reporting the predominant floe size category for each ice type that is present. The “small floe” class (20 to 100m diameter), which appears to predominate on the Grand Banks, remains somewhat broad, particularly in the light of periodic studies which suggest that the average and extreme floe sizes may occupy opposite ends of this single size category. The representative photos of pack ice in the region that are given in Figures 2.5 to 2.7 actually show floes from the ice edge north of the area of interest, towards the northern margin of the Grand Banks. These photographs must be considered as illustrative only, since they may not show ice at the same stage of decay and dispersal as might be the case at the more southerly production locations. Aerial photography of actual ice conditions when it is present in the area would add needed detail to the ice chart floe size reports. Canadian Ice Patrol flights, Provincial Airways who carry out routine reconnaissance duties as part of the Fisheries Patrol, and helicopters moving to and from offshore platforms like Hibernia GBS all afford opportunities to obtain systematic aerial photographic information in the future, when pack ice does occur on the Grand Banks.
remain sporadic. Observations made by exploration units on the Grand Banks in the 1980s were examined for site specific pack ice data. Understandably, any annual periods of pack ice incursion coincided with periods of non-activity, since the drilling units usually scheduled their work for longer term open water conditions. Thus, no detailed pack ice information was recorded. In the future, systematic and detailed observations of pack ice thickness and roughness from platforms like the Hibernia GBS, the projects tankers, and support vessels operating in the area would significantly enhance the existing data base. Systematic reporting of the concentrations of old ice floe fragments, small glacial ice masses and icebergs within the pack ice would also be of high benefit.
Continued development of accurate means of detecting the smallest of iceberg fragments is needed, in open water and in pack ice. As emphasized in Terra Nova (1997), bergy bits and growlers, though smaller than icebergs, are still of substantial size, and they are more difficult to detect, particularly in high seas and pack ice. It is in higher seas, where icebergs are less protected by surrounding pack ice that the melt and calving process is expected to generate the greater numbers of these small ice masses. For moored vessel operations in moving pack, a future area of concern is when glacial ice is detected within the pack, how can it be managed by support vessels.
From an operational perspective, the timely detection and reporting of pack ice advances on the Grand Banks is an important consideration which should receive some attention in the future. Operationally, ice reconnaissance data must be communicated to an in-ice operation in near real time (within an hour or so of being acquired) to be of maximum use and benefit. Rapid data turnaround time frames will ensure that the user has an accurate picture of any advancing ice conditions on which to base strategic and tactical decisions.
3.0
Moored Vessel Systems
3.1
General
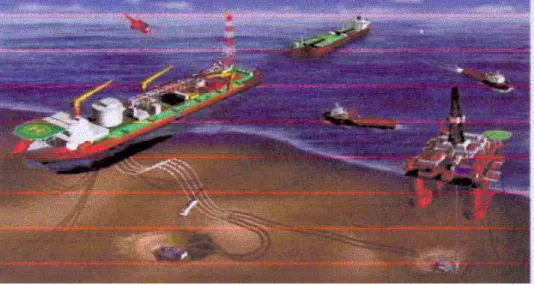
To date, two fundamentally different approaches have been considered for the development of Grand Banks oil fields, as illustrated by the Hibernia and Terra Nova production systems. Schematics of these two development approaches are shown in Figures 3.1 and 3.2. Both systems include a significant oil storage capacity on the production platform, tanker loading facilities, and shuttle tankers that will periodically move stored oil to market. However, the Hibernia approach is centred around the use of a gravity based structure (GBS) which is designed to passively withstand all environmental forces, including those from extreme waves, icebergs and pack ice. The benefit of this approach is that a fixed structure (with integral storage) will experience little, if any, production downtime due to adverse environmental conditions. However, the penalty is normally reflected by increased production facility costs, extended construction schedules, and longer time frames to "first oil".
The Terra Nova development scheme involves a floating ship-shape production vessel with integrated storage and offloading systems (FPSO), which is designed to continue operations in most environmental conditions, but suspend production and if necessary, move off location, should extreme events occur. When iceberg or pack ice avoidance is required, the vessel’s mooring lines and risers are disconnected and the FPSO simply moves off under its own power. This approach is based upon an "active design philosophy" and reflects a high level of confidence in the experience that has been developed with floaters during exploratory drilling activities, including the ice detection and management area. Generally, the advantage of an FPSO vessel is lower capital cost and quicker on-stream times, but the penalty is the potential for more downtime due to waves and ice, and the associated delays to production.
Both of these fixed and floating development approaches involve the periodic transfer of stored oil from the production platform to ice strengthened tankers via an offshore loading system, for subsequent shipment to market. The tanker mooring and oil loading arrangement that is being periodically used at the GBS is located well below the waterline (when not in use), where it is protected from most ice influences. At the terra Nova FPSO, stored oil will be transferred to shuttle tankers that are periodically tandem moored to its stern, through a conventional mooring/loading arrangement. Clearly, tanker loading operations at both types of production facilities will be susceptible to iceberg and pack ice incursions. The shuttle
tankers that are used within these developments will also be exposed to icebergs and pack ice during regional transits. As a result, they will be designed to contend with sea ice occurrences but will have to avoid icebergs and most small glacial ice masses.
It is generally accepted that future developments on the Grand Banks will involve the small to moderately sized oil fields that are present in the area, and will be based on the use of floating production systems, similar to the Terra Nova FPSO. Any future developments that involve fixed platforms like the Hibernia GBS are considered unlikely, because they require very large oil field reserves to be economic (Croasdale, 1992 & 1994, Wright, 1997). In this section of the report, a number of representative FPSO vessels and tanker loading arrangements are defined, with the intent of spanning the range of moored vessel systems may be used in future Grand Banks developments. This system definition work has been guided by the Terra Nova FPSO design, the Hibernia tanker loading system, and other world wide experience. Input from Grand Banks operators has also been solicited, to ensure that the moored vessel systems defined here are appropriate.
3.2
Representative Systems
3.2.1 FPSO Vessels
Three representative FPSO vessels have been selected for the purposes of this study, with vessel size considered as the main variable. In terms of future Grand Banks developments, FPSO sizes will be largely determined by the characteristics and size of the particular oil field being developed, the peak daily production rates that are planned, and related oil storage and tanker export cycle requirements. For example, the Terra Nova oil field is relatively large and productive, with about 350 million barrels of recoverable oil reserves that will be produced at peak daily rates of 125,000 BOPD. To support these production rates and planned tanker export cycles of about six days, the Terra Nova FPSO will be quite large, with an onboard storage capacity of 960,000 barrels. Smaller fields like the Whiterose and Hebron prospects, with estimated recoverable reserves in the 150 million to 250 million barrel range, will require proportionately smaller FPSO vessel sizes and onboard storage capacities (Wright, 1997).
Table 3.1 highlights the three representative FPSO vessels that have been selected for use in this study. These FPSO vessels range from 50,000 DWT to 160,000 DWT in size, with the
Terra Nova FPSO representing the upper bound case. The two smaller FPSO vessels, with oil storage capacities of about 190,000 and 550,000 barrels, are intended to represent lower bound and median cases. These FPSO vessels, the Captain and Petrojarl 1, are more typical sizes for oil field developments in the 100 to 200 million barrel range, and are currently being used in the North Sea’s Captain and Blenheim development projects.
Table 3.1: Representative FPSO vessels considered in this study.
Petrojarl 1 Captain Terra Nova
Displacement 51,000 DWT 114,000 DWT 160,000 DWT
Length 209 m 215 m 280 m
Beam 32 m 38 m 45 m
Draft (loaded) 18 m 21 m 24 m
Hull Form all have conventional open water hull forms
Storage 190,000 bbls 550,000 bbls 960,000 bbls Process 50,000 BOPD 80,000 BOPD 125,000 BOPD Mooring System external turret internal turret internal turret
# of lines 8 6 6
# of risers 8 12 20
Mooring capacity 1000 tonnes 1500 tonnes 2000 tonnes Current Use Blenheim - North Sea Captain - North Sea Terra Nova (future)
In addition to giving information on the size of these FPSO vessels, Table 3.1 also provides some information about their mooring and riser systems. It may be seen that each of these FPSO vessels has a turret which houses its mooring and riser systems. This turret allows the vessel to vane into the direction of oncoming environmental forces, thereby reducing mooring loads and FPSO response motions. It may be seen that their mooring systems are very capable and have the capacity to withstand forces that are in the 1000 tonne to 2000 tonne range, with acceptable vessel offsets and individual line tensions.
In terms of considering stationkeeping operations with representative FPSO vessels like these in Grand Banks pack ice conditions, the following points should be noted.
• FPSO vessels that are intended for use on the Grand Banks will be designed for optimum performance in storm waves. Although they will be ice strengthened, they will not be designed to efficiently break and/or clear pack ice. Accordingly, these vessels will have relatively conventional open water hull forms.
• mooring system designs for Grand Banks floaters will be very strong but will be driven by the requirement to maintain location in extreme storm waves, and not by the need to either stationkeep in pack ice or sustain some level of iceberg impact loading.
• because of the iceberg threat, Grand Banks FPSO vessels will have the capability to suspend production operations and quickly move off location, should any hazardous conditions and/or high mooring load levels be experienced.
• because of requirements for a standby vessel and an iceberg management capability, one or more support vessels will always be available on-site, which should be capable of providing pack ice management services for an FPSO on an as-required basis.
To date, most operators have approached the issue of stationkeeping in Grand Banks pack ice conditions in a fairly cautious manner. For example, the Terra Nova project proponents have been planning to continue FPSO stationkeeping operations in pack ice concentrations to 5/10ths, but to move off when this threshold is exceeded (Terra Nova Development Plan, 1997). Other operators have followed suit, and are carrying similar ice downtime thresholds in their project assessment work. However, recent FPSO model testing work for Terra Nova has suggested that stationkeeping operations may be feasible in higher ice concentrations, and a vessel “move-off threshold” of 8/10ths is now being considered (G. Vance, personal communication). This difference may not be particularly significant for the economically robust Terra Nova project, where pack ice is only expected about 2% of the time. However, for smaller oil fields like Whiterose and Hebron that may be developed over a shorter number of years and are more economically marginal, the issue is much more consequential. At Whiterose and some of the other Grand Banks locations, pack ice occurrence frequencies can be in the range of 5% to 10% of the time, and annual occurrence durations as long as 65 days.
3.2.2 Tanker Loading Systems
Three representative tanker loading systems have also been defined for the purposes of this moored vessel stationkeeping study. Two are typical of the loading approaches that are being used for the Hibernia and Terra Nova projects, and all three are well proven in conventional open water development applications elsewhere in the world. They include:
• a mooring and oil transfer arrangement for tandem tanker loading operations in the lee of an FPSO vessel (Figure 3.1). This type of loading system is only relevant for FPSO development scenarios, and is the approach that will be used at Terra Nova.
• an offshore loading system (OLS) for oil transfer to a dynamically positioned tanker at some distance from either a fixed or floating production platform (Figure 3.2). This loading approach is now being used at Hibernia.
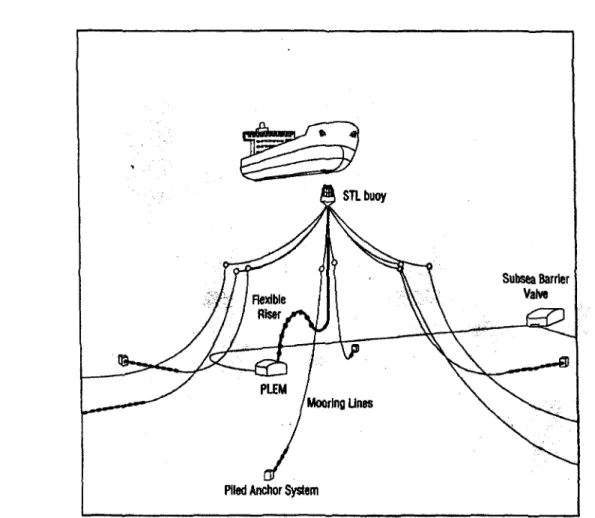
• a submerged turret loading system (STL), again for tanker mooring and oil transfer operations at some distance away from either a fixed or floating production platform (Figure 3.3). This system has gained popularity for use in hostile wave environments and is now being considered for use in many pack ice infested waters of the world. To be effective, it is clear that a tanker must routinely approach, hook-up and stationkeep at the loading facility, in most of the environmental conditions that can be experienced over the course of any particular oil transfer cycle. Should storm waves, icebergs or pack ice prevent a tanker’s approach and/or stationkeeping operation, loading downtime will be experienced. Since storm wave durations are normally limited to several days and iceberg occurrences are very transient events, platforms with large storage capacities can usually absorb wave or iceberg related loading delays of a few days, without having to reduce or shut down their production operations. However, more extended loading delays that could be caused by heavy persistent pack ice occurrences could lead to lengthy production shut downs. In terms of future Grand Banks developments, it is not unlikely that tandem tanker loading from FPSO vessels will be the most commonly used approach. However, OLS or STL systems represent viable loading options for both floating and fixed structure developments. Here, the following points should be noted.
• the mooring and transfer hose arrangements for each of these three tanker loading systems are located well clear of the waterline when not in use, to avoid pack ice and to minimize the risk of possible collisions with icebergs.
• all three systems provide tankers with the flexibility to vane during loading operations, to minimize environmental forces. A “free vaning” capability is available with both the OLS and STL systems, but vaning limits will apply for the tandem loading system, due to the presence of the FPSO. However, the FPSO does provide some protection for a moored tanker, for example, a downstream wake in moving pack ice conditions.
• the tandem tanker mooring and loading arrangement has the capacity to withstand forces that are in the 400 tonne range, with acceptable tanker offsets and mooring line tensions. The mooring capacity of the STL system is considerably more capable and will permit tanker loading operations at load levels exceeding 1000 tonnes.
• acceptable load levels for stationkeeping operations with an OLS system are solely a function of the thrusting capability of a tanker’s propulsion and DP systems, which are typically in the range of several hundred tonnes.
• all of these tanker loading systems have the capability to be quickly disconnected and will permit a tanker to rapidly move-off location should adverse operating situations, load levels or vessel motions arise.
• the need for high levels of efficiency in open water conditions will drive tanker loading system designs for Grand Banks developments, although they will be configured to avoid potential damage from icebergs and pack ice. Particular system design features to support tanker loading operations in pack ice will be a secondary consideration.
• however, ice capable support vessels should always be available to provide some ice management services for tanker loading operations, on an as-required basis. Obviously, a tanker’s ability to approach, manoeuvre, hook-up and stationkeep at these types of loading systems, along with the load levels that will be experienced while stationkeeping, will vary with size of the tanker and its particular design features. For the purposes of this study, the 127,000 DWT shuttle tankers that are being used for the Hibernia development project, and will probably be utilized as part of an integrated regional oil export system for other Grand Banks developments, have been selected as representative. These tankers are double hull, double bottom vessels that have conventional open water hull forms, with ice strengthening to CAC 4 levels in their bow and Baltic Class 1A strengthening elsewhere.
Their length, beam and draft dimensions are 200m, 35m and 12m, respectively. Although ice strengthened, they are not designed to either break or clear pack ice in an efficient manner. To date, most operators have viewed the issue of tanker loading operations in Grand Banks pack ice (and iceberg) conditions in a very pragmatic manner. The approach that is being used at the Hibernia OLS and considered for the Terra Nova development leaves the responsibility for deciding whether or not to undertake tanker loading operations up to the ship’s Master, exclusively. No predefined criteria or thresholds are set. On a case by case basis, the Master will assess the ambient environmental conditions, the ability of his tanker to safely conduct loading operations, and the need for ice management support, and will proceed accordingly. Once some in-ice experience is gained with tanker loading, more formal criteria and operating procedures may be developed. Again, tanker loading downtime may not be particularly consequential at locations where pack ice intrusions are infrequent and limited to a few days. However, fairly common and prolonged pack ice occurrences that preclude tanker loading operations for time period of several weeks or more will be problematic.
3.2.3 Ice Management Support
As noted above, it is likely that one or more ice management vessels will always be available to support moored FPSO and tanker loading operations at Grand Banks development sites, when pack ice intrusions occur. In addition to having a year round standby vessel (which is a regulatory requirement), most operators are planning to have additional support vessels on-site, at least seasonally, to provide as-required ice management support (icebergs and sea ice). For example, there are usually at least two support vessels around the Hibernia GBS platform, while the Terra Nova project is currently planning to have up several ice management support vessels on-site in the peak iceberg season. For the purposes of this study, it has been assumed that at least two support vessels will be available around both moored FPSO platforms and any tanker loading operation, to carry out as-required ice management duties when pack ice occurs. However, it is recognized that these support vessels will not be highly capable icebreakers, but will be relatively simple practical supply boats, with some ice strengthening. It is likely that performance capability of these vessels in pack ice will be determined more by their need to access Newfoundland ports in winter, rather than their ability to deal with pack ice conditions on the Grand Banks. Here, the type of support vessels that have been assumed as being representative are similar, but somewhat better ice strengthened, than the Type C Maersk vessels now under contract for use at Hibernia. Relevant “particulars” for the ice management support vessels that have been assumed in this study are highlighted as follows.
• ice strengthening to reasonable standards, suggesting that the assumed support vessels should be capable of working in most Grand Banks pack ice conditions, without the fear of hull damage, given prudent operating procedures.
• powering in the range of 10,000 HP, suggesting that these support vessels should be capable of transiting through most Grand Banks pack ice conditions with a reasonable degree of efficiency.
• vessel hull forms that do not have particularly good icebreaking and ice clearing lines, but are capable of some icebreaking and ice clearance duties (eg: prop wash).
• no special features that are designed for enhanced performance in pack ice conditions, such as low friction coatings, thrusters, and bubbler or water wash systems. It should also be recognized that more capable icebreaking support vessels (if available) could be chartered on a short term basis and mobilized to a development site, should a strong need arise. For example, this type of ice management contingency has been identified as an option for tanker loading operations at the Hibernia platform should heavy pack ice conditions occur.
3.3
Key Considerations
3.3.1 Regulatory Requirements
There are a variety of considerations that are associated with the question of moored vessel stationkeeping in moving pack ice, for both FPSO and tanker loading operations. From a regulatory perspective, specific requirements for these types moored vessel systems are not particularly well defined at the present time. CNOPB applies the requirements that are set out in the Newfoundland Offshore Petroleum Installation Regulations, which are quite generic and broad. They are briefly highlighted as follows.
• every floating platform that is intended to be used in areas where sea ice is present shall be able to