The Applications of Autonomous Systems to Forestry Management
byJoshua Przybylko
BE Aeronautical (Space), The University of Sydney, 2005 BSc Mathematics and Physics, The University of Sydney, 2005
Submitted to the MIT Sloan School of Management and the Engineering Systems Division in Partial Fulfillment of the Requirements for the Degrees of
Master of Business Administration and
Master of Science in Engineering Systems
In conjunction with the Leaders for Global Operations Program at the Massachusetts Institute of Technology
June 2013
C 2013 Joshua Przybylko. All rights reserved. The author hereby grants to MIT permission to reproduce
and to distribute publicly paper and electronic copies of this thesis document in whole or in part
in any medium now known or hereafter created.
Signature of Author Certified by Certified by Accepted by
ARCHMVS
MASSACHUSETTSINeffiN
OF TECHNOLOGYMAY 3 0 2013
UBRA RIES
Engineering Systeins Division, MIT Sloan School of Management
May 10, 2013
Steven D. Eppinger, Thesis Supervisor
Professor of Management Science and Innovation and Professor of Engineering Systems
- V- /I
Jonathan P. How, Thesis Supervisor Professor of Aeronautics and Astronautics
Oli de Weck, Chair, Engineering Systems Education Committee
Associate Professor of Aeronautics and Astronautics and Engineering Systems
-#..7. x
A/2
It .t /A-Accepted by , , - A 11
The Applications of Autonomous Systems to Forestry Management
byJoshua Przybylko
Submitted to the MIT Sloan School of Management and the Engineering Systems Division on May 10,
2013 in Partial Fulfillment of the Requirements for the Degrees of Master of Business Administration and
Master of Science in Engineering Systems
Abstract
Public and private timberland owners continually search for new, cost effective methods to monitor and nurture their timber stand investments. Common management tasks include monitoring tree growth and tree health, estimating timber value and preventing wildfire. Many of these tasks are both manual and costly due to the vast areas and remote locations involved.
Forestry experts predict that multi-vehicle autonomous systems may enable new, cost effective methods for performing various forest management tasks[1]. However, it remains unclear how these technologies may be applied, or where to focus development efforts. This research attempts to address this gap in literature, linking state-of-the-art research in forestry management science, robotics and autonomous systems, and product design and development.
This thesis begins by reviewing existing forestry management practices and discussing a number of challenges identified through industry interviews and research. Modem product design methods are reviewed, and used to generate ideas for a number of new concept systems. Three design concepts are presented as detailed case studies.
The data sets, methods and proposed systems discussed in this thesis may be used to guide future research in forestry management science, and drive further innovation in the emerging field of commercial and civilian autonomous systems.
Key words: Forestry Management, Forestry Science, Robotics and Autonomous Systems, Unmanned
Aerial Vehicles (UAV), Unmanned Aerial Systems (UAS), Product Design and Development, Light Detection and Ranging (LiDAR)
Thesis Supervisor: Steven D. Eppinger
Title: Professor of Management Science and Innovation and Professor of Engineering Systems Thesis Supervisor: Jonathan P. How
Acknowledgments
Over the past year I have received support and encouragement from a great number of individuals. Dr. John Vian has been a mentor, colleague, and friend. His guidance has made this a thoughtful and rewarding journey. I would like to thank my academic supervisors Professor Steven Eppinger and
Professor Jonathan How for their support and guidance over the past year as I moved from ideas to a completed study. I would like to thank both Tom Hagen and Dr. George M. Roe for overseeing the project and making important industry introductions. Their input into this project was tremendously valuable.
I would also like to thank the faculty of forestry at Oregon State University who contributed to this study by generously sharing their time and ideas. I have learned much though our conversations. Finally, I
Table of Contents
A b stra ct ... 3
Acknow ledgm ents...5
Table of Contents... 7
List of Figures...9
1 Introduction and M otivation ... 12
1.1 Problem Statem ent and Research Objective ... 12
1.2 Defining the Autonom ous System ... 13
1.3 Research M ethodology ... 14
1.4 Chapter Sum m ary ... 15
2 Product Design M ethods for Autonom ous System s ... 16
2.1 The Product Design Fram ework ... 16
2.2 State-of-The-Art System -of-System s Design M ethods ... 23
3 Project Charter and Scope... 30
3.1 Identifying the Target M arket and Defining Project Constraints... 30
4 Industry Review - Forest M anagem ent ... 35
4.1 Industry Structure and M arket Trends ... 35
4.2 Forest M anagem ent Practices (M issions) ... 40
4.3 Active Research and Technology Trends in Forestry Management ... 49
5 Industry Review - Commercial and Civilian Autonomous Systems Market ... 59
5.1 Industry Structure and M arket Trends ... 59
5.2 Active Research and Technology Trends ... 63
5.2.1 Active Research Them es... 63
5.2.2 Case Studies of Autonomous Systems in Forestry and Agriculture ... 68
5.3 Regulatory Consideration ... 76
6 Opportunity Identification and Prioritization... 79
6.1 Top M arket N eeds and Opportunities ... 79
6.1.1 M ore Accurate, Lower Cost, Inventory Analysis M ethods ... 79
6.1.2 Soil Condition M onitoring... 83
6.1.3 M easuring Soil Carbon ... 83
6.3 Additional M arket Opportunities ... 87
7 Concept Generation: Three Case Studies... 91
7.1 Concept I: Adverse W eather Condition Aerial LiDAR ... 91
7.1.1 Opportunity Description ... 91
7.1.2 Concept Description... 92
7.1.3 Needs Analysis...95
7.1.4 Functional Requirem ents ... 95
7.1.5 Description of System Elem ents ... 99
7.1.6 H igh Level Business Case... 100
7.2 Concept II: Below Canopy Tree M etrology System s ... 104
7.2.1 Opportunity Description ... 104
7.2.2 Concept Description... 105
7.2.3 N eeds Analysis... 105
7.2.4 Functional Requirem ents ... 106
7.2.5 Description of System Elem ents ... 107
7.2.6 High Level Business Case... 113
7.3 Concept III: Forest Sensor Deploym ent and M onitory System ... 114
7.3.1 Opportunity Description ... 114
7.3.2 Concept Description... 115
7.3.3 N eeds Analysis... 117
7.3.4 Functional Requirem ents ... 118
7.3.5 Description of System Elem ents ... 118
7.3.6 High Level Business Case... 123
8 Sum m ary and Key Findings and Conclusions ... 125
8.1 Reflection on Fram eworks and M ethods ... 125
8.2 Recom m ended Future A reas of Research... 126
Glossary of Term s... 129
List of Figures
Figure 1 - Three Interdisciplinary Domains of This Research... 13
Figure 2 - A utonom ous System Elem ents... 14
Figure 3 - Six Phase Product Development Process by K.T.Ulrich and S.D.Eppinger[10]... 16
Figure 4 - Phases of UAS development by R. Austin[ll] ... 17
Figure 5 - Market Opportunity Selection Filters by Design Firm IDEO [13, 14] ... 18
Figure 6 - Seven-Step Concept Development Process by K.T.Ulrich and S.D.Eppinger[10] ... 19
Figure 7 - Illustrative System Requirements Tree - Adapted from Sakamoto[15]...20
Figure 8 - Design Process for Complex System - Adapted from Sakamoto 2004[15]...22
Figure 9 - System-of-System Tradespace Exploration Method[19]... 23
Figure 10 - Human Supervisory Control Architecture - Adapted from Sheridan, 1992 [21]...25
Figure 11 - Revised Human Supervisory Control Architecture ... 28
Figure 12 - Design Trade-offs as a Function of Automation and Autonomy... 29
Figure 13 - Refinement Phases of the Mission Statement...30
Figure 14 - Civilian and Commercial Autonomous Systems Market by Projected Relative Shares ... 31
Figure 15 - Industrial Roundwood Production by Top Producing Countries... 32
Figure 16 - U.S. Forest Inventory Analysis Funding vs. Commercial Forestry Sector... 32
Figure 17 - Em ployees W orking in Forestry... 33
Figure 18 - U .S. M arket for Forest Support Services... 34
Figure 19 -The Forest Machine -A Past R&D Project by John Deere... 36
Figure 20 - Forest Products Value Chain [29-33] ... 37
Figure 2 1 - Forestry Stakeholders ... 38
Figure 22 - US Forest Lands by Ownership and Application ... 39
Figure 23 - Top 20 Industrial Forestry Companies in the USA [34]...39
Figure 24 - Silviculture Activities by Forest Stage ... 41
Figure 25 - Erosion resulting from deforestation in Madagascar... 44
Figure 26- Illustration of Form Class and Taper[40] ... 47
Figure 27 - Illustration of Diameter Quotients as a Means of Calculating Taper and Form[40] ... 47
Figure 28 - Common Tools for Conducting a Timber Cruise ... 47
Figure 29 - Select Forestry Data Collection Activities ... 49
Figure 30 - Vegetation Spectra of Common Tree Species found in North America[45]...52
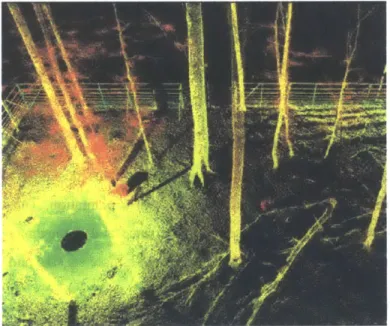
Figure 31 - Examples of high density LiDAR data and multispectral data... 53
Figure 34 - Terrestrial LiDAR Scanner and Point Cloud Processing Software ... 56
Figure 35 - Illustrative Geographic Information System Data Model... 57
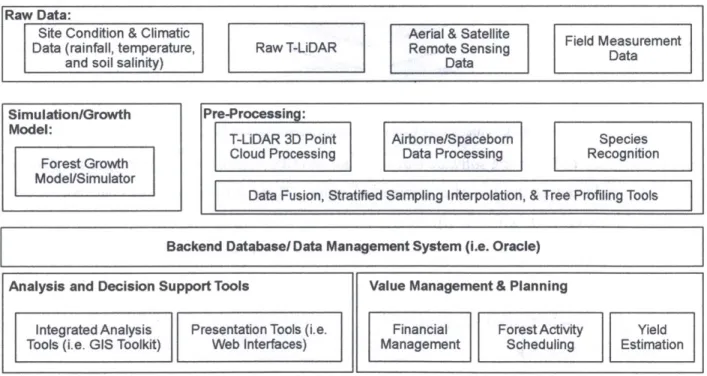
Figure 36 - Framework for Integrated Forest Management System ... 58
Figure 37 - Select Civilian and Commercial Micro VTOL class UAS... 60
Figure 38 - Select Civilian, Commercial, and Military Micro Fixed Wing UAS ... 60
Figure 39 - Emergent Applications for Autonomous Systems by Industry ... 61
Figure 40 - U.S. Commercial and Civilian UAS Market Size Forecast...62
Figure 41 - Demonstration of Swarm Technologies ... 63
Figure 42 - UAS Navigation through Learned Monocular Reactive Control ... 64
Figure 43 - Robust Autonomous Navigation of MUAV in GPS-Denied Environments...65
Figure 44 - Autonomous Navigation of Fixed Wing UAV in GPS-Denied Environment ... 65
Figure 45 - Mapping and Measurement using Microsoft Kinect ... 66
Figure 46 - 3D Terrain Mapping with a Single Digital Camera... 67
Figure 47 - Autonomous Battery Swap and Recharge Station ... 67
Figure 48 - Forest Fire Early Detection and Monitoring System Utilizing a Mesh Network ... 69
Figure 49 - V oltree Bio-Energy Platform ... 70
Figure 50 - Yamaha RMAX Small VTOL UAS... 71
Figure 51 - Autonomous Recording Units for Wildlife Monitoring ... 72
Figure 52 - Anim al Radio Tag and Receiver... 72
Figure 53 - UA S Anim al Tracking Projects... 73
Figure 54 - UA S Project for Fighting W eeds ... 74
Figure 55 - Select UAS Projects Involving Disease ... 75
Figure 56 - Experimental Multirotor-copter Equipped with LiDAR...76
Figure 57 - Major Milestone and Timeline for UAS Integration into National Airspace System[93]...77
Figure 58 - Review of International Regulation Regarding use of Commercial and Civilian UAS ... 78
Figure 59 - Field NIR Profiler for Soil Carbon Measurement ... 84
Figure 60 -Portable Foresters W ater Quality Kit ... 85
Figure 61 - Watersheds by potential for changes in water quality as a result of projected increases in housing density on private forest lands[99]... 86
Figure 62 - Illustrative Broken Cloud Patches over Forested Land ... 91
Figure 63 - Example Airborne LiDAR Mapping Technology ... 92
Figure 64 - Airborne LiDAR Flight Trajectory... 93
Figure 65 - Illustrative Dynamic Path in the Presence of Broken Cloud ... 94 Figure 66 - Example Side Profile of Forest LiDAR Data: 8 pulses per m2
vs. 0.25 pulses per m2. . . . .
Figure 67- Basic M ission Planning Calculation... 98
Figure 68 - Illustration of Sidelap and Impact on Data Collection ... 99
Figure 69 - System Elements of Adverse Weather Condition Aerial LiDAR...99
Figure 70 -W hole Sky Im ager...99
Figure 71 - Estimated per Acre Cost to Acquire and Process LiDAR Data[93]... 100
Figure 72 - Typical Fixed Cost Breakdown for Aerial LiDAR Technology... 101
Figure 73 - Analysis of Cloudy Days in Forests Surrounding Seattle...102
Figure 74 - NOAA Analysis of U.S. Average Cloud Cover ... 103
Figure 75 - Overlay of Mean Conditions on U.S Forested Regions... 103
Figure 76 - New Zealand Pine Plantation Exam ... 104
Figure 77 - Example Tree Plantation and Factors that Impact Tree Value ... 105
Figure 78 -Definition of Forest Plantation Dimensions ... 107
Figure 79 - Selection of High Performance Quadrotors... 109
Figure 80 - Estimate for Trees Measured per Flight Charge... 109
Figure 81 - Lightw eight Cam era O ptions... 111
Figure 82 - Lightw eight LiD A R O ptions ... 112
Figure 83 - T im e of Flight C am eras ... 112
Figure 84 - Proposed Platform System Design ... 113
Figure 85 -A verage Costs of Tim ber Cruising... 113
Figure 86 - Comparison of Different Seedling Stock Packaging and Classes ... 115
Figure 87 - Illustrative Deployment Strategy and Data Retrieval Strategy for Remote Soil Sensor ... 115
Figure 88 - Reforestation Decision Making Process with Regards to Temperature and Moisture ... 116
Figure 89 - Disposable Soil Moisture and Temperature Sensor Design ... 119
Figure 90 - Durable/Recoverable Soil Moisture and Temperature Sensor Design ... 119
Figure 91 - Resistive Soil M oisture Sensor Design... 120
Figure 92 - Soil M oisture Probe Options by Price ... 121
Figure 93 -R F Long D istance Transm itter ... 122
Figure 94 - Power and Communications Architecture Low Power Soil Sensor Design ... 123
Figure 95 - Forest Establishment Costs vs. Intermediate Stand Management Costs[1 10]...124
Figure 96 - Observed Variation in Seedling Planting Costs by Region[ 110] ... 125
1 Introduction and Motivation
1.1 Problem Statement and Research Objective
Over the past decade, significant progress has been made in the field of autonomous systems, including
developments in sensor networks, unmanned aerial vehicles, unmanned ground vehicles and systems of
unmanned vehicles, referred to as vehicle swarms[2]. Many of these advanced technologies are now used
in the military[3]; however, applications in the civilian and commercial sectors are still in their infancy[4,
5]. As new regulations and protocols are established to enable the integration of unmanned aerial systems
into national airspace, it is important to understand how these technologies may be applied across a
variety of industries. A better understanding may help focus academic research efforts, inform policy
makers and drive investment and innovation in the emerging field of commercial and civilian autonomous
systems.
Forestry management is one such industry anticipated to benefit from the use of autonomous systems. A
few early reports have attempted to discuss civilian applications [1, 6, 7] to forestry management;
however, more research is required to understand the true potential. This thesis attempts to address this
gap in literature by exploring the design process for autonomous systems with an emphasis on forestry
management. The methods discussed in this thesis may be applied to additional industries as part of future
research to provide a more comprehensive view of how society may benefit from autonomous systems.
This thesis begins by reviewing modem product design methods applicable to the design and
development of advanced technologies. Forestry management practices are reviewed and a number of
forestry challenges are presented based on findings from industry interviews. Three concept systems
designed to address the aforementioned challenges are presented as case studies of the initial product
design process. This thesis attempts to tie together the three interdisciplinary areas of research illustrated
in Figure 1.
Research Contributions:
e Review of product design methods for the development of autonomous systems technologies.
" Review of current "state-of-the-art" technology and research in forestry science.
" Review of current "state-of-the-art" technology and research in the field of robotics and
autonomous systems.
* Description of three new concept autonomous systems with applications in forestry management.
* Recommendation pertaining to future areas of investigation and research.
Three Research Domains
- Program - Platforms
Management Product Autonomous - Sensors
- Design Thinking D Software
- Multi-Attribute Trade Systems Integration
Space Design
- Remote Sensing
Forestry
Science - Integrated Forest Management Systems
- Geographic Information System
Figure 1 -Three Interdisciplinary Domains of This Research
1.2
Defining the Autonomous System
An autonomous system as described by this project may include multiple interacting platforms (agents), platform sub-systems, data systems, and human operators[8]. Such a 'system-of-systems' may be configured in a manner as to perform a number of functions to achieve an objective or mission. The system may include some level of autonomy or intelligence to more optimally achieve a mission goal. When an autonomous system involves more than one mobile platform, the system may be referred to as a swarming network of autonomous vehicles, or simply, a swarm. Figure 2 illustrates various elements that may comprise an autonomous system. A concept of operations may use various fixed and mobile assets, with varying degrees of automation and autonomy.
The primary advantages of autonomous systems is their ability to gather or process large amounts of information in relatively short periods of time to more optimally achieve a mission task, all while protecting humans from potentially hazardous or dangerous situations[9].
Platforms Unmanned Aircraft Systems Fixed Sensor Nodes and Node Networks Sub-Systems Communications
Sub-Systems & Interfaces (Cellular/WiFi/ ZigBee, etc) Remote Energy Management Sub-Systems & Interfaces Support Platforms Satellite Systems: (Telemetry, GPS, and Communications) Transportation and Deployment Systems Not Exhaustive Data Systems Operating Program/Control/ Software Systems Database and Information Management Systems Unmanned Ground Vehicles Imaging and Sensor Payload Sub-Systems Human Interface Systems Analysis Systems
Figure 2 - Autonomous System Elements
1.3 Research Methodology
The research methodology largely followed the Opportunity Identification and Concept Development phases from the widely-adopted six-step product design process outline in the book 'Product Design and
Development' by K.T.Ulrich and S.D.Eppinger[ 10]. The high-level process is outlined in brief in Chapter
2 of this thesis and in Figure 3. The process involved a combination of desktop research, industry interviews with forestry experts, interviews with experts in the field of autonomous systems and product
1.4
Chapter Summary
One of the most challenging yet important tasks when developing any new innovation is the identification of a customer need that could be addressed with new methods, designs or technologies. We refer to these needs as market opportunities.
Chapter 2, therefore, begins with a review of popular idea creation and product design methodologies and how they can be adapted to guide the broad challenge of identifying new commercial and civilian applications for autonomous systems technologies.
Chapter 3 explains why forestry management was selected as the focus area for this research and sets the project charter and foundation for subsequent chapters.
Chapter 4 reviews the basic tasks involved in forestry management, an important step in the ideation process. Key market segments, active areas of industry research and technology trends are reviewed. Chapter 4 may be particularly useful to readers familiar with autonomous systems technologies but unfamiliar with the forestry management industry.
Chapter 5 reviews the structure of the civilian and commercial autonomous systems markets, areas of active development and technology trends. Chapter 5 may be particularly useful to the forestry researcher unfamiliar with autonomous system technologies.
Chapter 6 discusses a number of forestry management market opportunities, identified through industry interviews and workshops.
Chapter 7 explores the top three market opportunities in greater detail and describes three proposed concept systems, used as case studies for the product design methods outlined in Chapter 2.
Finally, Chapter 8 reviews the key leamings identified during this research and recommends further areas
2
Product Design Methods for Autonomous Systems
-
.. AutonomousA product development process is a sequence of steps or activities that an e-ig systems
enterprise or team follows to conceive, design and commercialize a new
Forestry product[10]. This research utilizes the first two steps of the widely science
adopted six-step design process outlined in the book 'Product Design and
Development' by K.T.Ulrich and S.D.Eppinger[l0]. Given the goal of this research is to explore new applications and ideas for autonomous systems and not to design a full prototype, only the first two steps of the six-step process are used in this work.
2.1 The Product Design Framework
In this chapter we review the important activities for the opportunity identification and concept development design phases outlined in Figure 3. For brevity, only the most important concepts are discussed and for a more in-depth discussion the reader is referred to the text 'Product Design and Development' [101.
Six Phase Product Development Process & Select Activities by Organization Function
Opportunity Identification and Planning
I
Concept Development
Outside Project Scope
System- lDetaied Testingand
Level Design Desi Refinement
Marketing
- Articulate market opportunity Collect customer needs
- Define market segments Identify lead users Identify competitive products Design
- Consider product platform(s) and Investigate feasibility of product
architecture. concepts
- Assess new technologies Develop industrial design concepts
- Build & test prototypes Manufacturing
- Evaluate supply chain strategy Estimate manufacturing cost Other
- Provide planning goals Facilitate high level economic analysis
- Investigate legal and patent issues Source: Adapted from "Product Design and Development; 5 Edition; Ukich, Eppinger
Figure 3 - Six Phase Product Development Process by KT.Ulrich and S.D.Eppinger[10]
Other relevant design frameworks include the ten stage process of Figure 4, initially proposed in the text 'Unmanned Aircraft Systems: UAVS Design, Development and Deployment'[ 11]. Another comprehensive design methodology for unmanned aerial systems can be found in the text 'Designing
Unmanned Aircraft Systems - A Comprehensive Approach'[12]. Both approaches in the aforementioned
texts, however, are more specialized towards multi-million dollar Unmanned Aerial System projects, with emphasis on military applications. Therefore, the more generic process by K.T. Ulrich and S.D. Eppinger[10] was deemed more relevant to the task of designing commercial and civilian autonomous systems. Years: Development 0 5 10 15 20 25 30 35 40 45 50 Phases 1 Concept Design 1 2 Concept Research 3 3 Preliminary Design 2 4 Detailed Design 2
5 Specimen Test Development
6 Prototype Build & Test 2 Modifications
7 Development 3 Ope
8 Certification Modifications
9 Production 10-20
10 Support 20-30
Source: Adapted from "Unmanned aircraft systems: UAVS design, development and deployment "1st Ediion; Ausin
Figure 4 - Phases of UAS development by R Austin[111
Opportunity Identification and Planning
The objective of the opportunity identification and planning phase was to narrow the scope of the project to a particular industry, segment and market challenge. This involved building a 'fact base' to help identify market challenge 'opportunities' and understand existing products and solutions. For example, during the planning phase a market assessment of the forestry industry was conducted (Chapter 3 and 4), as was a review of the autonomous systems market (Chapter 5).
As described in the book 'Product Design and Development' [10], the planning and opportunity identification phase can be further broken into the following six steps. Each step may be mapped to a particular chapter of this thesis. A detailed explanation of each step may be found in the text.
* Establish a charter [Chapter 3]
0 Generate and sense many opportunities
Market opportunities refer to particular industry needs and not to any specific solution. Market opportunities were brainstormed with forestry researchers and autonomous systems experts during collaborative workshops.
Screen opportunities [Chapter 61
The opportunities were selected by means of a voting system during workshops. These opportunities are described in Chapter 6. Voting was based on the desirability, viability and feasibility framework. This down selection framework is illustrated in Figure 5 and is commonly associated with the 'Design Thinking' methodology initially made famous by the design firm IDEO[13, 14].
* Develop promising opportunities [Chapter 61
For each promising idea, additional background research was conducted to further validate the desirability, viability and feasibility of each opportunity.
* Select exceptional opportunities [Chapter 6 and 71
A second round of opportunity down selection was conducted in order to narrow the scope to the
top three opportunities.
* Reflection [Chapter 81
A reflection on the opportunity identification results and process is provided at the end of this
thesis in Chapter 8.
Design Thinking
Opportunity Filters:
Promising Opportunities fall at the intersection of Desirability, Viability, and Feasibility
Source: IDEO
Figure 5 - Market Opportunity Selection Filters by Design Firm IDEO [13, 14]
Concept Development Phase
The concept development phase involved ideating and developing solutions to top-ranking market opportunities. The overall concept development phase as outlined in 'Product Design and Development'
[10], follows a seven-step iterative process; however, only part of this framework was followed, given that finalizing specifications, building and testing a prototype were deemed out-of-scope.
The concept phase began with an in-depth study of the needs of the target market and customer, identified through conversations with forestry experts and research into the forest management industry.
Concept Development Process (Ulrich, Eppinger)
Mission
Statement Identify Establish Generate Select Test Product Set Final Plan --- customer Targtw Product Product 3 .ocpts +pcfcain Downstream
Needs Specifications Concepts concetoept(s) pts pcfctos Development
Perform Economic Analysis Benchmark Competitive Products Build & Test Models and Prototypes
E-
Primary Activity of ResearchSource: Product Design and Development; h Edition; Ukich, Eppinger
Figure 6 - Seven-Step Concept Development Process by KT.Ulrich and S.D.Eppinger[1O]
Customer needs are expressed as statements that capture the desirable capabilities of the system [10]. The list of needs describes the attributes of the system elicited by interviewed customers in the target market. Not all the identified needs may be technologically or economically feasible, and inherently there will be trade-offs in the design process.
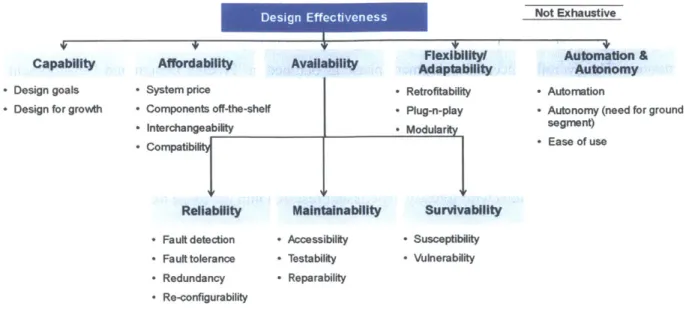
Before interviewing industry experts, it was useful to first design a generic requirements tree for an autonomous system, as illustrated in Figure 7. A similar tree is proposed in the report "reconnaissance surveillance vehicle" Sakamoto 2004[15].
De-g EffectotiExhustiv
Capability Affordability Availability Fibxlfty Automation &
Adaptability Autonomy
- Design goals - System price - Retrofitability - Automation
- Design for growth - Components off-the-shelf - Plug-n-play - Autonomy (need for ground
. Interchangeability - Modular segment)
- CompatibiF - Ease of use
Reliability Maintainability Survivability - Fault detection - Accessibility - Susceptibility . Fault tolerance . Testability - Vulnerability - Redundancy - Reparability
* Re-configurability
Figure 7 - Illustrative System Requirements Tree - Adapted from Sakamoto[151
Designing the System
The system-level design phase includes the definition of the product architecture, decomposition of the
product into subsystems and preliminary design of components. Whilst a detailed system level design is
considered out-of-scope for this project, it is useful to preview common approaches and how they relate
to the development of an autonomous system product. The output of this phase usually includes a
geometric layout of the product, a functional specification of each of the product's subsystems, and a
preliminary assembly and manufacturing strategy.
The system level design phase is often associated with multiple design trade-offs with regards to meeting
the desired customer needs and balancing with price requirements. There are many potential approaches
to evaluating design trade-offs for an autonomous system. For example, one approach is illustrated in
Figure 8. The trade-off methodology of Figure 8 is a modified version of the approach highlighted in the
report "reconnaissance surveillance vehicle" Sakamoto 2004[15] for the design of military UAS systems.
The methodology attempts to balance Design Utility (U), Development Risk (R) with Average
Procurement Unit Cost (APUC).
Design Utility is a measure of how well the system design meets the specified goals or customer
requirements. Design Utility is often expressed in mathematical terms as a function of the actual
performance versus desired performance as expressed by Equation 1. A Design Utility of 100 per cent
means that all functional requirements/specified goals can be met by the proposed system design.
Design Utility =
f(Actual
performance, Desired Performance)Design Utility = Actual ) ( Actual CActual X psm AGoal BGoal CGoal
Equation 1 - Design Utility for Autonomous System
A =Objective 1 i.e. coverable area per day (acres)
B = Objective 2 i.e. LiDAR point density (points per M2
)
C = Objective 3 i.e. Maximum measurement error (range resolution in mm) Ps = Survivability i.e. %probability of incident per mission
m = Number of missions per time frame i.e. missions per year
rifex
= System flexibility or usability i.e. qualitative <= 1p, q, r = Weighting exponents <= 1
Project Risk is a measure of all underlying risk that may jeopardize the success of the project. Risk can be broken down in a number of ways, such as schedule risk, technical risk, cost risk, supplier risk, etc.
Similarly, risks can often be numerically defined and expressed in mathematical terms.
Risk = [(Schedule Risk, Technical Risk, Cost Risk)
Equation 2 - Risk for Autonomous System
Average Procurement Unit Cost (APUC) is a measure of the total cost per unit of a system. Total procurement cost includes all recurring and nonrecurring costs associated with production of the system such as hardware/software, systems engineering (SE), engineering changes and warranties, in addition to the costs of procuring technical data, training, support equipment and initial spares. If the APUC of a proposed system design exceeds the willingness to pay of the average customer, then the system design
Concept Development
Y
Include in comparison List System Concepts System Analysis
Design Utility Against Syste Concpt 1Requirements
Syste C onc pt 1Avera
e Procurem ent Unit Systm Cocept2 Cot (AUC)APUC
$Max
Risk Assessment
SystemCocpN
Non-Recurring Engineering
(NRE)
Firm Experience Designin Complex Systems
Relax Performance Goals |
Concept System Trade Study Results
System Option #1: Option Description:Sub-System Design Utility Unit Price Non-Recurring RISK
Descriptions Content Engineering
(Software & Hardware) Vehicle Segment Sensor/Payload Subsystems Power Management Sub System Mission Control Equipment Launch & Recovery Equipment - Total: U E [0,1) $MM $MM Rfe [0.1]
System Selection
Ill Design Utility i1 il IIIRisk NRE APUC
Design Utility = 100% -> Meets all functional requirements/specified goals Risk = 0 -> no Risk
Figure 8 - Design Process for Complex System - Adapted from Sakamoto 2004[151 Technical Goals
Price
Requirement ($x m/system)
Figure 8 illustrates one potential iterative system level design approach. A set of N potential designs are developed. For each design, an analysis of Utility, Risk, APUC, and Non-Recurring Engineering Costs (NRE) is assessed. Designs that exceed the maximum allowable per unit cost are either dismissed or re-evaluated based on relaxing performance objectives. Detailed system trade studies are conducted for each potential design. In Figure 8, Design Option III is considered the best option with greatest design utility, low risk, and low development cost (NRE).
2.2 State-of-The-Art System-of-Systems Design Methods
Multi-Attribute Tradespace Exploration
In terms of 'state-of-the-art' methods pertaining to the design and development of autonomous system solutions, the Multi-Attribute Tradespace Exploration method (MATE) is a promising new approach [16,
17]. The method was first proposed by researchers at the Massachusetts Institute of Technology and the
Charles Stark Draper Laboratory. The methodology attempts to address a number of issues faced by traditional heuristic approaches (such as the method described in section 2.3), by attempting to quantify disparate design parameters and disparate stake-holder needs, into a common tradespace to allow the consideration of a larger and more complete set of design altematives[17, 18].
One of the greatest advantages, but also greatest challenges, of autonomous systems technologies is their
incredible flexibility. For example, a particular surveillance challenge may be solved using several disparate technologies: satellite, aircraft, unmanned air vehicle, swarms of unmanned air vehicles, and fixed sensor networks. All of the above technologies and combinations thereof, represent possible system concepts to achieve the same surveillance
mission objectives. Traditional system
level design approaches struggle to s New S-:t S
quantify differences in the approaches
-with respect to stakeholder requirements. C onnt andtfc Levul of EachCopnt
Multi-Attribute Tradespace Exploration RveE- c
enables such disparate systems concepts to "
Analysi Se ct Vatu e pc Legcy
be compared on the same 'tradespace', Dign
enabling decision makers to quantitatively
gf
andcompare disparate systems concepts on a -' for ECcnpn
Eve strins o Ocj&I e Context Change
common performance and cost basis. The
Concept Surveillance Architecture'[19] demonstrates the approach by employing the Multi-Attribute Tradespace Exploration method to the design of a disaster surveillance system.
Whilst the application of the Multi-Attribute Tradespace Exploration method to this work is out-of-scope, it is worth mentioning here as a potential area for further investigation.
Selecting Levels ofAutomation and Levels ofAutonomy
An important design challenge when developing a new autonomous system is deciding on the most efficient level of automation and autonomy. In general, as automation and autonomy increases, so does the particular design utility, however, so does the project risk and development cost. Therefore, there are inherent design tradeoffs that are unique to autonomous systems that must be considered in any-state of-the-art design methodology. As of yet, the multi-attribute tradespace framework does not explicitly
address possible levels of automation and autonomy.
Based on a literature review, theory regarding the efficient choice of automation and autonomy for autonomous systems is still in its infancy and should be considered an important area for future research. In this section we describe a few general considerations based on the little available literature and discussions with automation experts.
When defining automation, we refer to the required degree of human supervision or input as illustrated in Figure 10. In supervisory control, a human operator monitors a system and intermittently executes some level of control on a process, acting on some subset of automated agent in the system. For example, a controller may undertake one or more of the following actions as defined by Sheridan 1992[20, 21]:
- Develop and input the desired plan for the mission
- Monitor the execution of the plan
- Intervene when the system makes a mistake or requires assistance
Data
= Information
[
ox = System Transfer Box J ElementFigure 10 - Human Supervisory Control Architecture - Adapted from Sheridan, 1992 [21]
In supervisory control of autonomous systems, various levels of automation can be introduced into the decision support system. A system may be described as fully automated when an operator is not required in the decision process, and described as minimally automated when the operator provides most or all of the control input with little to no assistance from the computer controller. When designing a new system, it is often a challenging task to articulate how automated the design is. As a starting guideline, Sheridan & Verplank 1978[22], propose the following set of discrete and generic automation levels that can be adapted to any decision support system, including most autonomous systems.
Table 1 - Levels of Automation - Sheridan & Verplank 1978 [221
I Computer offers no assistance: human must take all decision actions.
2 The computer offers a complete set of decisions/action alternatives or ...
3 Narrows the selection down to a few,or ... 0
4 Suggests one alternative, and ...
E 0
5 Executes that suggestion if the humanapproves, or ...
0) 6 Allows the human a restricted time to veto before automatic execution, or ...
7 Executes automatically, then necessarily informs humans, and...
8 Informs the human only if asked, or ...
9 Informs the human only if it,the computer, decides to.
10 The computer decides everything and acts autonomously, ignoring the human.
is possible in complex autonomous systems. In particular, systems that involve multiple interacting agents/nodes, such as individual UAS in a swarming network, require additional automation related to intra-vehicle autonomy. We refer to this intra-vehicle related automation as the systems autonomy. Cummings proposes that autonomy can be similarly described by discrete and generic levels as defined in Table 2. At the minimum level of network autonomy, there is essentially no collaboration between system agents/nodes. At the maximum network autonomy, agents are in full collaboration and need no human intervention for emergent behavior[9]. Cummings argues that autonomy can be independent of automation. For example, it is possible to have a system with high autonomy (i.e. vehicles remain in a cooperative formation at all times), but with little independent decision making capability/automation (i.e. human remains in control at all times to direct the swarm).
Table 2 - Levels of Autonomy - Cummings 2004[9]
Vehicles/Nodes do not communicate with one another and follow original tasking unless
E~ human identifies a new task 0
C 0
2 Vehicles communicate with one another for separation and threat deconfliction but still
depend on human for new tasking.
z3
Vehicles collaborate with one another and the human only interacts with the "lead"M> unmanned vehicle.
C
cu
Vehicles are in full collaborative communication, and individual vehicle tasking changes
c according to a predetermined algorithm. There is no human intervention
Research into identifying efficient levels of system automation and autonomy is still relatively new. Much research has been conducted into determining what levels of automation promote efficient human computer interaction in simple decision control systems[20], however, little research has been conducted on the human-interaction with swarming autonomous systems[9]. Furthermore, little research links designated automation and autonomy to the systems economics. The thesis "Business Case Assessment of Unmanned Systems Level of Autonomy" Liu 2012[23] makes an initial attempt at developing a framework for evaluating autonomy and automation.
In the section we propose a simple and more generic four-step process to identifying efficient levels of automation and autonomy.
Step 1: The first proposed step when deciding on the efficient level of automation and autonomy is to
articulate the objective for the automation. In particular:
I. Value of operator time: Increasing levels of automation and autonomy may reduce the level of human input required to achieve a particular objective
II. Value of operator skill: Increasing levels of automation and autonomy may reduce the skill level or training required to operate the system
III. Value of system flexibility: Increasing levels of automation and autonomy may increase the range of applications to which the system may be applied. Note that in some cases increasing levels of automation may also reduce the system's flexibility
IV. Value of human safety: Increasing levels of automation and autonomy may protect the human operator from the need to venture into a potentially hazardous environment
V. Value of reliability, safety, or other: Increasing levels of automation and autonomy may increase the reliability, system safety, or other desirable feature of the system
Step 2: The second step to evaluating automation and autonomy is to articulate the feasible design levels.
Table 1 and Table 2 may act as an initial guideline for defining the possible levels of automation and autonomy; however, these generic definitions may need customization to the specific application.
Step 3: The third step is to identify the potential R&D investment required for the various levels of
automation and autonomy.
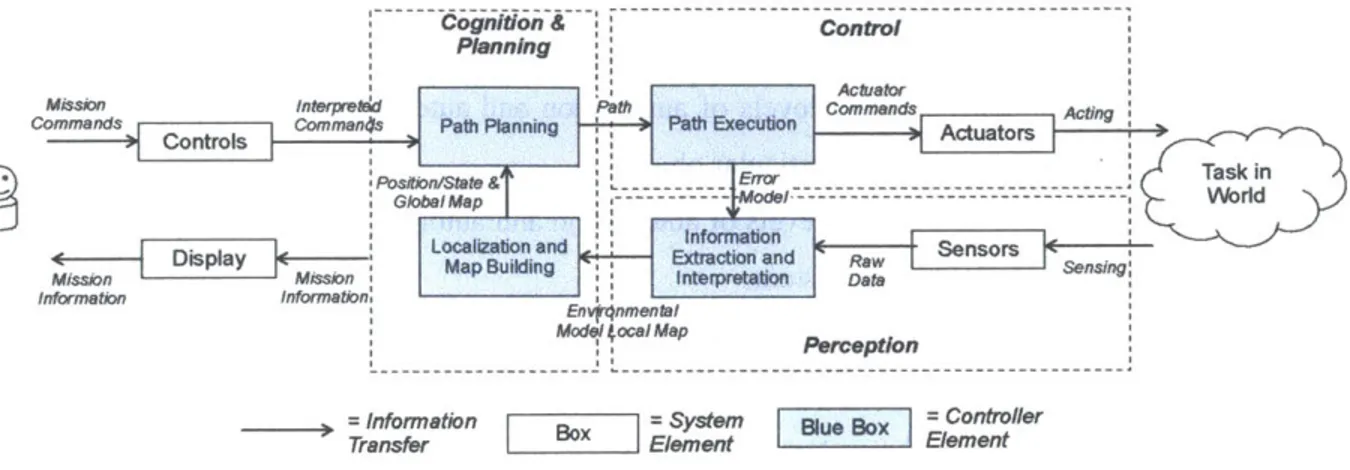
One proposed method for evaluating the R&D complexity is to break down the Human Supervisory Control Architecture of Figure 10 into component automation tasks. The textbook "Introduction to Autonomous Mobile Robots"[8] proposes a reference architecture involving the following component tasks: path planning, path execution, localization and map building and information extraction. In Figure 11 we combine the supervisory control architecture of Figure 10 with the autonomous mobile robot architecture to better understand the different aspects of automation and autonomy.
The levels of automation can be broken down into levels of complexity for each of the four component automation tasks. Some component tasks are more difficult to automate than others. For example, many perception tasks involved in the information extraction step of Figure 11 may be more challenging than
impossible to fully automate with today's technology[8]. Breaking down the various levels of automation into the four automation tasks can thus better inform the overall R&D challenge and thus estimated investment required.
Planning
Mission in Pth Commands Acng
Commands Controis Path Planning Path Execution Actuators
Misse Misin teprta
O
DtPondAon'State a ... Enro Task in
Informaton Informaton
ocaMap Perception
J = Information |n= System = Controller
Transfer | Element Element
Figure 11 - Revised Human Supervisory Control Architecture
Step 4: The fourth step involved in the evaluation process is to quantify the link between the defined
levels of automation and autonomy with the automation objectives defined in Step 1.
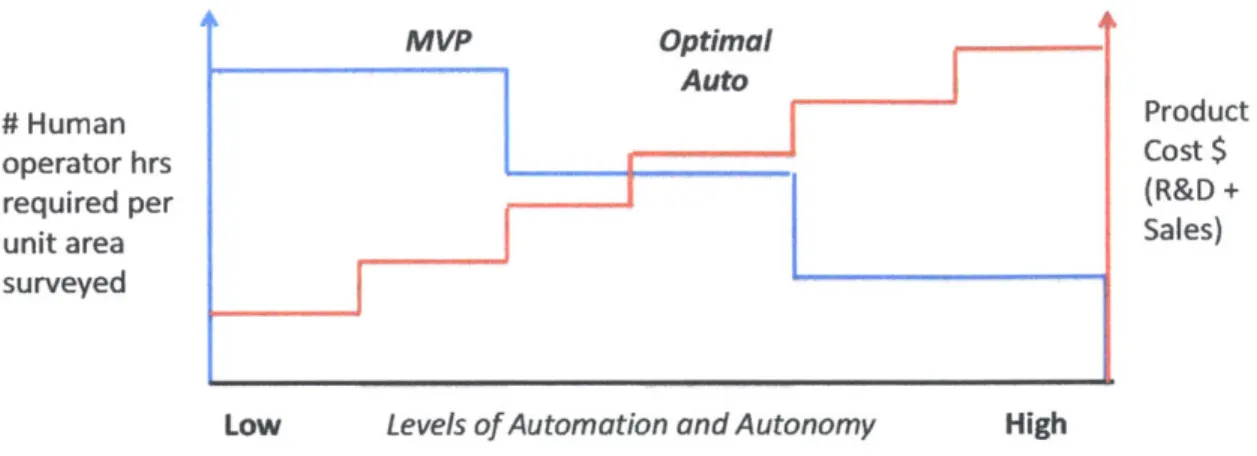
Figure 12 helps to illustrate Step 4 in graphical form for a generic forestry application. On the left hand
axis we use the metric of "number of human operator hours required per unit area of forest surveyed" as the primary value metric. As automation and autonomy increases, the number of human operator hours decreases in discrete intervals. On the right hand axis, we define the cost of increasing levels of automation and autonomy by the associated R&D and production costs. As automation and autonomy increases, the cost per system increases as a stepwise function. The economic design optimum may be considered as the intersection of these two functions.
In Figure 12 we also define a level of automation corresponding to the minimum viable product. When designing any new product it is important to identify the minimum level of functionality required for any early adopter to purchase. This minimum is often referred to as the minimum viable product. For an autonomous system, the minimum viable product consists of both a minimum level of functionality and a corresponding minimum level of automation and autonomy. The first product release should in theory be designed to the minimum viable product specification in order to minimize risk. Subsequent product generations and releases should progress towards the economic optimum level of automation [24].
# Human
operator hrs required per unit area surveyed
Low Levels of Automation and Autonomy High
MVP = Minimum Viable Product
Optimal Auto = Optimal level of automation & autonomy based on the economics
Figure 12 - Design Trade-offs as a Function of Automation and Autonomy
Product Cost $ (R&D + Sales)
3
Project Charter and Scope
The innovation charter articulates the goals of the design project and establishes the boundary conditions for the project. The final charter and scope for this research was agreed as:
"To identfy product concepts for the North American commercialforestry management market that assist monitoring and inventory analysis activities, utilizing existing autonomous systems technologies."
Mission Refined Refined Refined Refined
Statement Statement Statement Statement Statement
To identify and explore ... in the Forestry ... in the for profit ... addressing Physical designs should new commercial and Management commercial challenges with use only existing civilian applications industry sector of the inventory technologies, adhere to (market opportunities) North American analysis and anticipated UAS
for multi-vehicle forestry remote regulation, and be
autonomous systems Management monitoring simple enough such that
technologies ... Industry activities a proof of concept could
be built within 1-2yrs
Which -Which Which -Subject to:
Industry? Industry Pmblem/ o Technology
Segment? Act ily? Constraints
-Which o Regulatory
Customer? Constraints
o Business Constraints,
FIgure 13 - Refinement Phases of the Mission Statement
3.1 Identifying the Target Market and Defining Project Constraints
Which Industry?
The forestry industry was selected as the primary focus for this study for three reasons:
1. Based on estimates by industry experts[5], the forestry and agriculture industry is expected to
become the third largest market for commercial and civilian unmanned systems - see Figure 14. 2. A number of companies are attempting to address market needs in the two largest expected
segments, including government and fire services, and precision agriculture. In contrast, little work has been conducted on the application of autonomous systems to forestry management.
3. Based on preliminary discussions with a leading US forestry management company, there is an expressed need and interest in developing autonomous systems technologies for the forestry industry. This need is driven by growing pressure to increase productivity and reduce costs associated with monitoring and nurturing millions of acres, as a result of increased international
Why Forestry Management:
* Agriculture and Forestry
expected to become third largest
market for civilian unmanned
systems
* North America has 740million
acres of forest.
* The North American Forest
Services industry generates
-$1.7b/year in revenues.
Market Expectation for Relative Size of
Civilian Unmanned Systems Markets (%)
A ri
Earth Communications &
Observation Broadcasting Energy Sector7 10%
ultu1reaL
6% Govem*-Forestries
ment
Fire Services Data Sources: Frost & Sullivan, Ibis World, U.S.Dept. of Agriculture,FAA 10 Year plan
Figure 14 - Civilian and Commercial Autonomous Systems Market by Projected Relative Shares
Which Geographic Boundary, Industry Segments, and Target Customer?
Based on data presented in Figure 15 and Figure 16, the North American commercial forestry
management market was selected as the primary focus for this thesis. The USA and Canada are the two
largest producers of timber by value in the world, accounting for approximately 40 per cent of the world
industrial roundwood market by value (Figure 15).
The forestry industry in the USA and Canada are deemed early adopters for new forestry technologies
when compared with the rest of the world. For example, due to technology and sophisticated management
practices, the USA is nearly eight times more productive, in terms of employees per m
3of timber
produced, than Russia, the third largest timber producing country by value
-
see Figure 17. Thus,
although government regulations involving the use of unmanned autonomous systems are more stringent
in North America, the success of any new advanced forestry management product will be reliant on North
American adoption.
Whilst there is a significant need for improved technologies in public forestry management, the
commercial segment outspends the public sector by approximately 6 to 1 per acre on forestry monitoring
activities. Therefore, the private commercial sector was designated as the primary focus.
Production By Value
(Billions of USD$/year,%) Production By Volume(Million of m3,%)
26% 23 16% 13 5% 3% 3% 3% 4 E 3 3 3 3% 3E 3% 3 38% 32 USA Canada China Sweden Russian Fed. Finland Germany Brazil Rest of World MEEMIMM=481 Mil 214 4%64 S76 = 135 5551 [#59 117 571
Source: FAOStat Report 2010
Figure 15 - Industrial Roundwood Production by Top Producing Countries
Estimated Spend on
Inventory Analysis
Tasks ($mlyear in 2011)
248 Federal National Forest System (NFS) Forests Primary Product Forestry Industry Forests (69*)Size of Forested
Area (millions of
Acres)
262 Federal National Forest System (NFS) Forests Primary Product Forestry Industry ForestsThe primary forest
products industry
spend approximately
six times more per
acre on inventory
analysis activities than
forests under manager
by the National Forest
System (NFS)
Data sources:
(1) FIA Financial Report 2011
2 Environmental Protection Agency, Facts and Figures; www.epa.govloeacaagctforestry.html Figure 16is -eprts USFoetIvnoy531A 23111, 321v21 32191, 32199b, 32211
Figure 16 - U.S. Forest Inventory Analysis Funding vs. Commercial Forestry Sector
27% 12% 4% 4% 8% 3% 3% 7% 32%
Employees working in Roundwood production per
primary production (2005) employee (2005)
(000 of employees) (m3/FTE/year) (US$/FTE/year)
India(mostly
India 6,188 49 $2,170 Fuelwood)
China 1,203 96 $6,859
Russian Fed. 444 415 $18,379
(mostly
Viet Nam 239 118 $2,394 Fuelwood)
USA has 8 times
USA 160 3149 $143,420 greater
productivity per FTE than Russia Source: FAOStat Report 2010
Figure 17 - Employees Working in Forestry
Which Activities?
Remote monitoring and inventory analysis, including the detection of insects and disease, was selected as the primary focus of investigation.
Based on qualitative discussions with forestry experts, remote monitoring and inventory analysis involve high value activities that could benefit from autonomous systems technologies - see Chapter 6 for additional discussion.
Based on rough estimates, forest monitoring and inventory analysis services roughly account for approximately 40 per cent of the $1.7 billion forestry services market in the United States alone. This includes both remote monitoring and field data collection for Timber Resource and Mapping, Forest Pest Control, and Forest Science Research - see Figure 18.
U.S. Forest Support
($m, U.S. 2011)
$1,698m Timber Resource
Estimating & Mapping
Reforestation and 170 General Consulting Forest Pest 204 Control (12%) Forest Fire 204 Fighting (12%) Forest Product Marketing Forest Economics and Industry Research
Forest Science Research
Key Activities
Use remote sensing and computerized geographic information systems (GIS) to establish the quantity and quality of timber resources studied within a particular tract of forestland
Provides advice on new plantations (including selection of seedlings), and long term forest planning, such as the planning of access roads
Specialize in the detection of insects and invasive species and the activity of overhead spraying
Mostly advise on fire risk reduction strategies and fuel loading reduction services to public forests
Undertake analysis of future sales opportunities with downstream markets to advise on log production levels and production planning schedules
Provides research on the commercial aspects relating to the forestry, logging and wood products industries (i.e. financial analyst reports on downstream products, specialized accounting and legal services).
Mostly involved in field research to collect data on a wide range of issues, from conservation biology to managing forests for sustainably producing timber, while protecting wildlife and waterways . Industry operators also measure soil biology and nutrient cycling in order to optimize timber growth
= High potential service segments for advanced technologies. Segments involve significant
spend on field data collection and remote sensing.
Source: Ibis Reports: 11311, 11331, 11531, 23111, 32121, 32191, 32199b, 32211
Figure 18 - U.S. Market for Forest Support Services
Subject to What Constraints: Technology
Constraints,
Regulatory Constraints, Business
Constraints
Whilst no strict constraints were enforced during the concept development phase of this project, it was
useful to enforce a few commonsense limitations:
*
Technology: Concepts systems must only use existing technologies or capabilities. Early stage
technologies were allowed during concept ideation, subject to evidence of active development
and testing in the academic community, and subjective opinion by autonomous systems subject
matter experts.
* Regulatory: Concept systems should not include technologies that will be restricted by
government legislation for the foreseeable future. For example, the use of high altitude unmanned
autonomous systems (UAS) will continue to be prohibited under the proposed 2015 Federal Aviation Administration regulations involving the integration of UAS into National Airspace.
0 Timeline: Ideally, the concept designs should be simple enough for a proof of concept to be developed within a two-year window, subject to appropriate resourcing and funding.
4
Industry Review
-
Forest Management
Product AtonomouDesign Systems
Forestry management is a complex and evolving science and practice with vast scope. This chapter aims to introduce forestry management, and more generally, the forest products industry. By analyzing the various segments, activities, stakeholders, and technology trends, we highlight the most
appealing sub-segments for innovation - our 'beach head' market. Furthermore, by reviewing common forestry management activities and practices, we develop an understanding of where new technologies may be applied. For a more comprehensive introduction into forestry management, the reader is referred to an introductory textbook such as: 'Introduction to Forest Science'[26] or 'Global Forest Resource
Assessment 2010'[27] published by the United Nations Food and Agriculture Organization.
4.1 Industry Structure and Market Trends
Defining Forestry Management
Forests cover a third of our planet's land area[27], or approximately 40 million km2. Forests provide raw
materials, maintain biodiversity, protect land and water resources, provide recreational areas and play a critical role in climate change mitigation. At the same time, forests are affected by fire, pollution, pests and invasive species, and are often the primary targets of agricultural and urban expansion. Forests are heavily exploited, and it is becoming increasingly important to manage them more sustainably.
Forestry management is the science and craft of creating, managing, harvesting, conserving and repairing forests and associated resources in a sustainable manner[26]. A forester is a person (typically with a university qualification) who practices this science. Foresters engage in a broad range of activities, including timber harvesting, ecological restoration and management of protected areas.
![Figure 3 - Six Phase Product Development Process by KT.Ulrich and S.D.Eppinger[10]](https://thumb-eu.123doks.com/thumbv2/123doknet/14049626.460018/16.918.105.804.571.905/figure-phase-product-development-process-kt-ulrich-eppinger.webp)
![Figure 6 - Seven-Step Concept Development Process by KT.Ulrich and S.D.Eppinger[1O]](https://thumb-eu.123doks.com/thumbv2/123doknet/14049626.460018/19.918.101.776.369.564/figure-seven-step-concept-development-process-ulrich-eppinger.webp)