The carbon star IRC+10216: linking the complex inner region with its spherical large-scale structures
6
0
0
Texte intégral
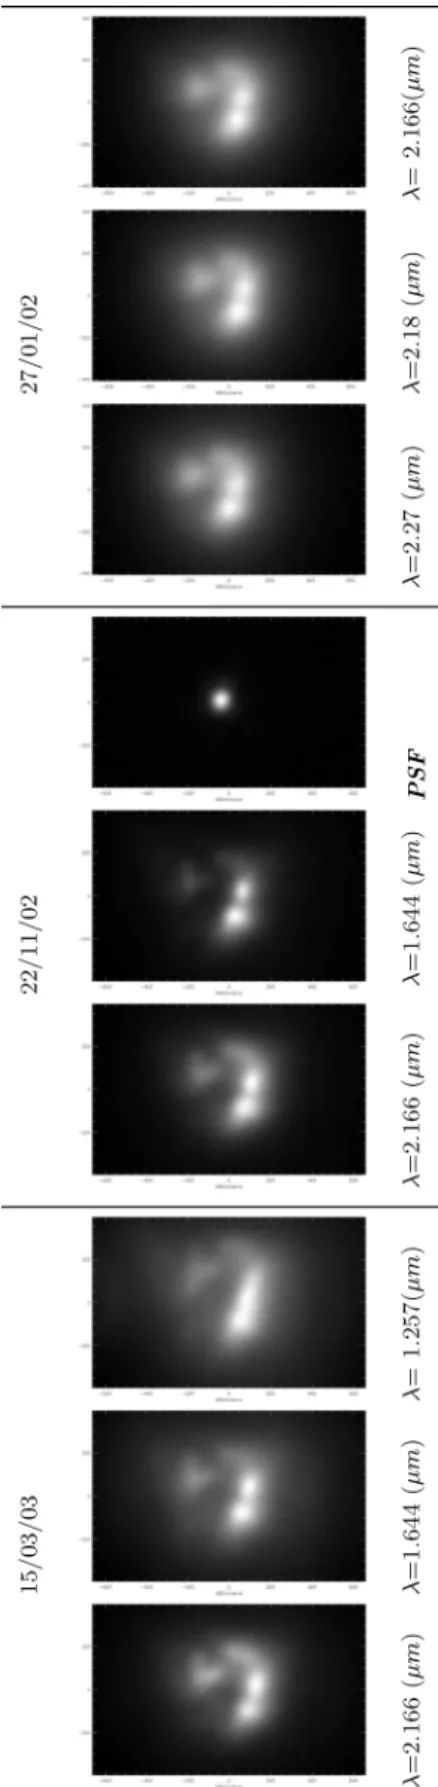
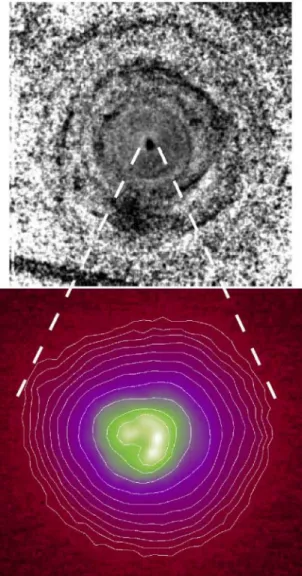
Figure
Documents relatifs