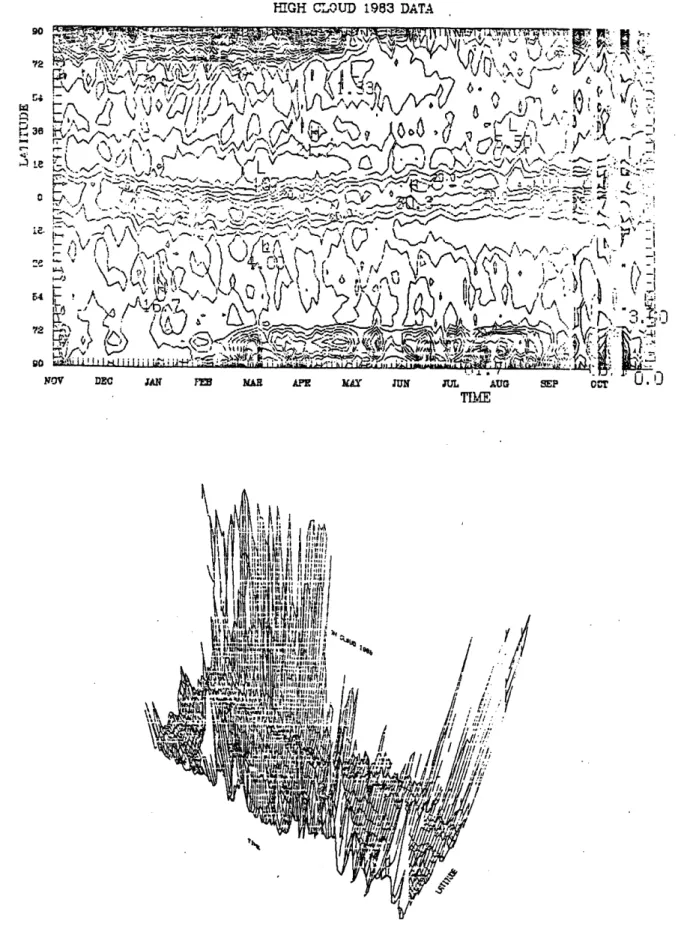
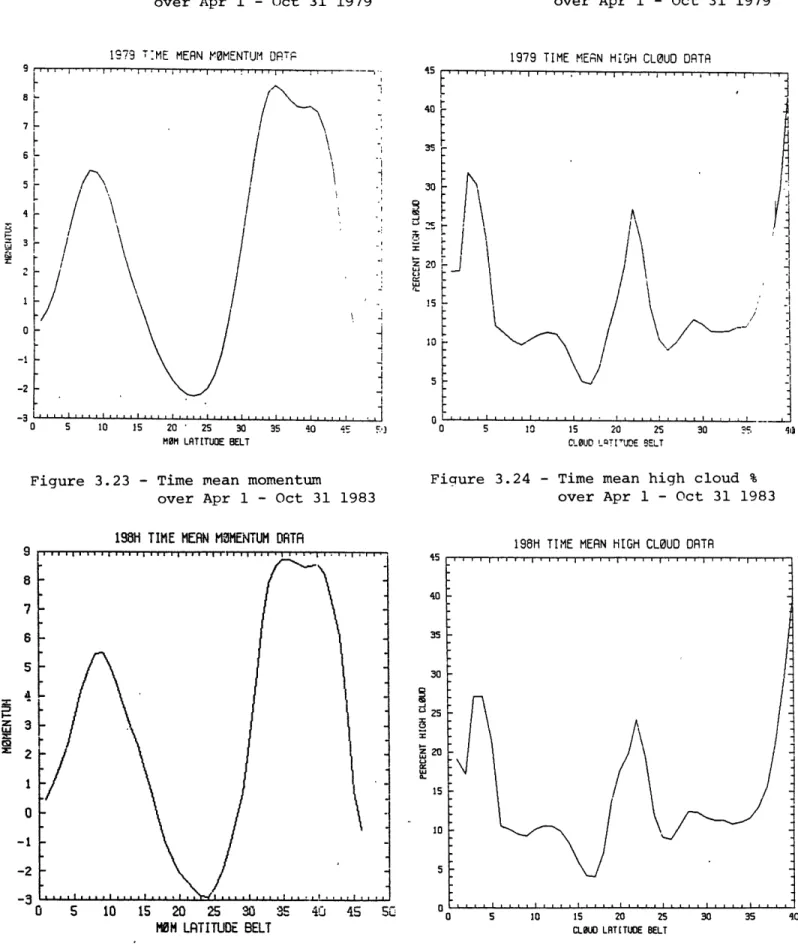
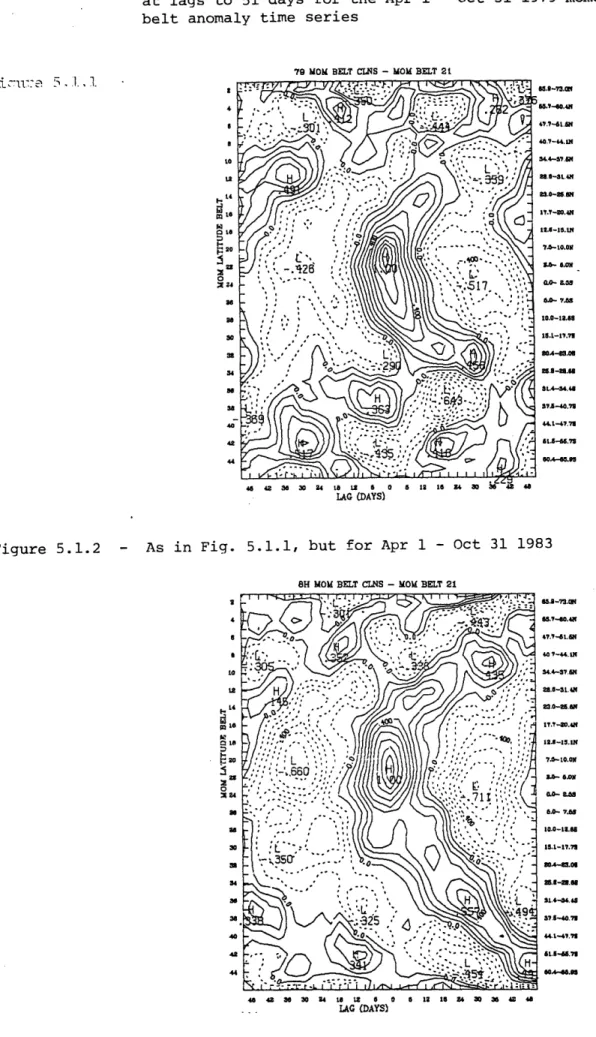
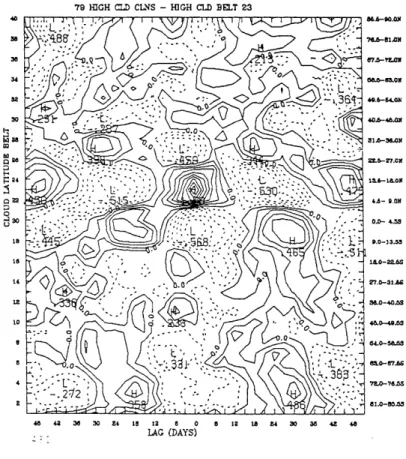
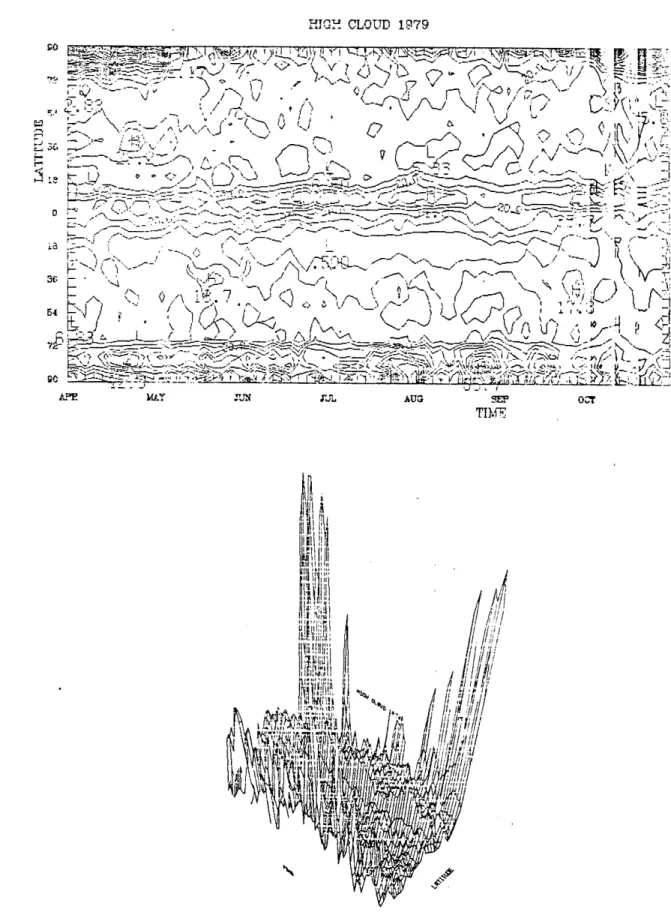
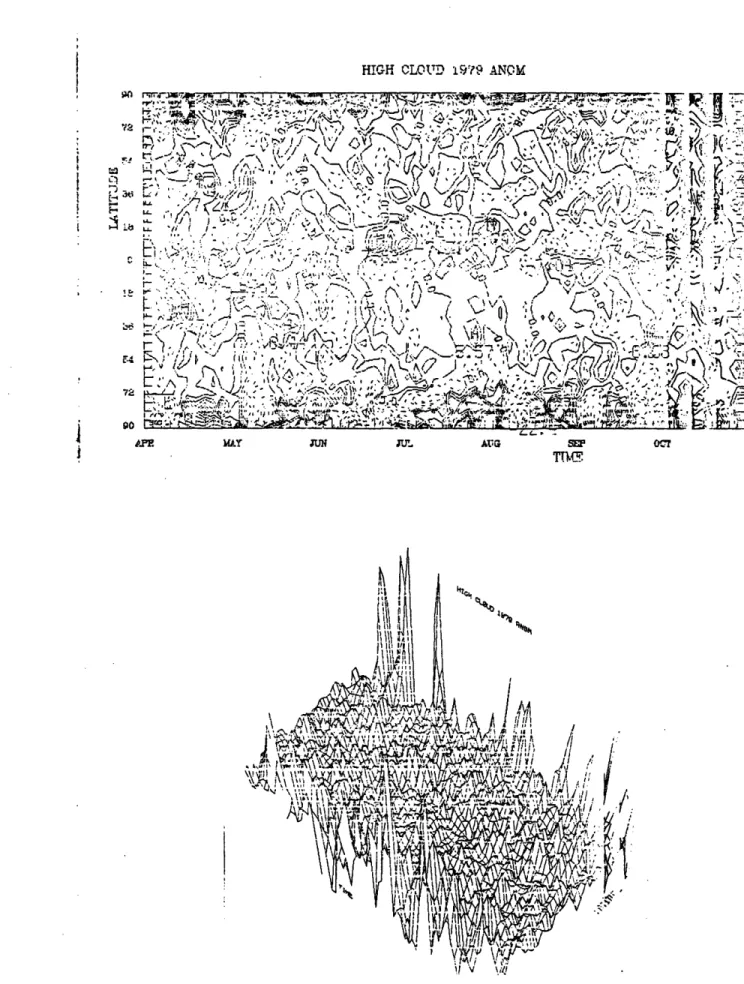
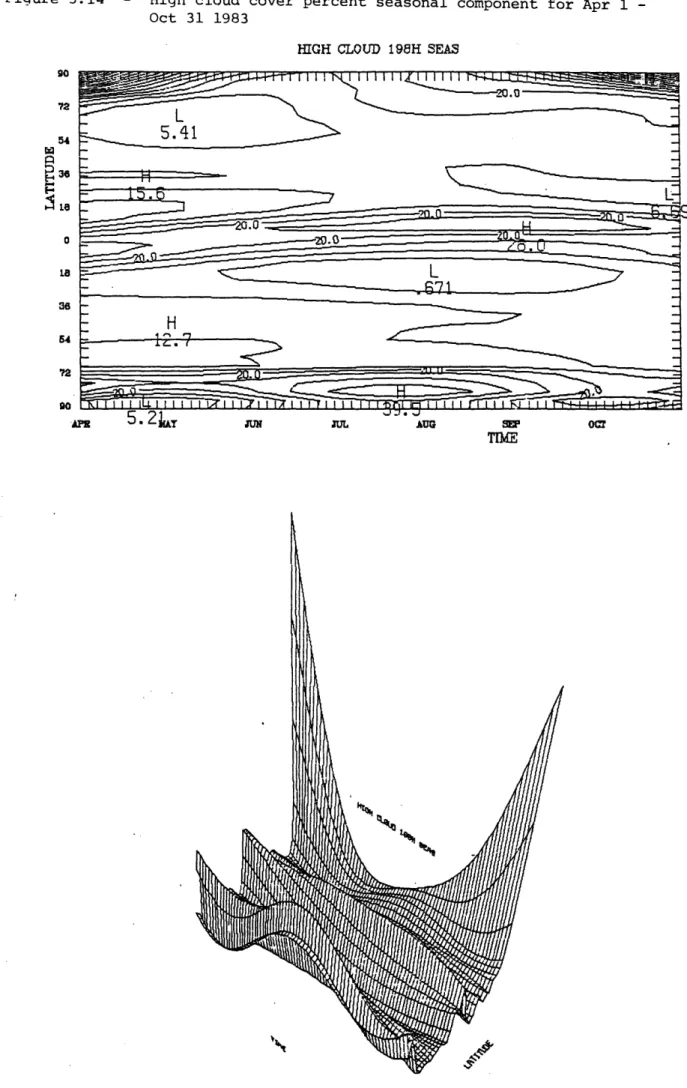
An analysis of zonal mean atmospheric angular momentum and high cloud cover : periodicities, time-latitude structure, and cross correlations
Texte intégral
Figure

Documents relatifs
Nevertheless, our lower and upper bounds show that the relationship between cover time and broadcast time is substantially stronger than the relationship be- tween any of
In order to satisfy the ice information requirements of the navigation officer on a vessel transiting through ice covered waters, an ice navigation system must be able to integrate
Evolved neuromodulatory GRNs train RL agents that consistently have improved generalization abili- ties relative to RL agents trained with fixed parameter sets on the coverage
Good research practices for compara- tive effectiveness research: approaches to mitigate bias and confounding in the design of nonrandomized studies of treatment effects using
In order to determine the material buckling of the MIT Graphite Exponential Pile, when fully loaded with fuel the neutron flux was found using indium foil activation. The indium
d'élever cette espèce au rang de caractéristique du Crithmo-Staticion. Ce faisant, nous rejoignons l'ancienne conception de Ch. Cineraria maritima, Passerina
In the first two applications of this model (Chapters 3 and 4), we have found that, for example, the specific star formation rate of the star-forming galaxies correlates strongly
(Received 24 August 2015; revised manuscript received 3 October 2015; published 21 October 2015) We calculate the thermoelectric power (or thermopower) of many semiconducting
