Publisher’s version / Version de l'éditeur:
Journal of Polymer Science, Part B: Polymer Physics, 43, February 3, pp. 276-279, 2005-02-01
READ THESE TERMS AND CONDITIONS CAREFULLY BEFORE USING THIS WEBSITE.
https://nrc-publications.canada.ca/eng/copyright
Vous avez des questions? Nous pouvons vous aider. Pour communiquer directement avec un auteur, consultez la première page de la revue dans laquelle son article a été publié afin de trouver ses coordonnées. Si vous n’arrivez pas à les repérer, communiquez avec nous à [email protected].
Questions? Contact the NRC Publications Archive team at
[email protected]. If you wish to email the authors directly, please see the first page of the publication for their contact information.
Archives des publications du CNRC
This publication could be one of several versions: author’s original, accepted manuscript or the publisher’s version. / La version de cette publication peut être l’une des suivantes : la version prépublication de l’auteur, la version acceptée du manuscrit ou la version de l’éditeur.
For the publisher’s version, please access the DOI link below./ Pour consulter la version de l’éditeur, utilisez le lien DOI ci-dessous.
https://doi.org/10.1002/polb.20319
Access and use of this website and the material on it are subject to the Terms and Conditions set forth at Glass transitions and mixed phases in block SBS
Masson, J-F.; Bundalo-Perc, S.; Delgado, A. H.
https://publications-cnrc.canada.ca/fra/droits
L’accès à ce site Web et l’utilisation de son contenu sont assujettis aux conditions présentées dans le site
LISEZ CES CONDITIONS ATTENTIVEMENT AVANT D’UTILISER CE SITE WEB.
NRC Publications Record / Notice d'Archives des publications de CNRC:
https://nrc-publications.canada.ca/eng/view/object/?id=9563ad41-c8b8-4779-a661-a0e487921c40 https://publications-cnrc.canada.ca/fra/voir/objet/?id=9563ad41-c8b8-4779-a661-a0e487921c40
Glass transitions and mixed phases in block SBS
Masson, J-F.; Bundalo-Perc, S.; Delgado, A.
NRCC-47658
A version of this document is published in / Une version de ce document se trouve dans: Journal of Polymer Science, Part B: Polymer Physics, v. 43, no. 3, Feb. 2005, pp. 276-279
Doi:10.1002/polb.20319
Glass transitions and mixed phases in block SBS
J-F. Masson*, Slađana Bundalo-Perc and Ana Delgado
Institute for Research in Construction, National Research Council of Canada *To whom correspondence should be addressed. Phone: (613) 993-2144.
Fax: (613) 952-8102. E-mail: [email protected]
Abstract
Differential scanning calorimetry (DSC) does not allow for easy location of the glass transition temperature of the polystyrene (PS) block in styrene-butadiene-styrene (SBS) block copolymers. Modulated DSC (MDSC), which deconvolutes the standard DSC signal into reversing and non-reversing signals, was used to locate the glass transition temperature (Tg) of both the polybutadiene (PB) and PS blocks in SBS. The Tg of the PB block was sharp at –92°C, but that for the PS blocks was extremely broad, from –60 to 125°C with a maximum at 68°C because of blending with PB. PS blocks were found only to exist in a mixed PS-PB phase, which concurred with the results from dynamic mechanical analysis. Annealing did not allow for a segregation of the PS blocks into a pure phase, but allowed for the segregation of the mixed phase into two mixed phases, one was PB-rich and the other PS-rich. It is concluded that three phases coexist in SBS: PB, PB-rich and PS-rich phases.
Keywords: styrene copolymer, SBS, calorimetry, modulated DSC
1. Introduction
Styrene-butadiene-styrene (SBS) is considered a two-phase thermoplastic block copolymer in which spherical polystyrene (PS) domains are dispersed in a polybutadiene
(PB) matrix 1,2. The copolymer is commonly blended and it is often desirable to assess the degree of blending of the individual blocks with the blending material(s). In principle this may be assessed by a shift in the glass transition temperature (Tg) of the PS or PB blocks upon blending, but in practice a shift may be difficult to measure. The Tg of the PB block (TgPB) is sharp, around –90°C as measured by DSC 3,4, but the Tg of the PS block (TgPS) is weak and subject to interpretation. For instance, Spaans et al.3 measured TgPS at 60°C, some 40°C lower than for homopolymeric PS (hPS), but Létoffé at al.4 observed an endotherm at 50-80°C and could not locate TgPS precisely.
Here, we report on the use of modulated DSC (MDSC) and dynamic mechanical analysis (DMA) to measure Tgs in SBS. Glass transition temperatures were found for PB and for a mixed PB-PS phase, but not for a pure PS phase. From annealing experiments, it is shown that three phases coexist in SBS: PB, PB-rich and PS-rich phases.
2. Experimental
A linear untapered SBS elastomer with a 30:70 S:B wt ratio was supplied by Enichem (Europrene SOL T166, Mn=124000, Mw/Mn =1.04). Polymer pellets were pressed into a film at 150°C and cooled to room temperature before glass transition temperatures were measured by MDSC and dynamic mechanical analysis (DMA). The MDSC instrumentation and analysis methods are those described in detail earlier.5,6 The SBS (5-10 mg) was heated under helium from –120°C to 150°C at 3°C/min, a modulation period of 60 s and an amplitude of ±0.47°C. The reversing heat flow was converted to heat capacity by dividing by the underlying heating rate. The DMA was carried out using a Rheometric Scientific Solid Analyzer (RSA3). A strip of SBS of about 18 mm x 5 mm x
0.3 mm in length, width, and thickness was analyzed in tension from −120 °C to 100 °C at a frequency of 3 Hz and a heating rate of 2°C/min.
3. Results and Discussion
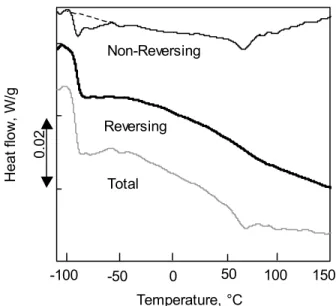
3.1 MDSC. The MDSC results for SBS are shown in Figure 1. The total heat flow,
which is identical to that from standard non-modulated DSC, was deconvoluted into its reversing and non-reversing components as described by Reading and others7-10. The total heat flow curve showed three features: i) a large decrease in heat flow around -90°C, ii) a curved background between about –70 and 60°C, iii) a change in baseline at 70°C. As seen from the deconvolution, the change in the total heat flow around –90°C arose from a decrease in reversing heat flow, due to TgPB,11 that overlapped with an endotherm. Consequently, the change in Cp at TgPB was not as intense as the total heat flow curve first indicated. It was 0.23 J/K/g rather than 0.34 J/K/g, some 30% lower.
The change in baseline in the total heat flow curve at 60-70°C was assigned to TgPS by Spaans et al.3 and as the center of an endotherm by Létoffé et al.4 The non-reversing heat flow in Figure 1 confirmed the existence of an endotherm, centered at 68°C, the origin of which will be discussed later. The existence of a Tg in this region was not easily confirmed with the reversing heat flow curve, and it was from the dCp/dT curve in Figure 2 that a maximum, a Tg, was also measured at 68°C. This Tg coincided with an endothermic minimum also at 68°C in Figure 1.
The dCp/dT curve showed an extremely broad Tgin SBS, from about –60°C to 125°C (Figure 2). Given that a shift in Tg signals interactions and mixing12 and that the Tg of hPS is centered at 100°C,13 the Tgat 68°C in Figure 2 must arise from a mixed PS-PB phase, TgPS-PB. From the Fox equation14 for copolymers: 1/TgPS-PB=WPS/TgPS +WPB/TgPB,
Wi being the weight fraction and Tgi the Tg of the homopolymers, it was calculated that the mixed phase contained 35% to 93% PS between –50°C and 75°C. PS and PB homopolymers are considered immiscible because two Tgs are found for many mixtures,15 but complete immiscibility requires that the Tgs of the two phases be equal to the Tgs of the respective homopolymers,16 which was not the case for SBS as seen in Figure 2. It is noteworthy that TgPB was well resolved from TgPS-PB, which indicated the existence of a separate and pure PB phase. This was consistent with the results for blends of hPS and hPB, which show that some PB dissolves in PS, but that PS is mostly insoluble in PB, the result being a depression in TgPS with an increase in PB content, but a constant TgPB with a variation in PS content.17
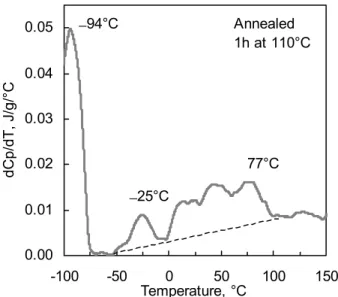
In SBS, the PS-rich phase may be frozen in a non-equilibrium state. In such a case, improved segregation of the PS and PB blocks would be expected after annealing above TgPS-PB. Figure 3 shows the results of annealing SBS for 1h at 110°C. The annealing allowed for greater segment mobility and more segregation, but this segregation remained quite incomplete as the original mixed phase segregated into a more discrete PB-rich phase, with a Tg at –25°C, and a PS-phase now richer in PS, with a higher Tg of 77°C. Annealing for 150h at 110°C did not lead to more segregation. Hence, it was concluded from Figure 3 that three phases coexisted in SBS; a PB, PB-rich and PS-rich phases. These phases were stable, likely because of the covalent bonds between the PS and PB segments. Very little pure PS, with a Tg at 100°C, was found, in contrast to what may be concluded based on tan δ from dynamic mechanical analysis, as seen below.
As indicated before, the non-reversing heat flow in Figure 1 showed two endotherms, centered at –90°C and 68°C. As SBS is amorphous, the endotherms could not arise from
melting, and must be from enthalpy relaxation at Tg.18 The relaxation stems from cooperative chain motions in the Tg region19 and increases upon the annealing of amorphous19 and semi-crystalline polymers.20 Consequently, and as expected, the annealing of SBS lead to an increase in the size of the endotherms (not shown).
3.2 DMA. Unannealed SBS was analyzed by DMA and the results compared to those
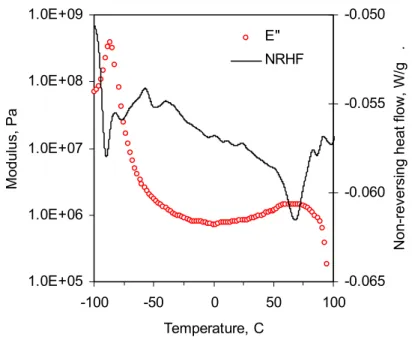
from MDSC. Figure 4 shows the correspondence between the storage modulus (E’) and the reversing heat flow. Both signals overlapped at TgPB, where the rate of change coincided. Above 50°C, when TgPS-PB was exceeded, E’ decreased rapidly. Figure 5 shows the correspondence between the loss modulus (E”) and the non-reversing heat flow. The maxima in the loss modulus curve at –92°C and 68°C coincided with the enthalpy relaxation endotherms (minima). There was thus good correspondence between the Tgs and the endotherms obtained by MDSC and the DMA moduli. Both methods show the absence of a hPS phase in SBS.
The correspondance between the MDSC transitions and the peaks in the tan δ curve, i.e., the ratio E”/E’, was not as good as with the moduli (Figure 6). A tan δ peak is often conveniently used to identify a Tg. For SBS, the Tgs on the tan δ curve were higher in temperature than those on the MDSC, E”, and E’ curves. For instance, the tan δ curve showed a peak at 90°C, some 20°C higher than in Figures 4 and 5. This is consistent with the 15°C difference observed for hPS.19 As the peak on the tan δ curve is relatively close to the Tg of hPS at 100°C measured by DSC,13 the tan δ peak is commonly assigned to a Tg from the pure PS block21 rather than to a mixed PS-PB phase. This supports an earlier conclusion,19 that tan δ peaks are only indirectly related to Tg.
4. Conclusion
The glass transitions (Tgs) and the associated amorphous phases in a linear SBS were analyzed by modulated differential scanning calorimetry (MDSC) and dynamic mechanical analysis (DMA). From the Tgs of annealed and unannealed samples obtained through the derivative of the reversing heat flow, it was found that polybutadiene (PB) segments existed both in a pure and a mixed PB phase, whereas polystyrene (PS) segments only existed in a mixed PB-PS phase with a significant PB content.
Given the measured sharpness of the Tg from the PB phase (TgPB) and the extraordinary breadth of the Tg from the PS-rich phase (TgPS-PB), it should be relatively easy to determine a shift in TgPB and assess the degree of blending of the PB phase with a diluent or another polymer, but this may be more difficult to do with the already mixed phase. We will report shortly the case for which bitumen is the diluent.
5. References
1. Dlugosz, J.; Keller, A.; Pedemonte, E.; Kolloid, Z.u.Z. Polymere 1970, 242, 1125. 2. Van Diik, M. A.; van den Berg, R. Macromol. 1995, 28, 6773.
3. Spaans, R. D.; Muhammad, M.; Williams, M. C. J. Polym. Sci. B 1999, 37, 267. 4. Létoffé, J.-M.; Champion-Lapalu, L.; Martin, D.; Planche, J.-P.; Gérard, J.-F.;
Claudy, P. Bull. Labo. Ponts Chaussées 2000, 229, 13.
5. Masson, J-F.; Polomark, G. Thermochim. Acta 2001, 374, 105. 6. Masson, J-F.; Polomark, G.; Collins, P. Energy Fuels 2002, 16, 470. 7. Reading, M. Trends Polym. Sci. 1993, 1(8), 248.
8. Gill, P. S.; Sauerbrunn, S. R.; Reading, M. J. Therm. Anal. 1993, 40, 931.
9. Jones, K.J.; Kinshott, I.; Reading, M.; Lacey, A. A.; Nikopoulos, C.; Pollock, H. M. Themochim. Acta 1997, 304/305, 187.
10. Lacey, A. A.; Nikopoulos, C.; Reading, M. J. Therm. Anal. 1997, 50, 279.
11. Pyda, M.; Wunderlich, B. Heat Capacities of High Polymers, in Polymer Handbook, Brandup, J.; Immergut, E. H. and Grulke, A., Ed., New York, 1999, 4th Ed.
12. Olabisi, O.; Robeson, L. M.; Shaw, M. T. Polymer-Polymer Miscibility, Academic Press 1979.
13. Reiger, J. J. Therm. Anal. 1996, 46, 965. 14. Fox, T. Bull. Am. Phys. Soc. 1956, 1, 123.
15. Krause, S. Polymer-Polymer Compatibility, in Polymer Blends, Paul, D. R. and Newman, S. Ed., Academic Press, New York, 1978, 70.
16. Hale, A.; Bair, H. E. Polymer Blends and Block Copolymers, Thermal Characterization of Polymeric Materials, Academic Press, 2nd Ed. 1997, Chap. 4. 17. Kim, W. N.; Burns, C. M. J. Appl. Polym. Sci. 1986, 32, 2989.
18. Wunderlich, B. Thermal Analysis, Academic Press, New York, 1990, 203-207. 19. Boller, A.; Schick, C.; Wunderlich, B. Thermochim. Acta 1995, 266, 97. 20. Okazaki, I.; Wunderlich, B. J. Polym. Sci. B. 1996, 34, 2941.
Acknowledgements
The authors thank Gary Polomark and Peter Collins for comments and discussions during this work.
Figure captions
Figure 1. MDSC for SBS with a 30:70 S/B ratio
Figure 2. Heat capacity curve and its derivative for SBS. Figure 3. dCp/dT curve for annealed SBS.
Figure 4. Storage modulus (E’) and the reversing heat flow (RHF) curves for SBS. Figure 5. Loss modulus (E”) and the non-reversing heat flow (NRHF) curves for SBS. Figure 6. DMA results for SBS.
-0.10 -0.08 -0.06 -0.04 -110 -60 -10 40 90 140 Temperature, °C Heat flow, W/g Reversing Total 0.02 Non-Reversing -100 -50 0 50 100 150
Figure 1. MDSC for SBS with a 30:70 S/B ratio.
1.00 1.25 1.50 1.75 -100 -50 0 50 100 150 Temperature, °C Cp, J/g -0.01 0.01 0.02 0.03 0.04 0.05 dCp/dT, J/g/°C Cp dCp/dT -92°C 68°C
0.00 0.01 0.02 0.03 0.04 0.05 -100 -50 0 50 100 150 Temperature, °C dCp/dT, J/g/°C −94°C 77°C −25°C Annealed 1h at 110°C
Figure 3. dCp/dT curve for annealed SBS.
1.E+06 1.E+07 1.E+08 1.E+09 1.E+10 -100 -50 0 50 100 Temperature, C Modulus, Pa -0.090 -0.080 -0.070 -0.060 -0.050
Reversing heat flow, W/g .
E' RHF
1.0E+05 1.0E+06 1.0E+07 1.0E+08 1.0E+09 -100 -50 0 50 100 Temperature, C Modulus, Pa -0.065 -0.060 -0.055 -0.050
Non-reversing heat flow, W/g .
E" NRHF
Figure 5. Loss modulus (E”) and the non-reversing heat flow (NRHF) curves for SBS.
1.E+04 1.E+05 1.E+06 1.E+07 1.E+08 1.E+09 1.E+10 -125 -100 -75 -50 -25 0 25 50 75 100 Temperature, C Modulus, Pa 0 0.2 0.4 0.6 0.8 1 Tan delta E' E" tan_delta