Publisher’s version / Version de l'éditeur: Technical Report, 2005-02
READ THESE TERMS AND CONDITIONS CAREFULLY BEFORE USING THIS WEBSITE.
https://nrc-publications.canada.ca/eng/copyright
Vous avez des questions? Nous pouvons vous aider. Pour communiquer directement avec un auteur, consultez la
première page de la revue dans laquelle son article a été publié afin de trouver ses coordonnées. Si vous n’arrivez pas à les repérer, communiquez avec nous à [email protected].
Questions? Contact the NRC Publications Archive team at
[email protected]. If you wish to email the authors directly, please see the first page of the publication for their contact information.
Archives des publications du CNRC
For the publisher’s version, please access the DOI link below./ Pour consulter la version de l’éditeur, utilisez le lien DOI ci-dessous.
https://doi.org/10.4224/12340988
Access and use of this website and the material on it are subject to the Terms and Conditions set forth at
Scoping Study: Ice Information Requirements for Marine Transportation of Natural Gas from the High Arctic
Timco, G.W.; Gorman, B.; Falkingham, J.; O'Connell, B.
https://publications-cnrc.canada.ca/fra/droits
L’accès à ce site Web et l’utilisation de son contenu sont assujettis aux conditions présentées dans le site LISEZ CES CONDITIONS ATTENTIVEMENT AVANT D’UTILISER CE SITE WEB.
NRC Publications Record / Notice d'Archives des publications de CNRC:
https://nrc-publications.canada.ca/eng/view/object/?id=1034579a-3fcb-4704-aadf-106f854769e2 https://publications-cnrc.canada.ca/fra/voir/objet/?id=1034579a-3fcb-4704-aadf-106f854769e2
Scoping Study: Ice Information Requirements for
Marine Transportation of Natural Gas from the High
Arctic
G.W. Timco, B. Gorman, J. Falkingham and B. O’Connell
Technical Report CHC-TR-029
February 2005
Scoping Study: Ice Information Requirements for Marine
Transportation of Natural Gas from the High Arctic
G.W. Timco1, B. Gorman2, J. Falkingham3 and B. O’Connell4
1
Canadian Hydraulics Centre National Research Council of Canada
Ottawa, Ont. K1A 0R6 2
Enfotec
25 Tapiola Cres. Suite 206 Ottawa, Ont. K1P 2J7
3
John Falkingham Environment Canada Ice Forecasting Services 373 Sussex Drive LaSalle Academy
Ottawa, Ontario K1A 0H3 4
Canadian Coast Guard 200 Kent St., 5th Floor Ottawa, Ont. K1A 0E6
Prepared for:
Climate Change Technology and Innovation Initiative Unconventional Gas Supply
Technical Report CHC-TR-029 February 2005
ABSTRACT
This report describes a scoping study that was performed to investigate methods for improving transportation in the High Arctic. Fourteen Captains of ice-class vessels were interviewed. They unanimously said that the detection and avoidance of multi-year ice was the key issue. They also indicated that better knowledge of regions where ice
pressure and leads develop is important. A one-day Workshop was held with several key Stakeholders and issues related to improved systems were discussed. This report
summarizes these findings as well as reviews the existing ice information systems, the Canadian Ice Service operations, and the use of ice information by the Canadian Coast Guard. A three-year program is suggested that would significantly improve detection of multi-year ice.
TABLE OF CONTENTS ABSTRACT... 1 TABLE OF CONTENTS... 3 LIST OF FIGURES ... 5 LIST OF TABLES... 6 1.0 INTRODUCTION ... 7
2.0 TRANSPORT CANADA REGULATIONS ... 10
2.1 The Zone-Date System ... 10
2.2 The Ice Regime System ... 10
2.3 Application for Year-Round Arctic Shipping... 14
3.0 PAST AND CURRENT ICE INFORMATION SYSTEMS ... 15
3.1 The Aircraft Era 1970’s to 1995 ... 15
3.2 The RADARSAT Era 1995 to Present ... 19
3.3 Other Shipboard Sensors... 20
3.3.1 SONAR ... 21
3.3.2 Low-light and IR Sensors... 21
3.3.3 Advanced Marine Radar ... 21
3.4 Current Integrated Ice Navigation Systems ... 24
3.5 Future Direction ... 25
4.0 CANADIAN ICE SERVICE OPERATIONS AND PRODUCTS... 26
4.1 Organization... 26
4.2 Data Acquisition ... 27
4.3 Output products and forecasts... 27
4.4 Publications... 29
4.5 Mailing address... 30
5.0 CANADIAN COAST GUARD Use of Ice Information ... 38
5.1 Introduction... 38
5.2 Ice Information Services ... 41
5.3 Use of Ice Information in Ice Operations Centres ... 42
5.4 Use of Ice Information by Icebreakers... 44
5.5 Use of Ice Information by the Icebreaking Program (National & Regional) ... 45
5.6 CCG Development of Ice Information Systems ... 46
5.6.1 The Integrated Ice System (IIS)... 46
5.6.2 Ice Routing Model... 47
5.6.3 ICEggs... 47
5.6.4 Ice Thickness Sensor ... 48
5.6.5 Cross Polarized Radar... 49
6.0 SURVEY OF ICEBREAKER CAPTAINS... 50
6.1 Background Information... 50
6.2 Analysis of the Interviews ... 51
6.2.1 Ice Parameters of Interest... 51
6.2.3 Present Day Situation ... 53
6.2.4 View to the future. ... 54
7.0 ICE INFORMATION WORKSHOP... 58
7.1 Background Information... 58
7.2 Results of the Workshop... 60
8.0 ICE INFORMATION ROADMAP ... 62
9.0 ACKNOWLEDGEMENTS... 64
10.0 REFERENCES ... 64 Appendix A... A1 Appendix B ...B1
LIST OF FIGURES
Figure 1: Map illustration two options for moving natural gas from the Arctic... 8
Figure 2: Map showing the regions of the Zones in the Zone-Date System... 12
Figure 3: Canadian Ice Service Dash-7 Ice Reconnaissance Aircraft ... 15
Figure 4: SLAR imagery collected by the Canadian Ice Service DASH7 Aircraft... 16
Figure 5: SAR imagery of Resolute Passage (de Bastiani 1987)... 17
Figure 6: CIRS SAR-equipped ice reconnaissance aircraft... 17
Figure 7: Hardcopy display of airborne radar data on the bridge of a ship ... 18
Figure 8: Ice Navigation system on MV Arctic with computerized STAR-VUE display – 1988 (Gorman 1988)... 18
Figure 9: Enfotec’s IceNav display showing the range of functionality now available in PC-based ice navigation systems used in the RADARSAT era. ... 20
Figure 10: H/H polarized (left) and H/V polarized (right) showing glacial ice detection capability of X-Pol radar technology... 23
Figure 11: Standard radar display (left) and an image from the same radar scan converted and digitized to 256 grey levels (right) showing the great improvement in ice detection possible with advanced radar image processing. ... 23
Figure 12: IceNav integrated satellite and marine radar ice navigation system ... 25
Figure 13: Example of a Daily Ice Chart - Newfoundland... 31
Figure 14: Example of a Daily Ice Hazard Bulletin ... 32
Figure 15: Ice Reconnaissance Chart - Gulf of Boothia ... 33
Figure 16: Daily Iceberg Analysis Chart – East Coast of Canada... 34
Figure 17: RADARSAT image analysis chart - Labrador Coast... 35
Figure 18: RADARSAT imagery - Lake Erie ... 36
Figure 19: Regional Weekly Ice Chart – Eastern Canadian Arctic ... 37
Figure 20: Chart: Excerpt from Climatic Ice Atlas – East Coast... 38
Figure 21: CCG vessel in escort service ... 41
Figure 22: Ice concentration chart for the Arctic... 42
Figure 23: Recommended Ice Route Displayed on Ice Analysis Chart... 44
Figure 24: Photograph showing escort through pressured ice. ... 44
Figure 25: Illustration of the integrated ice system ... 46
Figure 26: Illustration of the ice routing model and ice severity index ... 47
Figure 27: Illustration of the ICEggs system ... 48
Figure 28: Illustration of the fixed mount ice thickness sensor ... 48
Figure 29: Ice parameters identified as the highest concern by the Captains during the survey... 52
Figure 30: Plot showing the sources of ice information mentioned by the Captains. ... 53
Figure 31: Schematic illustration of general planning for a voyage in ice conditions. .... 59
Figure 32: Basic table framework for discussion used during the Workshop. There was a separate table for Long Term, Today and 1-Hour planning. ... 60
Figure 33: Schematic illustration of a proposed test program to improve ice information systems for shipping in the High Arctic. ... 63
LIST OF TABLES
Table 1: Zone-Date Table ... 11
Table 2: Table of the Ice Multipliers (IM) for the Ice Regime System ... 13
Table 3: List of CCG Icebreakers ... 39
Table 4: List of Captains Interviewed... 51
Table 5 : Workshop Results - Long Term Requeirments ... 61
Table 6: Workshop Results - Today's Requirements... 61
Scoping Study: Ice Information Requirements for Marine
Transportation of Natural Gas from the High Arctic
1.0 INTRODUCTION
The High Arctic contains significant reserves of natural gas (NG). The Canadian Gas Potential Committee estimated that there are 7.7 Tcf of discovered marketable natural gas in the Hecla field and Drake Point field on Melville Island in the Canadian Archipelago (CGPC, 2001). There are, however, major accessibility issues due to its remote location. Tankers are the most viable option for transporting this resource. There are two potential routes for bringing the gas to southern markets: (1) the “eastern” route proposed in the original Arctic Pilot Project of bringing LNG tankers along the east coast of Canada into Nova Scotia and Quebec, and (2) the “western” route of connecting to the (proposed) pipeline from the Beaufort Sea down the Mackenzie valley. Figure 1 illustrates these two routes. The extreme ice conditions of the Arctic Archipelago and North West Passage are seen as a major obstacle to year-round marine transportation. Innovation in
characterizing and forecasting the unique ice conditions of the Arctic is proposed as a key avenue to achieve economically competitive and safe development of High Arctic natural gas.
In a recent study carried for Indian and Northern Affairs Canada (INAC), it was
concluded that based on a preliminary analysis, production and ship-borne transportation of natural gas from Melville Island is economically feasible (CERI, 2004). The report states, however, that ship-borne transportation to southern markets represents the largest challenges to any development option, and that shipping times would represent a major uncertainty for the project. Furthermore, shipping costs represent a large component of the project expenditures. If ice conditions cause transit times to be slower than
anticipated, additional ships would be required. Also, if a ship gets stuck, icebreaker support may be required. Damage to ships and corresponding downtime for repairs could reduce deliveries.
Clearly, confidence in shipping in the Arctic is critical. There must be certainty in transit times with low risk of structural damage to the tanker. Confidence in year-round shipping is based on two factors – the capability of the tanker in different ice conditions, and good ice information and routing to minimize the risk of damage and transit time. This report will address the ice issue.
The tankers will necessarily be quite large and must be able to operate on a year-round basis. Regardless of the ultimate choice for the route, collisions with ice hazards could lead to vessel and environmental damage or operational delays. The physical size of the tankers will significantly limit their maneuverability especially on a short time span. This makes it essential to have both detailed and accurate knowledge of local ice conditions (multi-year ice, large ridges, etc.) so that safe and operationally efficient routes can be
planned. Currently, ice information and forecasts are oriented towards regions of temperate ice such as the Gulf of St. Lawrence, the East Coast of Labrador and
Newfoundland. The conditions of the Arctic are more severe, and there is very limited experience with winter navigation. The High Arctic is dominated by numerous narrow channels involving a mix of first year, multi-year and ridged ice. Ice consolidation usually takes place and forms relatively large-thickness, high-strength fields. One of the most striking phenomena that results from those ice conditions is the formation of massive ice arches that can block a channel. Such arches are often observed in Lancaster Sound, and may present a serious impediment to shipping.
Figure 1: Map illustration two options for moving natural gas from the Arctic
This report provides a summary of a scoping study that was undertaken to provide information on the current state of ice information technology and to develop a road map for modifying it and improving it for the High Arctic. The work was done with direct input from the end users – industrial shipping companies in the Arctic, the Canadian Coast Guard, Transport Canada and the Canadian Ice Service. The work was carried out by the authors on behalf of the Climate Change Technology and Innovation Initiative through Natural Resources Canada.
The work was carried out with direct input from Captains of icebreaking vessels. Their experience was seen as a key element in understanding ice information systems and in identifying potential areas for improvement. This scoping study contains the following information:
Chapter 2.0 analyzes the current Transport Canada regulations for year-round shipping in the Arctic.
Chapter 3.0 discusses the past and current ice information systems that are used in the Arctic.
Chapter 4.0 details the information supplied by the Canadian Ice Service.
Chapter 5.0 discusses the Canadian Coast Guard approach for using ice information. Chapter 6.0 presents a summary of the discussions held with a number of Captains of icebreaking vessels.
Chapter 7.0 provides an overview of a Workshop that was held in Montreal to discuss these results.
Chapter 8.0 provides a basic roadmap identifying issues that should be addressed for improved ice information systems, especially as they relate to year-round transportation in the High Arctic.
2.0 TRANSPORT CANADA REGULATIONS
Transport Canada is responsible for regulating shipping in the Arctic regions under the Arctic Shipping Pollution Prevention Regulations (ASPPR). These regulations apply to shipping north of 60º latitude. The regulations are comprised of two different parts – the Zone-Date System (ZDS) and the Ice Regime System (IRS). These systems are briefly described in this section and discussed in terms of their application to year-round shipping in the Arctic.
2.1 The Zone-Date System
In 1972, the Canadian Government drafted the Arctic Shipping Pollution Prevention Regulations (ASPPR) to regulate navigation in Canadian waters north of 60°N latitude. These regulations include the Shipping Safety Control Zones (Figure 2), and the Date Table (Table 1), made under the Arctic Waters Pollution Prevention Act. Both of these are combined to form the “Zone/Date System” matrix that gives entry and exit dates for various ship types and classes. In this system, the ship types and classes, in descending order of ice capability are:
Arctic Class: 10, 8, 7, 6, 4, 3, 2, 1A, 1
Type Ships: A, B, C, D, E
The Arctic Class was normally but not accurately described as the thickness in feet of level ice that the vessel would have the power and strength to break. The Type ships represent the Classifications Societies’ designation of ice-capable ships that are in turn equivalent to the Baltic Rules. The “Zone-Date System” is based on the premise that nature consistently follows a regular pattern year after year. It is a rigid system with little room for exceptions.
2.2 The Ice Regime System
Transport Canada, in consultation with Stakeholders, has made extensive revisions to the Regulations through the introduction of the Ice Regime System (ASPPR 1989; Canadian Gazette 1996; Equivalent Standards 1995; AIRSS 1996). The changes are designed to reduce the risk of structural damage in ships which could lead to the release of pollution into the environment, yet provide the necessary flexibility to Shipowners by making use of actual ice conditions, as seen by the Master to determine transit.
In this system, an "Ice Regime", which is a region of generally consistent ice conditions, is defined at the time the vessel enters that specific geographic region, or it is defined in advance for planning and design purposes. The Arctic Ice Regime Shipping System (AIRSS) is based on a simple arithmetic calculation that produces an “Ice Numeral” that combines the ice regime and the vessel’s ability to navigate safely in that region. The Ice Numeral (IN) is based on the quantity of hazardous ice with respect to the ASPPR classification of the vessel (see Table 2). The Ice Numeral is calculated from
Figure 2: Map showing the regions of the Zones in the Zone-Date System. .... ] [ ] [ + + = CaxIMa CbxIMb IN [1] where IN = Ice Numeral
Ca = Concentration in tenths of ice type “a”
IMa = Ice Multiplier for ice type “a” and Ship Category (from Table 2)
The term on the right hand side of the equation (a, b, c, etc.) is repeated for as many ice types as may be present, including open water. The values of the Ice Multipliers are adjusted to take into account the decay or ridging of the ice by adding or subtracting a correction of 1 to the multiplier, respectively (see Table 2). The Ice Numeral is therefore unique to the particular ice regime and ship operating within its boundaries.
The vessel class is defined in terms of vessels that are designed to operate in severe ice conditions for both transit and icebreaking (Canadian Arctic Class - CAC) as well as vessels designed to operate in more moderate first-year ice conditions (Type ships). The classes were developed based on a “nominal” ice type, which were correlated to the World Meteorological Organization (WMO) classification for sea ice.
Table 2: Table of the Ice Multipliers (IM) for the Ice Regime System
Type E Type D Type C Type B Type A CAC 4 CAC 3
Old / Multi-Year Ice……….. (MY) -4 -4 -4 -4 -4 -3 -1
Second Year Ice……….. (SY) -4 -4 -4 -4 -3 -2 1
Thick First Year Ice………. (TFY) > 120 cm -3 -3 -3 -2 -1 1 2
Medium First Year Ice…………. (MFY) 70-120 cm -2 -2 -2 -1 1 2 2
Thin First Year Ice……….
Thin First Year Ice - 2nd Stage (FY)
30-70 cm
50-70 cm -1 -1 -1 1 2 2 2
Thin First Year Ice - 1st Stage 30-50 cm -1 -1 1 1 2 2 2
Grey-White Ice………. (GW) 15-30 cm -1 1 1 1 2 2 2
Grey Ice………. (G) 10-15 cm 1 2 2 2 2 2 2
Nilas, Ice Rind < 10 cm 2 2 2 2 2 2 2
New Ice……….. (N) < 10 cm " " " " " " "
Brash (ice fragments < 2 m across) " " " " " " "
Bergy Water " " " " " " "
Open Water " " " " " " "
Ice Decay : If MY, SY, TFY or MFY ice has Thaw Holes or is Rotten, add 1 to the IM for that ice type.
Ice Types Ice Multipliers
Ice Roughness : If the total ice concentration is 6/10s or greater and more than one-third of an ice type is deformed, subtract 1 from the IM for the deformed ice type.
The Ice Regime System determines whether or not a given vessel should proceed through that particular ice regime. If the Ice Numeral is negative, the ship is not allowed to
proceed. However, if the Ice Numeral is zero or positive, the ship is allowed to proceed into the ice regime. Responsibility to plan the route, identify the ice, and carry out this numeric calculation rests with the Ice Navigator who could be the Master or Officer of the Watch. Due care and attention of the mariner, including avoidance of hazards, is vital to the successful application of the Ice Regime System. Authority by the Regulator (Pollution Prevention Officer) to direct ships in danger, or during an emergency, remains unchanged.
At the present time, there is only partial application of the Ice Regime System,
exclusively outside of the “Zone-Date” System. That is, vessel traffic is regulated by the Zone-Date System, but is allowed to proceed into a (normally) restricted zone if the ice conditions are such that the Ice Regime System gives a positive Ice Numeral. For this, the vessel must have an Ice Navigator onboard and initially send an Ice Regime Routing Message to the CCG-NORDREG office in Iqaluit indicating a positive ice regime.
Following the voyage, an After Action Report must be submitted to Transport Canada. Full details are found in the applicable regulatory standards guidelines.
2.3 Application for Year-Round Arctic Shipping
The ice zones that would be encountered by a tanker would be different for the two routes.
For the Western route as shown in Figure 1, the tanker would have to proceed initially in an easterly direction (through Zone 6) turning south through McClintock channel
between Victoria Island and Prince of Wales Island. This would put in on the route through the Northwest Passage. It would travel south of Victoria Island through Amundsen Gulf to the Beaufort Sea. Examining this route on Figure 2 shows that the tanker would travel through Zones 6, 7, 11 and 12 to get to the Beaufort Sea. Thus, the most severe zone would Zone 6. Based on the Zone-Date table (Table 1), this would require an Arctic Class 7 vessel for year-round operation.
For the Eastern route (Figure 1), the tanker would travel east across Viscount Melville Sound, through Barrow Strait and through Lancaster Sound south of Devon Island. It would proceed into Baffin Bay and down through Davis Strait and along the eastern coast of Canada to arrive a terminal in southern Canada. Examining Figure 2 shows that the tanker would travel through Zones 6 and 13 (and possible 9) during this voyage. Thus, similar to the western route, the highest zone for travel is Zone 6. Thus, this would require an Arctic Class 7 vessel for year-round operation.
3.0 PAST AND CURRENT ICE INFORMATION SYSTEMS
The ice navigation systems in use today have been developed over many decades of research and development. The history of development that has led to the systems in use today is reviewed. This is then followed by a description of the existing systems in use today with a view to future developments.
3.1 The Aircraft Era 1970’s to 1995
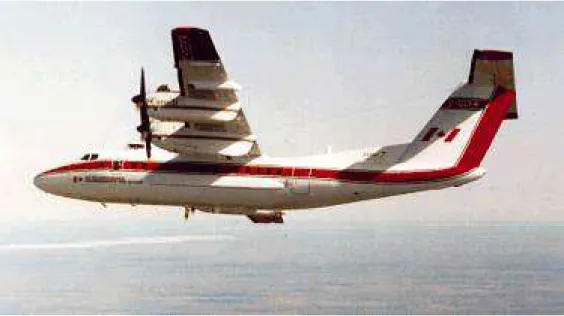
The use of aircraft for ice reconnaissance dates back many decades. The first successful systems were based on large four engine long range reconnaissance aircraft outfitted with Side-Looking Airborne Radar (SLAR) systems. In Canada, both the Lockheed Electra and Dash-7 aircraft were used for ice reconnaissance as illustrated in Figure 3.
Figure 3: Canadian Ice Service Dash-7 Ice Reconnaissance Aircraft
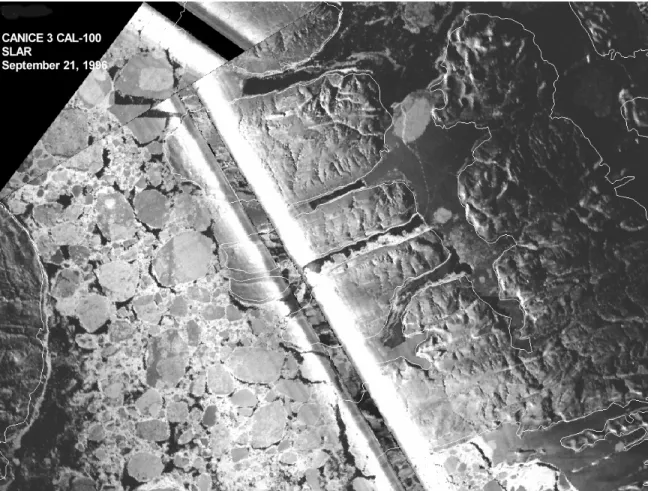
The SLAR systems were “real-aperture” radar systems, such as the Motorola APS-94 or the CAL-100. These systems were relatively inexpensive to purchase compared to Synthetic Aperture Radar (SAR) systems but provided lower resolution imagery. However, they were still adequate for ice reconnaissance providing image resolution in the range of 30 to 200 metres. Imagery at this resolution was adequate for the delineation of larger ice floe boundaries, as evident by the SLAR image of the channels around Bathurst Island presented in Figure 4, imaged by the CAL-100 SLAR outfitted on the Dash-7 aircraft. A ship’s track through fast ice is evident in the centre-right portion of the image.
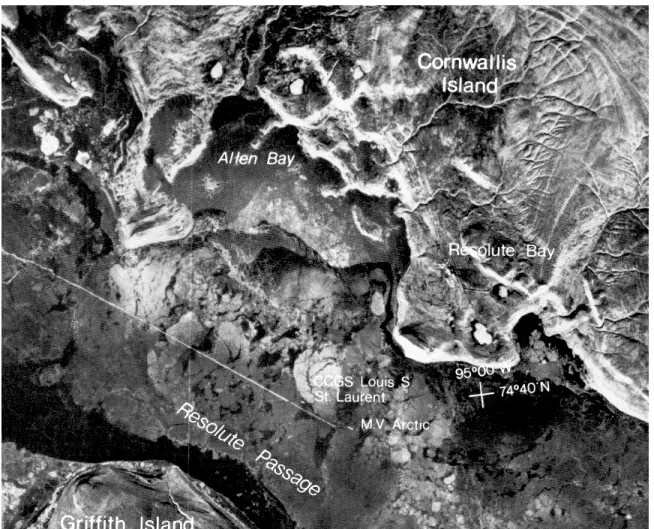
A significant improvement to the resolution of airborne radars came with the introduction of the Intera STAR (Sea Ice and Terrain Assessment Radar) SAR system in 1984. Using advanced radar processing technology, known as coherent signal processing, it was possible to greatly increase the resolution of radar images collected by ice reconnaissance aircraft. The system was used operationally for ice reconnaissance by offshore oil
exploration companies in the Beaufort Sea and by Canarctic Shipping in the high Arctic islands in the 1980’s and by the Canadian Ice Service and the Canadian Coast Guard with the Intera Comprehensive Ice Reconnaissance Service (CIRS) between 1990 and 1995. Figure 5 is an example of the high resolution SAR imagery collected by the Intera STAR -SAR system as installed on the CIRS SAR equipped aircraft (Figure 6).
Figure 5: SAR imagery of Resolute Passage (de Bastiani 1987)
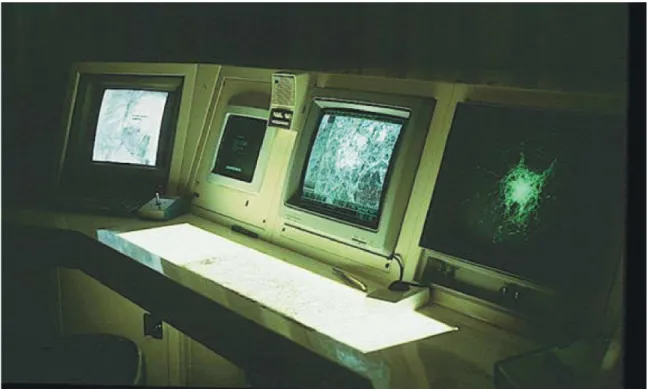
Shipboard equipment was developed to receive the direct downlink of imagery from the ice reconnaissance aircraft. The first downlink systems developed in the early 1980’s were based on the printing of hardcopy prints on the vessel of the received imagery (Figure 7) and advanced to computer displays by the late 1980’s (Figure 8).
Figure 7: Hardcopy display of airborne radar data on the bridge of a ship
Figure 8: Ice Navigation system on MV Arctic with computerized STAR-VUE display – 1988 (Gorman 1988)
The shipboard use of direct downlinked airborne SAR imagery culminated with the use of the Intera STAR-VUE system, first tested on the MV Arctic between 1986 and 1989 and installed on the larger Canadian Coast Guard icebreakers between 1990 and 1995 as part of the CIRS program.
The shipboard equipment required to receive the direct downlink of airborne radar imagery from the ice reconnaissance aircraft was custom built and very expensive, averaging between $300K and $500K per unit. In addition, the equipment required a specially trained operator on board at all times.
Airborne ice reconnaissance systems were successful in satisfying the ice navigation needs of ships. They were responsive to the “near-real-time” needs for ice information and provided very high resolution imagery. The downfall of airborne systems was the very high cost of operations and the difficulty a plane has in covering a large area. Often, ice information was needed over a much larger area than one plane could cover in any given period. With the launch of the Canadian RADARSAT in November 1995, the aircraft systems were scrapped and overnight a new approach to the implementation of ice navigation systems for ships was required.
3.2 The RADARSAT Era 1995 to Present
The loss of the ice reconnaissance aircraft meant the loss of the “real-time” downlink of radar imagery of ice directly to the vessel. This is because the processing of the radar signal into an image that was done in “real-time” on the aircraft is now done at the ground receiving station for data collected by satellite. Data must be relayed by
communications satellite to the vessel, often several hours after collection by the satellite. In addition, the planning of image acquisition for satellite data is limited by the
availability of satellite passes over an area and not the dedicated flight plan available with an aircraft. These were considered to be serious limitations to the use of satellite SAR data as a replacement for aircraft ice reconnaissance. Experiments were run in the early 1990’s by the Canadian Ice Service, Canarctic and the Transportation Development Centre (TDC) Transport Canada that demonstrated imagery from the European experimental SAR radar satellite ERS-1 could be sent to a vessel and used for ice navigation (Gorman and Flett 1995). However, the expensive shipboard ice navigation equipment used for receiving aircraft data was not compatible with RADARSAT data and a completely new approach was required.
Ice navigation systems have been developed in response to this need to replace the airborne downlink systems for the receipt and display of satellite radar imagery. These include:
• IceNav (Enfotec)
• Icevu (Canadian Ice Service) • IcePlot (VTT Finland)
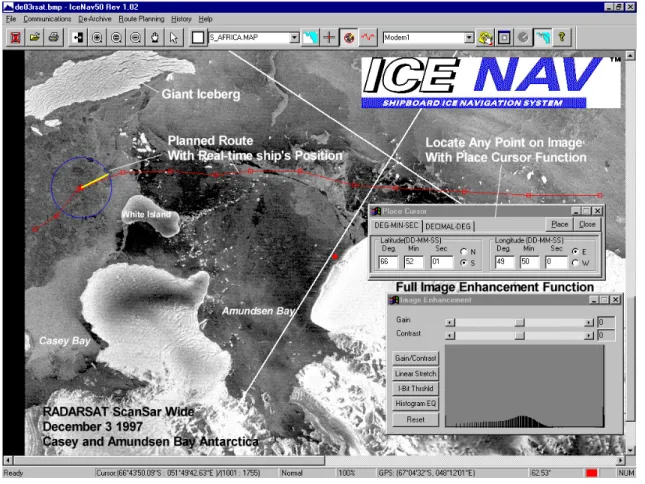
These ice navigation systems are based on inexpensive PC systems that cost as little as 1% the cost of the airborne downlink systems they replaced. They also provide much more flexibility in terms of functionality and data they can handle and the ease to which they can be integrated into the navigational environment on a bridge of a vessel. Figure 9 below shows the screen of Enfotec’s IceNav system showing the integration of the ship’s GPS position on a RADARSAT image used for planning and executing a voyage in the Antarctic.
Figure 9: Enfotec’s IceNav display showing the range of functionality now available in PC-based ice navigation systems used in the RADARSAT era.
3.3 Other Shipboard Sensors
In addition to systems that receive radar images from aircraft and satellites, a significant amount of effort has also been place on the development of other shipboard sensors to assist in ice navigation. These include:
• SONAR
• Thermal/low light devices • Advanced marine radars
3.3.1 SONAR
A significant body of research has been completed on the utility of SONAR as an ice navigation device including work by Petro Canada (Remotec 1982) in the early 1980’s and Canarctic in 1985/86 (de Heering et al 1985, de Heering and Sutcliffe 1987). The conclusions from the SONAR trials were:
• Medium to large icebergs were easily detected.
• SONAR returns were complex, with significant scatter effect from the ship’s hull, sea bottom as well as under sea ice limiting the detection of smaller objects. • Changing temperature and salinity profiles in Arctic sea water made the modeling
of the SONAR equation difficult.
• Sea ice impacts cause significant damage to a SONAR transducer requiring costly and extensive re-engineering.
The limitations of SONAR for ice navigation were found to be significant in the trials and further work in the use of SONAR was not pursued.
3.3.2 Low-light and IR Sensors
Investigations into the use of light-intensifying and infrared devices have been completed (Remotec 1982, Robson 1982). The findings of these studies were that the environmental conditions that limited vision (such as fog, snow etc.) also limited low light and infra red sensors. The conclusions were that high-powered search lights were far more effective in detecting ice hazards than low-light or IR devices.
3.3.3 Advanced Marine Radar
The most promising results on research into ship-based sensors have come with work on marine radars. Sea and glacial ice display unique properties when illuminated at radar frequencies making this technology the most attractive for ice detection and avoidance. Standard marine radars were originally developed as target detectors (for other ships, navigation beacons and coastlines) and not imaging devices. A marine radar was not designed to provide a high definition image for ice navigation. The reason for this is that as a target detector, the standard marine radar is set to show all targets on the display that appear above a pre-set threshold value as equally bright, whether the target is a small fishing boat or a large cargo vessel. It is equally important to detect both and thus the radar is set-up to do just that. However, the technology used in standard marine radars is capable of producing high quality images for ice navigation by changing some of the operational parameters. The parameters of interest are:
• Frequency • Polarization
• RPM and PRF (pulse repletion frequency) • Coherency
• Display resolution
Frequency
X-Band (3 cm) has been selected as the optimum frequency for marine radars, as it combines both good resolution with good rain and sea clutter penetration as well as limited loss due to atmospheric vapour. However, within an ice cover (particularly under Arctic conditions) there is no sea or rain clutter to worry about and atmospheric vapour is very low so an “ice radar” does not need to be restricted to the X-Band frequency. Higher frequencies such as Ku (16.5 Ghz) and Ka (35.0 GHz) and others provide higher
image resolution potential. There has been limited work in the investigation of these frequencies for ice detection (Haykin et al. 1994) and the results were encouraging but much remains to be done in this area.
Polarization
Standard marine radars transmit and receive in horizontal polarization as this has been found to limit rain and sea clutter on radar displays. However, like frequency, these are not limitations in ice covered waters. In addition, comparing cross transmit and receive polarizations has shown some interesting results in ice detection. First year ice, with a high surface salinity, acts as a high loss substance not allowing radar energy to penetrate into the ice. Old and glacial ice, being essentially fresh water ice is a low loss substance to radar energy, allowing the energy to penetrate into the ice where imperfections in the ice that causes a scatter of the energy and polarization of the radar pulse. Experiments have shown that by tuning a radar to an unlike polarization to the transmit pulse, it is possible to separate old ice and glacial ice from first year ice on a radar display (Haykin et al 1994, Gorman 1987).
Figure 10 illustrates the effect of cross polarization on being able to distinguish between old ice and glacial ice on a radar display. This example comes from experimentation undertaken on board the MV Arctic with an experimental cross polarized radar in 1986. This technology shows promise as a glacial and old ice hazard detector for a vessel but much work remains to produce an operational system.
Rotation and Display
Standard marine radars rotate at 30 RPM as 2 seconds was how long a target illuminated on a phosphorous display would remain visible until another pass was required. Marine radars no longer use phosphorous displays and have not done so for years yet the 30 RPM design persists. Altering the rotation speed of the radar could greatly enhance the ability of the radar to image ice hazards in front of the vessel by increasing the number of pulses illuminating a target over a given period.
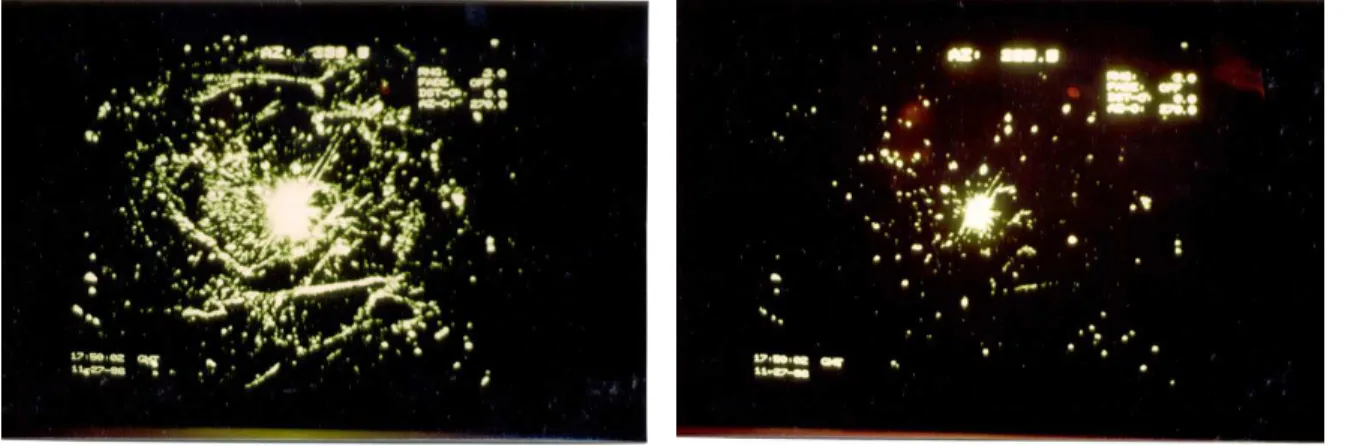
Figure 10: H/H polarized (left) and H/V polarized (right) showing glacial ice detection capability of X-Pol radar technology
In addition, increasing the digitization of the radar signal to 256 grey level from the existing 4 of standard radars greatly increases the imaging capabilities of the marine radar. This, along with averaging scans together to reduce noise and clutter on the image, allows for a much higher quality image of the ice cover than that available on standard marine radar displays. Figure 11 illustrates the improvement in ice detection that occurs due to radar image scan conversion.
Figure 11: Standard radar display (left) and an image from the same radar scan converted and digitized to 256 grey levels (right) showing the great improvement in ice detection possible with advanced radar image processing.
Coherent Marine Radar
Standard marine radars are considered “noncoherent” since the image is only based on the amplitude of the returning signal. Since ice represents a relatively poor radar target, there is sometimes insufficient separation in the amplitude domain between a signal of an ice target and background noise and clutter, particularly for small objects like individual ice floes or growlers in high sea state. However, there is much more to a radar signal such as frequency, phase and polarization that conventional marine radars do not process. We have described above how frequency and polarization can be used to improve ice discrimination but there is one more important element that can be used that of the phase of the radar signal.
Conventional marine radars measure only the amplitude of each individual returning pulse in isolation. However, much like the changing sound of a car as it passes by, there is also a change in the phase as successive pulses move past an object, known as the Doppler principle. With a coherent marine radar, the phase of the received signal is measured against the transmitted signal as well as adjacent signals. The ability to
measure the phase shift on each pulse significantly increases the information content and the ability to resolve features on the radar. This is the same principle used in Synthetic Aperture Radar and provides for much higher resolution images and target
discrimination.
Experimentation with coherent surface radars has been undertaken by the
Communications Research Laboratory (CRL) at McMaster University. CRL developed an experimental coherent radar called the IPIX (Intelligent Pixel-Processing Radar) that allowed for experimentation in phase, frequency and polarization dimensions of the radar signal. Results from the radar experiments were encouraging but demonstrated that gaining an understanding of the interactions of these parameters was a complex problem (Currie et al. 1991). Coherent marine radars use very advanced technology and represent a cost much higher than standard marine radars that limits the commercialization of the technology at the moment.
3.4 Current Integrated Ice Navigation Systems
In order to satisfy the ice information requirements of the navigation officer on a vessel transiting through ice covered waters, an ice navigation system must be able to integrate data sources both externally from the ship (such as satellite imagery) with those
generated on board the vessel (such as the vessel’s marine radar). In addition, the system must integrate into the navigational environment on the ship, such as with the GPS and INMARSAT (or similar) communication systems.
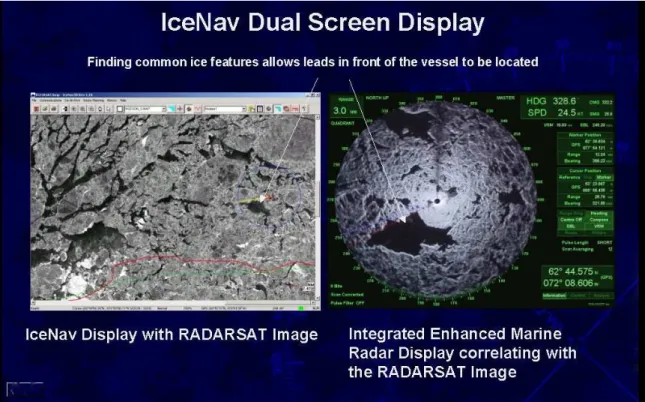
Significant strides have been achieved toward the development of an integrated ice navigation system, such that which exists with Enfotec’s IceNav-VMR system illustrated in Figure 12. The IceNav-VMR integrates satellite radar imagery from RADARSAT with an enhanced scan converted marine radar image. Such an integrated system allows
the navigation officer to see ice conditions in the immediate vicinity of the vessel as well as longer range out to 100 nautical miles and beyond (Gorman and Zagon 2005).
Figure 12: IceNav integrated satellite and marine radar ice navigation system
3.5 Future Direction
Although much has been accomplished in the creation of ice navigation systems, much remains to be achieved, particularly in the area of ice hazard detection in front of the vessel. Advances in marine radar technology hold the most promising opportunities to achieve this goal, particularly in the area of polarization and coherency. There is an opportunity to create the “Ice Navigation Radar” that will greatly improve the safety and efficiency of vessels plying ice covered waters.
4.0 CANADIAN ICE SERVICE OPERATIONS AND PRODUCTS
4.1 Organization
The Canadian Ice Service, a division of the Meteorological Service of Canada in the Department of Environment, is a centre of expertise for ice related information for all of Canada and its surrounding waters. The Ice Service co-operates closely with the
Canadian Coast Guard which operates Canada’s fleet of icebreakers to assist marine transportation in Canadian waters.
The Canadian Ice Service promotes safe and efficient maritime operations and protects Canada's environment by providing reliable and timely information about ice conditions in Canadian waters. For example, the Ice Service provides timely warnings of icebergs and ice conditions that pose immediate threats to ships, ports and other marine
operations; advises on ice conditions in shipping routes for navigators; provides information to help shipping, fishing and offshore operators plan their seasonal operations in a safe and efficient manner.
To meet its mission, the Canadian Ice Service collects and analyses data on ice conditions in all regions of the country affected by the annual cycle of pack ice growth and
disintegration. In summer, the focus is on conditions in the Arctic and the Hudson Bay region. In winter and spring, attention shifts to the Labrador Coast and East
Newfoundland waters, the Gulf of St. Lawrence, the Great Lakes and St. Lawrence Seaway.
Major users of Ice Service products and services are:
• the Canadian Coast Guard uses weather and ice information for marine safety, icebreaking operations and efficient marine transportation
• port authorities obtain site-specific information on current and long-term ice conditions in ports and shipping routes
• the commercial shipping industry uses ice information for strategic and tactical vessel passage planning
• fishing fleets obtain enroute and on-site ice conditions for ice-encumbered areas • the offshore oil and gas companies use iceberg and sea ice information for
exploration and production, both on-site and in transit
• the marine construction industry uses site-specific current and historical data for offshore and onshore projects, such as bridges and port facilities
• the tourism industry gets technical and general information for the operation of cruise ships and the enjoyment of passengers
• the marine insurance industry uses ice information for risk assessment for offshore operations affected by ice
• environmental consultants use ice data, analyses and expert advice for environmental impact assessments
• research scientists use ice information relating to research on transportation, construction, climate change, meteorology, oceanography, biology and socio-economic impacts.
The Canadian Ice Service operates a comprehensive ice information service,
encompassing reconnaissance, analysis and forecasting, ice climatology, data archiving, informatics support and research and development. It has a staff of approximately 80 people working at the Ice Centre in Ottawa, aboard Coast Guard icebreakers and in field offices.
4.2 Data Acquisition
Radar imagery from satellites is the principal data source, augmented by visual observations from fixed-wing aircraft and helicopters. Radarsat and Envisat synthetic aperture radar (SAR) data provides extensive and detailed (up to 30 metres) coverage of ice conditions. The Ice Service uses approximately 5,000 SAR images covering over a billion square kilometres annually. Data are received in real-time by two Canadian satellite receiving stations, processed and delivered to the Canadian Ice Service and disseminated to marine users within hours.
Visual and infrared imagery from U.S. polar orbiting satellites is also used extensively in the ice analysis program. Passive microwave imagery is received daily to provide background information on the general ice distribution at low resolution.
Experienced ice observers are stationed on the major Coast Guard icebreakers and in regional ice offices. They conduct local visual reconnaissance by helicopter and transmit the observations to the Ice Centre immediately after the flight. These observed ice charts are posted on the Ice Service web site marine users immediately upon receipt.
The Canadian Ice Service is integrated with the national meteorological network and has access to the necessary meteorological and oceanographic inputs. Co-operation with research institutes, universities and other federal departments also provide other valuable data.
4.3 Output products and forecasts
The Canadian Ice Service provides its clients and the Canadian public with a variety of accurate and timely analyses and forecasts of ice conditions ranging from daily bulletins on ice hazards to seasonal outlooks. Information on ice conditions posing immediate threats, such as ice hazard bulletins and special warnings for ships, are directly available from the Ice Service web site and through weather and marine radio broadcasts.
Specialized products and services to meet the short-term tactical and longer-range planning needs of clients are also available. These products include detailed ice analysis charts, radar and satellite imagery, image analysis charts, and special forecasts covering
days to months (see Figure 13 to Figure 19). These products are distributed in a variety of formats, including mail, e-mail, fax, and Internet.
The Ice Service provides a variety of field services, normally through the Coast Guard, for clients who need specialized ice information. Ice Service Specialists provide field support to clients on shore and aboard ships, including briefings on ice conditions, direct analysis of satellite images and special visual observations.
The Canadian Ice Service has expertise in ice modelling, remote sensing and climatological ice conditions in and around Canada. It supports research and
development by scientists working in government, universities and the private sector. Drawing on the Canadian Ice Service national ice data archive, ice analysts work directly with clients to identify and analyze appropriate climatological ice information and
provide advice on historical ice and iceberg conditions.
Ice information products and services are provided in those areas of Canada’s waters where there is marine activity in the vicinity of sea ice. Arctic areas are active from June to November while southern areas, including the Gulf of St. Lawrence and the Great Lakes are active from December to May.
Ice Charts
Ice charts graphically illustrate ice or iceberg conditions at a particular time, presenting data by means of a standard international code. Charts may be used for strategic and tactical planning. Charts available from the Canadian Ice Service include:
• Regional Weekly Ice Chart
• Daily Iceberg Analysis Charts • Daily Ice Analysis Charts • Ice Reconnaissance Charts • Radarsat Image Analysis Charts
Bulletins
Bulletins provide advice on present and forecast ice or iceberg conditions in simple text format. The following bulletins are available from the Canadian Ice Service:
• Daily Ice Hazard Bulletins • Daily Iceberg Bulletins
• Daily St. Lawrence River Ice Bulletins • 30-day Ice Forecast Bulletins
• Seasonal Ice Summary • Seasonal Ice Outlook
Images
In preparing the charts and bulletins, the Canadian Ice Service uses an extensive array of satellite data. Raw images are available to users depending on their ability to receive image data:
• Visual / Infrared Satellite Imagery • SAR images from Radarsat and Envisat
Weather Maps
The Canadian Ice Service makes available the following weather maps produced by Environment Canada:
• Surface Analysis Weather Map • 500 HPA Height Analysis Map
• Surface Prognostic Weather Map out to 120 hours • 500 HPA Prognostic Weather Map out to 120 hours • Public and Marine Weather Forecast Bulletins • significant weather depiction charts
• ocean wave analysis
• 12-24-36 hour ocean wave prognosis
Special Services
The Canadian Ice Service responds to enquiries from users and provides a range of specialized forecasting, consultation and advisory services on a best-effort, cost-recovered basis. If needs are substantial, the user is referred to the private sector when possible.
4.4 Publications
The Canadian Ice Service has a collection of reference material related to sea ice and icebergs. The following representative publications are available in printed format and on-line as indicated:
Seasonal Summary for the Canadian Arctic: Summer 2004 (available on-line).
MANICE - Manual of Standard Procedures for Observing and Reporting Ice Conditions.
(available on-line).
Ice Thickness Climatology (1961-1990)
Melting and Freezing Degree Days (1961-1990)
Sea Ice Climatic Atlas - Northern Canadian Waters 1971-2000 (also in CD) (available on-line).
Sea Ice Climatic Atlas - East Coast of Canada 1971-2000 (available on-line).
Lake Ice Climatic Atlas - Great Lakes 1973-2002 (available on-line).
Annual Arctic Ice Atlas (CD only from 2003)
(available on-line).
4.5 Mailing address
Canadian Ice Service – Environment Canada 373 Sussex Drive, Block E - 3rd floor
Ottawa, Ontario
Canada K1A 0H3
Telephone: (613) 996-1550
or toll-free in North America (800) 767-2885
fax: (613) 947-9160
e-mail [email protected]
Daily Ice Hazard Bulletin Newfoundland
FICN18 CWIS 281449
ICE HAZARD BULLETIN FOR THE EAST COAST OF NEWFOUNDLAND AND LABRADOR ISSUED BY ENVIRONMENT CANADA AT 1500 UTC SATURDAY 28 FEBRUARY 2004 FOR TODAY AND SUNDAY.
THE NEXT SCHEDULED BULLETIN WILL BE ISSUED AT 1500 UTC SUNDAY. ICE EDGE AT 1500 UTC ESTIMATED FROM NEWFOUNDLAND NEAR 4955N 5530W TO 4955N 5500W TO 5010N 5400W TO 5335N 5135W TO 5405N 5150W TO
5525N 5415W TO 5615N 5815W TO 6125N 6030W THEN NORTHEASTWARD. SOUTH COAST
SOUTHEASTERN GRAND BANKS NORTHERN GRAND BANKS FUNK ISLAND BANK. ICE FREE.
EAST COAST. OPEN WATER. NORTHEAST COAST.
3 TENTHS MAINLY GREYWHITE ICE WITH 1 TENTH FIRST YEAR ICE SHOREWARD OF THE ICE EDGE. ELSEWHERE OPEN WATER.
BELLE ISLE BANK.
6 TENTHS MAINLY FIRST YEAR ICE WEST OF THE ICE EDGE. EAST OF THE ICE EDGE ICE FREE.
BELLE ISLE EASTERN HALF.
9 TENTHS MAINLY FIRST YEAR ICE. SOUTH LABRADOR COAST.
ICE WARNING IN EFFECT.
STRONG ICE PRESSURE ALONG THE COAST BETWEEN CARTWRIGHT AND SPOTTED ISLAND IS EXPECTED TO CONTINUE THROUGH SUNDAY.
9 PLUS TENTHS MAINLY FIRST YEAR ICE. MID LABRADOR COAST.
ICE WARNING IN EFFECT.
STRONG ICE PRESSURE ALONG THE COAST SOUTHEAST OF HOPEDALE IS EXPECTED TO CONTINUE THROUGH SUNDAY.
7 TENTHS MAINLY FIRST YEAR ICE WITH A TRACE OF OLD ICE. COMPACTED FIRST YEAR ICE ALONG THE COAST.
SOUTH LABRADOR SEA.
WEST OF THE ICE EDGE 4 TENTHS MAINLY FIRST YEAR ICE. ELSEWHERE MAINLY BERGY WATER.
CONTACT ECAREG CANADA VIA MARINE RADIO FOR ROUTING ADVICE. THE EAST COAST ICE ANALYSIS CHARTS CAN BE COPIED ON CFH AT 2222 UTC AND 0001 UTC AND ON VCO SYDNEY AT 1142 UTC AND 2331 UTC.
END/NH
5.0 CANADIAN COAST GUARD USE OF ICE INFORMATION
5.1 Introduction
Canada has more ice floating on its oceans and lakes than any other nation. Along the northern and eastern coasts and throughout the Great Lakes, ice affects economic activities and threatens human safety. The Oceans Act of 1997 (section 41) gives the Canadian Coast Guard the legislative authority to provide services for the safe,
economical and efficient movement of ships in Canadian waters. The Act also stipulates that the services are to be provided in a cost-effective manner.
The Coast Guard provides a variety of icebreaking services to ensure that marine shipping moves in a safe, timely and efficient manner through or around ice-covered waters and to minimize the effect of flooding caused by ice jams on the
St. Lawrence River. These services include ice routing and information, escort assistance, channel and track maintenance through shore-fast ice, harbour breakouts, flood control, northern resupply and Arctic sovereignty support. The mere presence of a guaranteed icebreaking service is one of the most important factors in sustaining the viability of many Eastern Canadian and Arctic economies and communities.
Figure 20: Chart: Excerpt from Climatic Ice Atlas – East Coast
Accurate and timely ice information is essential for the Icebreaking Program. For the past nine years, improved ice information and new technology has helped to optimize the efficiency of icebreakers. It has also resulted in improved ice routing advice to marine
shipping so that they may navigate safely around difficult areas of ice, therefore, reducing transit times, delays in ice, fuel consumption and the reliance on icebreaker support. The outcome has been reduced icebreaker escorts, improved effectiveness of commercial ship movements, increased client satisfaction and public confidence in the Coast Guard. The overall performance of the Icebreaking Program during the winter 2003 showed the importance of accurate ice information in the preparation of Recommended Ice Routes. During the winter of 1993, recognized by the Canadian maritime industry as being a severe ice season, the CCG icebreaker fleet provided 1373 escorts, compared with 835 escorts during the winter of 2003, which experienced very similar ice conditions. This can be directly attributed to improved satellite imagery (RADARSAT, launched 1995) and the use of new technology such as Ice-Vu, the Ice Routing Computer Model and the ICEggs/Pen Computer system. The CCG has also developed the Integrated Ice System, a system of sensors, radars and video cameras along the St. Lawrence River to help
monitor ice conditions and water levels to reduce the level of helicopter reconnaissance and icebreakers to detect potential ice jams and prevent flooding.
The current CCG icebreaking fleet consists of 5 dedicated icebreakers and 12 multi-tasked ice-strengthened vessels, which are operated out of 5 regions. There are two main operations seasons for the icebreaker fleet:
• Southern Operations: during the winter season from mid-December to the end of May in Eastern Canada, the Gulf, St. Lawrence River and the Great Lakes.
• Northern Operations: during the summer navigation season from late June to November in the Canadian Arctic.
The Coast Guard has a limited number of icebreakers with which to cover a large
geographic area. There is competition for ship-time with other CCG and DFO programs such as Arctic Science, Search & Rescue and Fisheries Enforcement. The Icebreaking Program must balance the needs of commercial shipping and other user groups with considerations of the general public’s interests, such as flood control and support to northern or remote sites. Delays caused by heavy ice conditions can mean a loss of over $25 thousand per day for a shipping company so timely and accurate ice information and effective ice routing can improve the transit time through or around ice.
Table 3: List of CCG Icebreakers
Name Type Len
(m) Power (kw) Summer Operations Winter Operations LOUIS S. ST-LAURENT
1300 120 29,400 East Arctic Gulf of St.
Lawrence
TERRY FOX 1200 88 17,300 East Arctic Gulf of St.
Lawrence
HENRY LARSEN 1200 100 12,000 East Arctic Newfoundland &
Labrador
DES GROSEILLIERS 1200 98 10,142 East Arctic St. Lawrence River
AMUNDSEN 1200 98 10,142 Arctic Science
St. Lawrence River
ANN HARVEY 1100 83 5,250 Newfoundland &
Labrador EDWARD CORNWALLIS 1100 83 5,250 Gulf of St. Lawrence SIR WILLIAM ALEXANDER 1100 83 5,250 Gulf of St. Lawrence GEORGE R. PEARKES 1100 83 5,250 Newfoundland & Labrador
GRIFFON 1100 71 3,980 Great Lakes
SIR WILFRID LAURIER
1100 83 5,250 West Arctic
MARTHA L. BLACK 1100 83 5,250 St. Lawrence River
EARL GREY 1050 70 6,500 Gulf of St.
Lawrence
SAMUEL RISLEY 1050 70 6,360 Great Lakes
TRACY 1000 55 1,491 St. Lawrence River
WABAN-AKI ACV 24.5 1,760 Lac St.-Pierre
SIPU MUIN ACV 28.5 2,818 Lac St.-Pierre
TYPE 1300: Heavy Gulf Icebreaker - Large ship escort in severe Gulf of St. Lawrence
and Atlantic ice and weather conditions. Capable of extended season operations through ice zone 6 or less severity.
TYPE 1200: Medium Gulf / River Icebreaker - Large ship escort operations in
southern Canadian waters as well as Arctic areas during the summer.
TYPE 1100: Major Navaids Tender / Light Icebreaker - Buoy handling and medium
cargo capacity; small to medium vessel escort in southern Canadian and sub-Arctic waters.
TYPE 1050: Medium Navaids Tender / Light Icebreaker - Buoy handling, restricted
mainly to deck cargo; small to medium vessel escort in moderate ice conditions south of the Arctic.
TYPE 1000: Medium Navaids Tender / Ice Strengthened - Buoy handling and
medium capacity cargo. Small to medium vessel escort in more restricted and shallow waters.
ACV: Air Cushion Vehicle - Icebreaking for flood control and seaway operation; small
Figure 21: CCG vessel in escort service
5.2 Ice Information Services
The Canadian Ice Service (CIS) works in partnership with the CCG to provide ice information to the marine community to enhance the safety and efficiency of marine operations in ice-covered waters. The CIS provides additional services to the CCG for the operation of the Icebreaking Program, for which it contributes funding each year. The specific services required by CCG are adjusted annually through joint operational
planning between CCG Icebreaking Program, CCG Regions and the CIS. CIS Ice Information Services provided to CCG include:
• Ice Service Specialists on-board icebreakers and in Ice Operations Offices • Download of imagery, charts, forecasts and assimilation into a simple
presentation
• Briefing and advice to Captain and Ice Office of ice conditions and impact of weather and currents on those conditions, advice on route planning
• Briefing and advice on future weather conditions for both ship and helo operations
• Performing Ice Observations flights onboard a CCG helicopter • Providing observations to CIS for assimilation into regional charts • Training and familiarization of all aspects of ice services to officers
• Airborne Ice Reconnaissance – operation of a fixed-wing aircraft for visual reconnaissance and image data collection
• Satellite Data Acquisition and Processing • Analysis and Forecast Services
• Ice Information Systems, including Ice-Vu display systems
• Product Dissemination Services, including telecommunications equipment and services
• Applied Science (remote sensing and modeling, new product and service development)
• Program Management and Support (informatics and technology support, management of capital projects that support the joint program)
• Training, such as Ice Interpretation Courses.
Figure 22: Ice concentration chart for the Arctic
5.3 Use of Ice Information in Ice Operations Centres
The Canadian Coast Guard has four Ice Operations Centres, located in St. John’s, Newfoundland, Halifax, Nova Scotia, Québec City, Québec and Sarnia Ontario (for the Great Lakes and Arctic). During the ice seasons they are in operation 24 hours a day and are staffed with professional Ice Officers who have experience in the operation of
icebreakers and ships in ice. The Centres work in conjunction with CCG Marine
Communications and Traffic Services (MCTS), to provide up-to-date ice information, to recommend routes for ships to follow through or around ice, and to co-ordinate
The CCG requires the most current, accurate ice information in order to: • Monitor ice conditions
• Monitor the progress of shipping through ice
• Develop and provide Recommended Ice Routes to marine shipping • Disseminate ice information (via MCTS Centres)
• Coordinate the movement and tasking of icebreakers using a zonal approach • Coordinate aircraft reconnaissance, when and where required
• Provide support to Transport Canada’s regulatory Ice Regimes
o Arctic Ice Regime Shipping System (AIRSS): Providing responses to Ice Regime Routing Messages from commercial ships in Arctic Waters to acknowledge that the planned route and anticipated ice conditions appears appropriate.
o Joint Industry Government Guidelines for the control of tankers in Ice Control Zones of Eastern Canada (JIGs): Activation of Ice Control Zones (i.e. Strait of Belle Isle, Northumberland Strait for the Confederation Bridge)
• Provide advice to shipping agents, ship owners, fishermen, charterers and port authorities as required
• Conduct client consultation
CCG Quebec, Maritimes and Newfoundland Regions coordinate icebreaking operations on the East Coast in order to task the icebreakers efficiently and effectively. Central and Arctic Region conducts icebreaking operations in the Great Lakes in collaboration with the United States Coast Guard. The zonal approach serves to maximize icebreaking support capability over a large geographic area. If an ice jam on the St. Lawrence River is severe, a request is made for tactical support from other regions. Likewise, when ice conditions are exceptionally bad along the east coast of Newfoundland, icebreakers from the Maritimes or Quebec Region are dispatched to the area. Regional Ice Offices provide regular communication briefings to clients and stakeholders throughout the winter season and will monitor the situation closely to ensure that any interruptions or delays for marine traffic are minimised.
Figure 23: Recommended Ice Route Displayed on Ice Analysis Chart
5.4 Use of Ice Information by Icebreakers
Although icebreakers are able to navigate through ice according to their design
capability, they are also affected by difficult ice conditions such as ridging, rafting and ice under pressure. The capability of the vessels under escort must be taken into
consideration when choosing a route through or around the ice, i.e. a tanker, a tug towing a barge, a small sealing vessel, etc. On February 20, 2003, CCGS EARL GREY and the Maria Gorthon became beset at the entrance to Bay of Islands, Newfoundland. The two vessels were carried by the ice, wind and currents extremely close to the islands before the pressure eased off and the icebreaker was able to move it safely away from the rocks. Unfortunately it is difficult for the Canadian Ice Service and the CCG to expertly detect areas of extreme ice pressure which should be avoided.
Figure 24: Photograph showing an icebreaker attempting to free a vessel beset in ice under pressure.
Accurate and timely ice information is essential for an icebreaker for:
• Voyage/route planning: to assess ice conditions that the vessel is likely to encounter along the length of its planned route.
• Tactical navigation in ice: planning the route to take advantage of optimum ice conditions, including finding open water leads, finding first year ice in older ice fields, avoiding ridges, rafting and pressure.
• Provision of icebreaking services: escorts, channel/track maintenance, harbour breakouts, flood control, northern resupply and Arctic Sovereignty. Similar to tactical navigation, however, the icebreaker may have less control over route selection with very dynamic ice conditions, i.e. under the main span of a bridge, crossing a shear line into a harbour, navigating shallow channels, while dealing with the interaction of the ice with other objects, wind, currents and tides. Ice can represent a serious structural hazard to all ships, wharves and bridges.
• Advice to commercial vessels, fishermen, ferries and harbour/port authorities. • Communication with Ice Operations Centres, other icebreakers and ice
reconnaissance aircraft.
• Decision as to need for helicopter or aircraft reconnaissance to supplement existing ice information.
Communication costs for the transmission of ice information to and from the icebreakers in the Arctic, primarily for Inmarsat, have increased to more than $500K so various initiatives have been taken to reduce the costs, including the use of Bell Express-Vu to transfer data from the Canadian Ice Service. Inmarsat communications have limitations in the High Arctic. Reception may be lost temporarily due to the vessels proximity to high coastline or if the antenna is located in a blind sector of the ship’s structure, such as a funnel. Moving the ship away from the shoreline or adjusting the ship’s heading can improve reception but eventually the signal may be lost above latitudes 77° - 82°N. The Iridium Satellite System is the only provider of global, mobile satellite voice and data solutions completely covering the Earth including oceans, airways and Polar Regions. In addition to improved transmission methods, there is a need for improved compression techniques for high resolution images, which would also reduce the communication costs. 5.5 Use of Ice Information by the Icebreaking Program (National &
Regional)
The Icebreaking Program uses various ice information products such as charts, imagery, forecasts and climatology atlases for:
• Client Consultation and Advice
• Policy/Standards Development, including Icebreaking Operations Levels of Service • Icebreaking Service Fee (determination of zones and dates for the user fee)
• Climate Change (impacts on southern and Arctic operations, adaptation requirements) • Research & Development (to assess the usefulness of new technology and
innovations in improved ice information systems, cold weather equipment and ship design and construction).
5.6 CCG Development of Ice Information Systems
Canadian Coast Guard R&D activities look to the development, testing and evaluation, and application of projects and studies related to safety, marine environment and emergency response, communications and navigation systems, productivity, efficiency and effectiveness in its own operations; and support to other agencies responsible for oceans and marine safety issues. The CCG R&D Program draws on funds from several sources. The major source of funding is the internal reference level. Demands generally exceed the funds available from internal CCG resources. To promote the highest level of achievement, CCG personnel are also encouraged to work with other agencies,
governments, clients and institutions to achieve additional "leveraged" funding and partnership or joint-venture arrangements leading to industrial product.
5.6.1 The Integrated Ice System (IIS)
To help improve the management of flood control operations on the St. Lawrence River, CCG, in partnership with the Canadian Hydrographic Services and Environment Canada, has installed a sophisticated data gathering network on Lac St. Pierre to monitor and measure water levels, velocity of the current, water flows, water and air temperature and direction, as well as wind speed and direction. Video cameras, radars and dynamometers are used to monitor and measure ice conditions at Lanoraie, Lavaltrie, Lac St. Pierre and at the Quebec bridges. This real-time information is available for the Ice Operations Centre in Québec to ensure improved coordination and tasking of icebreakers.
5.6.2 Ice Routing Model
CCG Quebec and DFO’s Maurice Lamontagne Institute have developed an Ice Routing Model to assist the Ice Operations Centre in determining the safest and most efficient route through the Gulf of St. Lawrence in the winter ice season. The surface currents, sea ice and water temperature forecast for the St. Lawrence are extracted from a
three-dimensional model computing the oceanic circulation, under the influence of tides, the St. Lawrence river runoff, the atmospheric forcing, and the sea ice drift, growth and melt. The results of the model are provided in the form of animated graphic images of the chart of the Gulf of Saint Lawrence, which indicate the evolution of the forecast situation on a period of forty eight hours.
Figure 26: Illustration of the ice routing model and ice severity index
5.6.3 ICEggs
The CIS Ice Service Specialist (ISS) have traditionally created ice observation charts manually, by drawing on paper maps while on helicopter or aircraft reconnaissance flights. The charts were either delivered directly to interested personnel by way of a brief verbal résumé or, once the ISS had landed, scanned into a computer after the chart had been redrawn or cleaned up. This consumed a lot of time and human effort and,
unfortunately, sometimes the chart was delayed to a point where it no longer met the needs of the Ice Offices, CIS and of the Marine community. Québec Region developed the ICEggs application which is utilized on a tablet computer connected to a GPS, to enhance the efficiency, effectiveness and the precision of aerial ice conditions
observations and ice conditions data provision. It can reduce the chart development by two hours, is a more accurate representation of the ice conditions and is available immediately following the Ice Reconnaissance flight.

![Figure 2: Map showing the regions of the Zones in the Zone-Date System. ....][][++=C a x IM a C b x IM bIN [1] where IN = Ice Numeral](https://thumb-eu.123doks.com/thumbv2/123doknet/14185306.477004/17.918.137.789.152.682/figure-map-showing-regions-zones-zone-date-numeral.webp)