HAL Id: tel-00448304
https://tel.archives-ouvertes.fr/tel-00448304
Submitted on 18 Jan 2010
HAL is a multi-disciplinary open access
archive for the deposit and dissemination of sci-entific research documents, whether they are pub-lished or not. The documents may come from teaching and research institutions in France or abroad, or from public or private research centers.
L’archive ouverte pluridisciplinaire HAL, est destinée au dépôt et à la diffusion de documents scientifiques de niveau recherche, publiés ou non, émanant des établissements d’enseignement et de recherche français ou étrangers, des laboratoires publics ou privés.
distributions of galaxies
Elisabete da Cunha
To cite this version:
Elisabete da Cunha. Modelling the ultraviolet-to-infrared spectral energy distributions of galaxies. Astrophysics [astro-ph]. Université Pierre et Marie Curie - Paris VI, 2008. English. �tel-00448304�
´
Ecole Doctorale d’Astronomie et Astrophysique d’ˆIle-de-France
Universit´
e Paris VI – Pierre & Marie Curie
DOCTORATE THESIS
to obtain the title of Doctor of the University of Pierre & Marie Curie in Astrophysics
defended by
Elisabete
da Cunha
Modelling the
Ultraviolet-to-Infrared Spectral
Energy Distributions of Galaxies
Thesis Advisor: St´ephane Charlot
prepared at Institut d’Astrophysique de Paris, CNRS (UMR 7095), Universit´e Pierre & Marie Curie, with financial support from the EC Marie
Curie Research Training Network MAGPOP defended on October 9th, 2008
Reviewers Vassilis Charmandaris University of Crete, Greece Hans-Walter Rix MPIA Heidelberg, Germany Advisor St´ephane Charlot IAP, Paris, France
President Patrick Boiss´e IAP, Paris, France
Examinators Jarle Brinchmann Leiden Obs., The Netherlands David Elbaz CEA, Saclay, France
On ne fait jamais attention `a ce qui a ´et´e fait; on ne voit que ce qui reste `a faire. – Marie Curie
Acknowledgments
I would like to thank here the people who have supported and encouraged me during the time of my thesis.
Firstly, I thank my thesis supervisor St´ephane Charlot, for the guidance and encouragement he has given me since the beginning of my thesis. Thank you for all that you have taught me and for always stimulating me to do things better. This learning process was not always easy, nevertheless it has been a privilege to work with you and to learn from you.
A big ‘obrigada’ to Jarle Brinchmann, for your support and advice back in Porto even before I started my thesis. Also for your constant help and interest in my work throughout my thesis, and for giving me the opportunity to go back to CAUP to give a seminar.
I warmly thank David Elbaz for very inspiring discussions, good advices, in-sightful comments, and for always being available to answer my questions. This thesis has much benefited from your expertise on infrared observations of galaxies, your broad knowledge on galaxy evolution, and especially your good humor.
Many thanks also to David Schiminovich for giving me the opportunity to work with the SSGSS team, for having received me so well at Columbia University, and for having matched the SDSS-IRAS sample of Chapter 5 with the latest data from GALEX. I would also like to thank Antara Basu-Zych for the good times and interesting conversations we had in New York, and Ben Johnson for our discussions on the work about the SSGSS sample.
I am also extremely grateful to Celine Eminian, with whom it has been such a pleasure to work with. Thank you so much for your excellent work with our SDSS-IRAS sample, and for being such a good friend and an example of gentleness. All the friends who have supported me, kept me from stressing too much at times, and who made the last three years enjoyable and full of good memories deserve a very especial place here. I thank my friends of the ‘comunidade portuf´onica do IAP’: Tatiana, thank you for all the good times we had in Paris, and for being such a good friend, even from the other side of the ocean; Jaime, for your constant good humour and example of passion for Astronomy; and Paula, thank you for your support, understanding and friendship especially in the last times of my thesis. Vocˆes trouxeram mais luz a Paris.
I am also grateful to my good friends at the IAP: Jakob, Oliver, Gwenael (thank you for our conversations and for being my jogging ‘coach’ !), Guilhem (for the countless times you have helped me with computers), Elisabetta, Jean-Christophe, Alessandro, Fran¸cois (for always making me laugh), Yuko (thank you for the choco-lates) and Florence. I would also like to thank Chantal and Lysiane, for their constant kindness and good will, and all the researchers at the IAP who kept an interest in my work and with whom I have had interesting discussions.
I would also like to thank my MAGPOP friends Vivienne, J´er´emy, Dimitri, Michael, Andrew, Dolf and Anna, with whom I have learnt so much and I also had so much fun in MAGPOP events.
I could not forget my friends from home. Thank you for all the support and encouragement you have given me, and for the great fun we always have when we get together again, especially Filipe and B´arbara (sobretudo pelas boas mem´orias da vossa visita a Paris), but also Cristina ‘Rasteirinha’, Paula, Ana, Rui ‘Waffles’, a Carol, Jo˜ao e o resto do ‘pipˆole’.
I wish to thank the especial person with whom I have shared my life in the last years. Obrigada Brent, for all your love, support and understanding, for being there for me even when far away, for knowing the right times to be a boyfriend and an astronomer, for showing me wonderful Oz and your beautiful family, for making me discover so many new things. And thank you for having been the first reader of my thesis manuscript, for your help, advices and constructive criticism. You have kept me smiling even in the toughest moments.
Finally, I thank my family in Portugal. Um agradecimento especial `a minha fam´ılia. Obrigada pelo apoio constante, mesmo de longe, e especialmente a mam˜a e ao pap´a, pelo exemplo de coragem que me tˆem dado para atravessar os momentos dif´ıceis.
I gratefully acknowledge financial support from the European Community for a Marie Curie PhD Fellowship through the MAGPOP Research and Training Net-work. I thank the network coordinator, Guinevere Kauffmann, as well as all the node coordinators of the network for making this possible.
Abstract
The spectral energy distributions of galaxies at ultraviolet, optical and infrared wavelengths are clues to both the radiation produced by stellar populations and the effect of gas and dust in the interstellar medium (ISM) on this radiation. Spectral interpretation studies are therefore crucial to understand how galaxies formed and evolved. Observationally, combined ultraviolet, optical and infrared data are now becoming available for large samples of galaxies. So far, these have focused mainly on the local galaxy population, but future deep surveys will provide observations of large galaxy samples at higher redshifts. To extract constraints on the stellar populations and ISM of galaxies from these multi-wavelength observations requires the consistent modelling of the emission by stars, gas and dust.
In this thesis, we present a simple, largely empirical but physically motivated model, which is designed to interpret consistently multi-wavelength observations from large samples of galaxies in terms of physical parameters, such as star forma-tion rate, stellar mass and dust content. This model relies on an existing angle-averaged prescription to compute the absorption of starlight by dust in stellar birth clouds and in the ambient interstellar medium (ISM) in galaxies. We compute the spectral energy distribution of the power re-radiated by dust in stellar birth clouds as the sum of three components: a component of polycyclic aromatic hydrocarbons (PAHs); a mid-infrared continuum characterising the emission from hot grains at temperatures in the range 130–250 K; and a component of grains in thermal equi-librium with adjustable temperature in the range 30–60 K. In the ambient ISM, we fix for simplicity the relative proportions of these three components to reproduce the spectral shape of diffuse cirrus emission in the Milky Way, and we include a component of cold grains in thermal equilibrium with adjustable temperature in the range 15–25 K.
Our model is both simple and versatile enough to allow the derivation of statis-tical constraints on the star formation histories and dust contents of large samples of galaxies using a wide range of ultraviolet, optical and infrared observations. We illustrate this by deriving median-likelihood estimates of a set of physical parame-ters describing the stellar and dust contents of local star-forming galaxies from three different samples. The model reproduces well the observed spectral energy distribu-tions of these galaxies across the entire wavelength range from the far-ultraviolet to the far-infrared, and the star formation histories and dust contents of the galaxies are well constrained.
A main advantage provided by this model is the ability to study the relation between different physical parameters of observed galaxies in a quantitative and statistically meaningful way. Our analysis of star-forming galaxies from the Spitzer Infrared Nearby Galaxy Sample (SINGS) and the Spitzer-SDSS-GALEX Spectro-scopic Survey (SSGSS) reveals that the mid- and far-infrared colours of galaxies correlate strongly with the specific star formation rate, as well as with other
galaxy-wide quantities connected to this parameter, such as the ratio of infrared luminosity between stellar birth clouds and the ambient ISM, the contributions by PAHs and grains in thermal equilibrium to the total infrared emission, and the ratio of dust mass to stellar mass. These correlations provide important insight into the link between star formation and ISM properties in galaxies.
We investigate further the relation between star formation activity and dust con-tent in galaxies by assembling a large sample of 3321 galaxies with available obser-vations at ultraviolet (GALEX), optical (SDSS) and infrared (IRAS) wavelengths. We find that the star formation rate correlates remarkably well with galaxy dust mass over four orders of magnitude in both quantities. This allows us to provide a simple empirical recipe to estimate the total dust mass of galaxies from the star formation rate. We compare our findings with the predictions from recent models of the chemical evolution of galaxies. We also compare the relations between the specific star formation rate, the ratio of dust luminosity to stellar mass and the ra-tio of dust luminosity to star formara-tion rate obtained from our analysis with those predicted by state-of-the-art cosmological simulations of galaxy formation.
The model presented in this thesis can be straightforwardly applied to inter-pret ultraviolet, optical and infrared spectral energy distributions from any galaxy sample.
R´
esum´
e
Les distributions spectrales d’´en´ergie des galaxies en ultraviolet, optique et in-frarouge nous donnent des pistes sur le rayonnnement produit par les populations stellaires et l’effet du gaz et de la poussi`ere du milieu interstellaire sur ce ray-onnement. Des ´etudes d’interpretation spectrale sont donc d´eterminantes pour comprendre la formation et l’´evolution des galaxies. Observationellement, des donn´ees en ultraviolet, optique et infrarouge deviennent disponibles pour des grands ´echantillons de galaxies. Jusqu’`a pr´esent, ces ´etudes se sont concentr´ees principale-ment sur la population locale de galaxies, mais de futurs relev´es plus profonds apporteront des observations de grands ´echantillons de galaxies a des plus grandes d´ecalages spectrales vers le rouge. Pour extraire des contraintes sur les populations stellaires et le milieu interstellaire des galaxies a partir de ces observations multi-longueur d’ondes, on a besoin de mod´eliser d’une fa¸con coh´erente l’´emission par les ´etoiles, le gaz et les poussi`eres.
Cette th`ese pr´esente un mod`ele simple, largement empirique mais avec une motivation physique, qui est d´estin´e a interpreter syst´ematiquement les observa-tions multi-longueur d’ondes de grands ´echantillons de galaxies en termes de ses param`etres physiques, comme par exemple le taux de formation d’´etoiles, la masse stellaire et le contenu en poussi`ere. Ce mod`ele est reli´e a un mod`ele d´ej`a existant qui permet de calculer l’absorption de la lumi`ere des ´etoiles par la poussi`ere dans les nuages moleculaires ou sont n´ees les ´etoiles et dans le milieu interstellaire envi-ronment des galaxies. On calcule la distribution spectrale de l’energie re-´emise par la poussi`ere dans les nuages de formation d’´etoiles comme la somme de trois com-posantes: une composante de hydrocarbures aromatiques polycycliques (PAHs); un continu en infrarouge moyen qui caracterize l’´emission par des grains de poussi`ere a des temp´eratures dans la gamme 130–250 K; et une composante de grains en ´equilibre th´ermique avec temp´erature r´eglable dans la gamme 30–60 K. Dans le mi-lieu interstellaire environmental, on fixe par simplicit´e les proportions r´elatives de ces trois composantes de fa¸con a r´eproduire la forme spectrale de l’´emission diffuse cirrus de la Voie Lact´ee, et on inclu une composante de grains froids en ´equilibre th´ermique avec temp´erature r´eglable dans la gamme 15–25 K.
Ce mod`ele est au mˆeme temps assez simple et versatile pour permettre d’obtenir de contraintes statistiques sur les taux de formation d’´etoiles et con-tenus en poussi`ere de grands ´echantillons de galaxies en utilisant une vaste gamme d’observations en ultraviolet, optique et infrarouge. On illustre ce fait en tirant des estimations de ‘vraisemblence mediane’ d’une s´erie de parametres physiques qui d´ecrivent le contenu en ´etoiles et en poussi`eres de galaxies `a formation d’´etoiles locales provennant de trois ´echantillons diff´erents. Le mod´ele r´eproduit bien les distributions spectrales d’´energie observ´ees de ces galaxies dans toute la gamme de longueur d’onde de l’ultraviolet lointain `a l’infrarouge lointain, et les histoires de formation d’´etoiles et contenus en poussi`eres sont bien contraints.
Une des avantages de ce mod`ele est la capacit´e d’´etudier le rapport entre des diff´erents parametres physiques des galaxies observ´ees d’une mani`ere quantitative et statistiquement significative. L’analyse des galaxies `a formation d’´etoiles des ´echantillons Spitzer Infrared Nearby Galaxy Sample (SINGS) et Spitzer-SDSS-GALEX Spectroscopic Survey (SSGSS) r´ev`ele que les couleurs des galaxies en infrarouge moyen et lointain sont fortement corr´el´ees avec le taux de formation d’´etoiles sp´ecifique, aussi bien que avec d’autres quantit´es galactiques reli´ees a ce parametre, comme par example le rapport entre la luminosit´e infrarouge des r´egions de formation d’´etoiles et celle du milieu interstellaire environment, les contribu-tions par des PAHs et grains de poussi`ere en ´equilibre th´ermique pour l’´emission infrarouge totale, et le rapport entre la masse de poussi`ere et la masse d’´etoiles. Ces corr´elations fournissent des informations importantes sur le lien entre la formation d’´etoiles et les propri´etes du millieu interstellaire dans les galaxies.
On ´etudie d’avantage le rapport entre l’activit´e de formation d’´etoiles et le contenu en poussi`eres des galaxies. Pour cela, on rassemble un grand ´echantillon de 3321 galaxies avec des observations disponibles en ultraviolet (GALEX), optique (SDSS) et infrarouge (IRAS). On trouve que le taux de formation d’´etoiles corr`ele remarquablement bien avec la masse de poussi`ere des galaxies sur quatre ordres de grandeur en les deux quantit´es. Cela nous permet de fournir une recette empirique simple pour ´evaluer la masse totale de poussi`ere des galaxies `a partir du taux de formation d’´etoiles. On compare nos r´esultats avec les pr´edictions de mod`eles recents de l’´evolution chimique des galaxies. On compare aussi les corr´elations entre le taux de formation d’´etoiles sp´ecifique, le rapport entre la luminosit´e de poussi`ere et la masse d’´etoiles, et le rapport entre la luminosit´e de poussi`ere et le taux de formation d’´etoiles obtenus dans notre analyse avec ceux qui sont pr´evus par des modernes simulations cosmologiques de formation des galaxies.
Le mod`ele pr´esent´e dans cette th`ese peut ˆetre appliqu´e simplement pour inter-preter les distributions spectrales d’´energie de n’importe quel ´echantillon de galax-ies.
Contents
Acknowledgments v
Abstract vii
R´esum´e ix
List of Figures xix
List of Tables xxi
1 Introduction 1
1.1 Galaxy basics . . . 1
1.2 The spectral energy distributions of galaxies . . . 4
1.3 The production of starlight in galaxies . . . 7
1.3.1 Stellar populations in galaxies . . . 7
1.3.2 Stellar population synthesis models . . . 8
1.3.3 The star formation history . . . 17
1.4 The transfer of starlight in the interstellar medium . . . 21
1.4.1 Generalities . . . 23
1.4.2 Description of the ISM in this thesis . . . 28
1.4.3 Influence of interstellar dust on galactic emission . . . 30
1.5 Summary . . . 47
2 A simple model to interpret the emission from galaxies 51 2.1 Introduction . . . 51
2.2 The model . . . 53
2.2.1 Stellar emission and attenuation by dust . . . 53
2.2.2 Infrared emission of the dust . . . 55
2.2.3 Combined ultraviolet, optical and infrared spectral energy distributions . . . 69
2.3 Applicability of the model . . . 70
2.4 Summary and conclusion . . . 72
3 The physical properties of a sample of nearby galaxies 73 3.1 Introduction . . . 73
3.2 Methodology . . . 73
3.2.1 Model library . . . 74
3.2.2 Statistical constraints on physical parameters . . . 75
3.3 Application to the SINGS sample . . . 78
3.3.1 The sample . . . 78
3.3.3 Sample statistics . . . 89
3.4 Comparison with previous models . . . 92
3.5 Potential sources of systematic errors . . . 93
3.5.1 Star formation prior . . . 93
3.5.2 Attenuation law . . . 95
3.5.3 Inclination . . . 95
3.6 Summary and conclusion . . . 95
4 The physical properties of star-forming galaxies at z∼ 0.1 97 4.1 Introduction . . . 97
4.2 The sample . . . 98
4.2.1 Composition of the SSGSS sample . . . 99
4.2.2 Comparison of the SSGSS and SINGS samples . . . 101
4.2.3 PAH emission of SSGSS galaxies . . . 101
4.3 Statistical constraints on physical parameters . . . 104
4.3.1 The method . . . 104
4.3.2 Results . . . 106
4.3.3 Comparison of the physical properties of SSGSS and SINGS galaxies . . . 108
4.4 Observed mid-infrared spectra . . . 109
4.4.1 Comparison with the best fit models to observed photometry 109 4.4.2 Study of the detailed mid-infrared spectra . . . 112
4.5 Summary and conclusion . . . 114
5 The relation between star formation and dust content 117 5.1 Introduction . . . 117
5.2 The galaxy sample . . . 118
5.2.1 Optical photometry . . . 119
5.2.2 UV photometry . . . 119
5.2.3 Near-IR photometry . . . 120
5.2.4 Mid- and far-infrared photometry . . . 120
5.2.5 Final sample . . . 121
5.3 Constraints on physical parameters . . . 123
5.3.1 Description of the model . . . 124
5.3.2 Median-likelihood estimates of physical parameters . . . 125
5.4 The relation between star formation and dust content . . . 129
5.4.1 Results . . . 129
5.4.2 Results in stellar mass ranges . . . 132
5.4.3 Comparison with chemical evolution models . . . 134
5.5 Discussion . . . 136
5.5.1 The effect of inclination . . . 136
5.5.2 Contamination by AGN hosts . . . 138
5.5.3 Comparison with the GALICS simulation . . . 139
Contents xiii
5.5.5 Implications for studies of galaxies at high redshifts . . . 143 5.6 Summary and conclusion . . . 144
6 Conclusion 147
A Physical constants 151
B Derived physical parameters of the SINGS galaxies 153
List of Figures
1.1 The ‘tuning fork’ diagram describing the morphological galaxy classification scheme by Hubble. Figure credits: Fahad Suleria, www.novacelestia.com (Astronomical illustrations and space art). . 2 1.2 The nearby spiral galaxy M 51 imaged at optical (left) and infrared
wavelengths (right). Image credits: Visible image: Digitized Sky Sur-vey; Infrared image: NASA/JPL-Caltech/R. Kennicutt (University of Arizona). . . 4 1.3 Example of the ultraviolet-to-infrared spectral energy distribution of
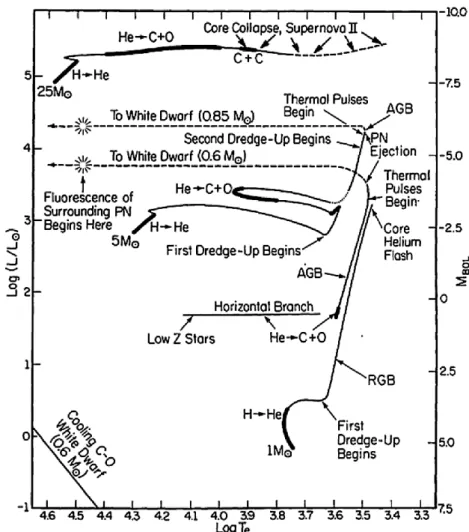
a typical galaxy forming stars at a rate of 1 M⊙yr−1. The continuum emission was computed using the models described in Chapter 2 of this thesis. The nebular emission lines were computed consistently using the prescription of Charlot & Longhetti (2001). . . 5 1.4 Evolutionary tracks in the Hertzprung-Russel diagram for three
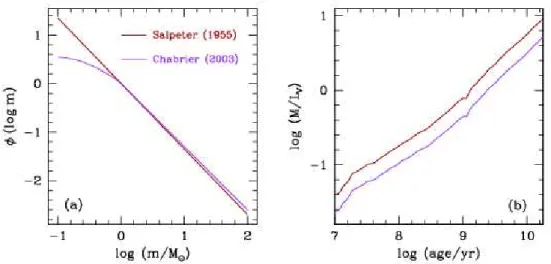
model stars with low (1 M⊙), intermediate (5 M⊙) and high (25 M⊙) initial masses. . . 10 1.5 Comparison between Salpeter (1955) and Chabrier (2003) initial
mass functions. . . 14 1.6 Example of isochrones with solar metallicity computed using the
lat-est version of the ‘Padova 1994’ stellar evolution prescription. . . 15 1.7 Spectral evolution of a standard SSP with solar metallicity. . . 17 1.8 Schematic representation of the evolution of star formation rate
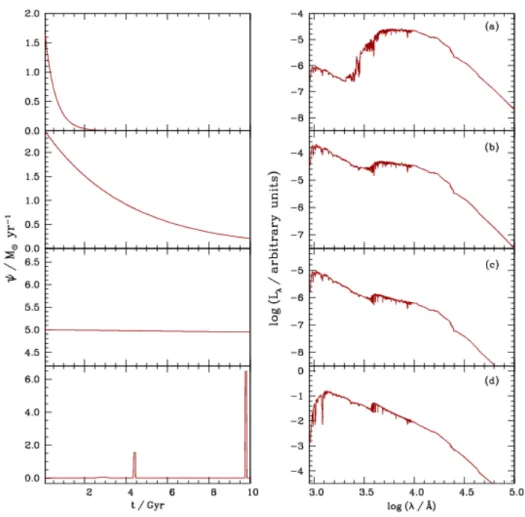
ac-cording to Hubble type from Sandage (1986). . . 18 1.9 Examples of star formation histories and spectral energy
distribu-tions of: (a) an elliptical galaxy, (b) an early-type spiral, (c) a late-type spiral, and (d) an irregular galaxy. . . 20 1.10 Schematic representation of the main interactions that occur between
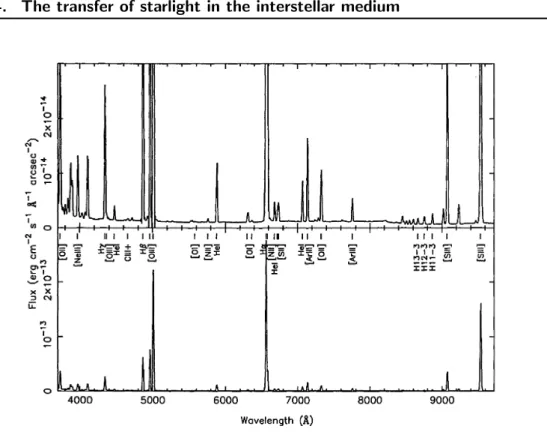
the stars and the interstellar medium of galaxies. . . 22 1.11 Typical optical emission spectrum of a H ii region. . . 25 1.12 Optical spectrum of the starburst galaxy M 82. . . 27 1.13 Schematic representation of the birth cloud and ambient ISM
sur-rounding each generation of stars in a model galaxy. . . 29 1.14 Right: Optical image of the SW part of the star-forming region M17
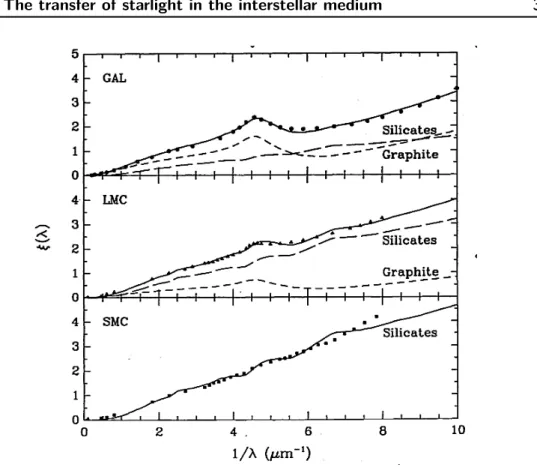
taken with the WFPC2 instrument on the Hubble Space Telescope. Left: Mid-infrared spectrum of the H ii region (in blue) and of the photo-dissociation region (in red) extracted from ISO/ISOCAM ob-servations. . . 30 1.15 W5 star-forming region in the constellation of Cassiopeia. . . 31 1.16 Comparison between the extinction curves of the Milky Way, Large
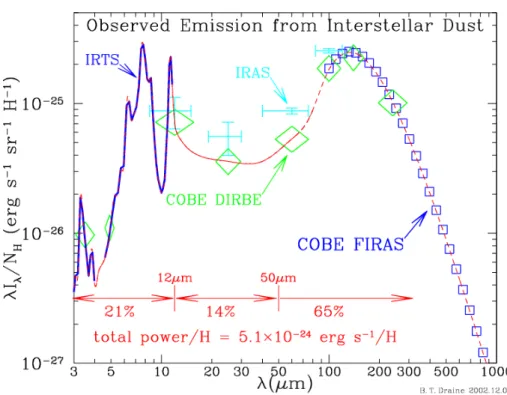
1.17 Emission from the diffuse interstellar dust of the Milky Way between 3 and 1000 µm. . . 40 1.18 Interstellar dust grain temperature as a function of time for four
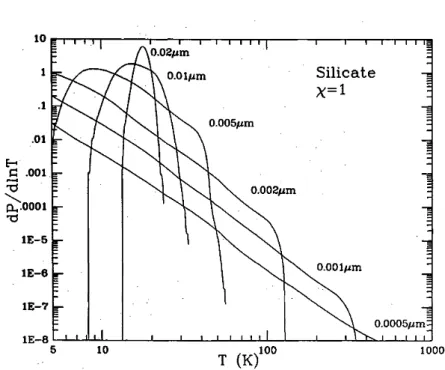
grains of different radius a heated by the average galactic interstellar radiation field. . . 41 1.19 Temperature distributions for silicate grains of various sizes exposed
to the interstellar radiation field. . . 42 1.20 Emission spectra of mixtures of graphite and silicate grains with
various size distributions, heated by the average interstellar radiation field. . . 44 1.21 Emission spectrum of the reflection nebula NGC 7023 measured by
ISO/ISOCAM (Cesarsky et al. 1996). . . 45 1.22 Average Spitzer/IRS spectrum of 13 starburst galaxies, compared
with the ISO/SWS spectrum of the galaxy M82. . . 46 1.23 Examples of observed mid-infrared spectra of a quiescent starforming
region (M 82 disk), a starburst region (M 82 nucleus) and an AGN (NGC 1068 nucleus). . . 47 2.1 Best fit model to the observed mean spectral energy distribution of
the Galactic cirrus emission. . . 60 2.2 Example of an infrared spectral energy distribution computed using
our model. . . 63 2.3 Coulour-coulour diagrams showing the ratio of 60-µm to 100-µm
IRAS luminosity density potted against the ratio of 12-µm to 25-µm IRAS luminosity density for a sample of 109 galaxies. Each panel shows the effect of varying one parameter of the model with all the other parameters fixed. . . 64 2.4 Coulour-coulour diagrams showing the ratio of 15-µm to 60-µm ISO
and IRAS luminosity density potted against the ratio of 6.75-µm to 15-µm ISO luminosity density for a sample of 109 galaxies. Each panel shows the effect of varying one parameter of the model with all the other parameters fixed. . . 65 2.5 Examples of spectral energy distributions from the ultraviolet to the
far-infrared computed using our model. . . 71 3.1 Median-likelihood estimates of 12 parameters of our model recovered
from the spectral fits of 100 mock galaxies, compared to the true values of these parameters. . . 77 3.2 Selected properties of the SINGS galaxies. . . 79 3.3 Distribution of the difference between the observed luminosity and
the best-fit model luminosity for 66 galaxies of the SINGS sample. . 81 3.4 Best model fits to the observed spectral energy distributions of the
List of Figures xvii
3.5 Likelihood distributions of physical quantities derived from fits to the observed ultraviolet, optical and infrared spectral energy distri-butions of NGC 3521, NGC 337 and Mrk 33. . . 84 3.6 Likelihood distributions of physical quantities derived from fits to
the observed ultraviolet, optical and infrared spectral energy distri-butions of NGC 3521, NGC 337 and Mrk 33. . . 85 3.7 Estimates of the total infrared luminosity Ldtotderived from fits of the
observed ultraviolet (GALEX FUV and NUV), optical (RC3 UBV) and near-infrared (2MASS JHKs) luminosities, plotted against es-timates of the same quantity when including also the constraints from Spitzer (IRAC 3.6, 4.5, 5.8 and 8.0 µm and MIPS 24, 70, and 160 µm), for 61 galaxies with GALEX measurements in the SINGS sample. . . 88 3.8 Spitzer infrared colours plotted against median-likelihood estimates
of the star formation rate, for 66 SINGS galaxies. . . 91 3.9 Median-likelihood estimates of galaxy properties plotted against
spe-cific star formation rate, for 66 SINGS galaxies. . . 92 3.10 Fits by various models to the observed infrared (Spitzer IRAC and
MIPS, ISO, IRAS and SCUBA) spectral energy distributions of the galaxies NGC 3521, NGC 337 and Mrk 33. . . 94 4.1 NUV-IRAC(3.6 µm) color plotted against stellar mass M∗ (left
panel), and NUV-IRAC(3.6 µm) plotted against Dn(4000) (right panel) for Lockman Hole sample galaxies (in black). The SSGSS sample is selected by performing a 24-µm flux cut at 1.5 mJy (in blue, and 5 mJy for bright sample, in red). This yields a large num-ber of galaxies with a representative distribution of mass, colour, and star formation history out to redshift z < 0.2 (right panel). . . 99 4.2 Baldwin, Phillips & Terlevich (1981) diagram for the SSGSS galaxies. 100 4.3 Comparison between the observed properties of the SSGSS and the
SINGS sample. . . 102 4.4 Comparison between the average PAH spectrum of the SSGSS
sam-ple and the M 17 PDR mid-infrared spectrum . . . 103 4.5 Distribution of the difference between the observed luminosity and
the best-fit model luminosity for the galaxies of the SSGSS sample. . 106 4.6 Example of best model fit to the observed spectral energy distribution
of one of the galaxies of the SSGSS sample. . . 107 4.7 Median-likelihood estimates of galaxy properties plotted against
spe-cific star formation rate for the 100 SSGSS galaxies, and comparison with the median-likelihood estimates of the same parameters for the SINGS galaxies. . . 108
4.8 Comparison between the best fit model to the observed photometry and the observed Spitzer/IRS spectrum for six galaxies of the SSGSS sample: SSGSS 14, SSGSS 16, SSGSS 36, SSGSS 72, SSGSS 88 and SSGSS 94. These are examples of cases where the models which best fit the photometric data are in good agreement with the observed IRS spectra. . . 110 4.9 Comparison between the best fit model to the observed photometry
and the observed Spitzer/IRS spectrum for two galaxies of the SSGSS sample: SSGSS 18 (left panel) and SSGSS 64 (right panel). For these two galaxies, the fit to the photometric points using our model fails at reproducing the detailed shape of the mid-infrared spectrum, particularly the silicate absorption feature at 9.7 µm. . . 111 4.10 Comparison between the best fit model to the observed photometry
and the observed Spitzer/IRS spectrum for two galaxies of the SSGSS sample classified as AGN: SSGSS 13 (left panel) and SSGSS 61 (right panel). . . 112 4.11 Spitzer/IRS spectrum of the closest galaxy in the SSGSS sample
(SSGSS 67, at z = 0.031), corrected to rest-frame. In blue, we show the main nebular emission lines that can be observed in the IRS spectra of the SSGSS galaxies (see Table 4.1). Red lines show the main PAH emission features (e.g. Draine & Li 2007; Smith et al. 2007.) . . . 113 5.1 Total infrared luminosity plotted against the redshift for our galaxies
in the IRAS PSCz catalogue and in the IRAS FSC catalogue. . . 121 5.2 Properties of the SDSS DR6 star-forming galaxies (in grey) and the
subsample considered in this paper (in black). In panels (a), (b), and (c), the histograms show the normalized distributions of the following parameters: (a) Redshift; (b) Galaxy g − r model colour, k-corrected to z = 0.1; (c) Absolute r-band model magnitude. In panel (d), we plot the absolute r-band model magnitude as function of redshift for both samples. . . 122 5.3 Distribution of the difference between the observed luminosity and
the best-fit model luminosity for the galaxies in our sample. . . 128 5.4 Best fit model to the observed spectral energy distribution of one
galaxy in our sample with median properties in Fig. 5.6, IRAS F15028+0820. . . 129 5.5 Median-likelihood estimate of the dust mass, Md, against star
for-mation rate averaged over the last 108 yr, ψ, for the 3321 galaxies of our sample and the SINGS galaxies. . . 130
List of Figures xix
5.6 Top: Median-likelihood estimate of three galaxy properties against specific star formation rate, ψS. Left panel – ratio of dust mass to stellar mass, Md/M∗; middle panel – ratio of dust mass to star for-mation rate, Md/ψ; right panel – fration of total infrared luminosity contributed by dust in the ambient ISM. Bottom: In these panels, we show the same relations for galaxy pairs in our sample that are closely matched in stellar mass. . . 132 5.7 Same relations as in Fig. 5.6 in three stellar mass ranges indicated
at the top of the figure (blue – log (M∗/M⊙) < 0.2; yellow – 10.2 < log (M∗/M⊙) < 0.7; red – log (M∗/M⊙) > 0.7). The right-hand panels illustrate how the distribution of the dust-to-stellar mass ratio, the dust mass to star formation rate ratio and the fraction of total infrared luminosity contributed by dust in the ambient ISM evolve with stellar mass. The median value of the distribution is indicated as a short line of the corresponding colour. . . 133 5.8 Comparison between our sample median-likelihood estimates and
theoretical predictions from the chemical evolution models of Calura, Pipino & Matteucci (2008), for the dust-to-stellar mass ratio (top panel) and ratio of dust mass to star formation rate (bottom panel) against specific star formation rate. . . 135 5.9 Galaxy properties against axis ratio b/a (i.e. inclination) for the
galaxies in our sample: (a) apparent r-band magnitude, mr; (b) stel-lar mass, M∗; (c) star formation rate, ψ; (d) total infrared luminosity, Ldtot; (e) dust mass, Md; (f) fraction of Ldtot contributed by dust in the diffuse ISM, fµ. . . 137 5.10 Comparison between the median-likelihood estimates for our
sam-ple (gray points) and the predictions of the galics simulations (red squares) for: (a) Total infrared luminosity Ltot
d against observed red-shift z; (b) Star formation rate ψ against stellar mass M∗; (c) Ratio of the total infrared luminosity to stellar mass Ldtot/M∗ against spe-cific star formation rate ψS; (d) Ratio of the total infrared luminosity to star formation rate Ldtot/ψ against specific star formation rate ψS. 140 5.11 Left panel: median-likelihood estimate of the total effective V -band
absorbtion optical depth of the dust seen by young stars inside stel-lar birth clouds, ˆτV, against the dust mass, Md, for the galaxies in our sample. Right panel: median-likelohood estimate of the effective V -band absorbtion optical depth of the dust seen by stars older than 107 yr in the ambient ISM, µˆτV, against the dust mass. The error bars represent the median confidence intervals for the estimated pa-rameters. The Spearman rank coefficient, rS, is indicated on the top left corner of each panel. . . 142
List of Tables
1.1 Summary of the physical properties of the main ISM phases of the Milky Way. . . 28 1.2 Processes which cause the main infrared aromatic features observed
in astrophysical media. . . 44 2.1 Parameters of the ‘standard’, ‘cold’ and ‘hot’ models plotted in
Figs. 2.3 and 2.4. . . 68 3.1 Correlations between three Spitzer infrared colours L8
ν/L24ν , L24ν /L70ν and L70ν /L160ν and the median likelihood estimates of several physical parameters constrained using our model, for 66 SINGS galaxies. . . . 90 4.1 Main mid-infrared nebular emission lines detectable in the
Spitzer/IRS spectra of galaxies. . . 113 A.1 Physical and astronomical constants used in this thesis. . . 151 B.1 Median-likelihood estimates and confidence intervals of five
param-eters derived for the SINGS galaxies: fraction of the total infrared luminosity contributed by dust in the ambient ISM; fraction of the total V -band absorption optical depth of the dust contributed by the ambient ISM; total effective V -band absorption optical depth of the dust; effective V -band absorption optical depth of the dust in the ambient ISM; logarithm of the specific star formation rate. . . 153 B.2 Median-likelihood estimates and confidence intervals of three more
parameters derived for the SINGS galaxies: logarithm of the stellar mass; logarithm of the dust mass; and logarithm of the total dust luminosity. . . 156 B.3 Median-likelihood estimates and confidence intervals of six more
pa-rameters derived for the SINGS galaxies: global contributions (i.e. including stellar birth clouds and the ambient ISM) by PAHs, the hot mid-infrared continuum and warm dust in thermal equilibrium to the total infrared luminosity; equilibrium temperature of warm dust in stellar birth clouds; contribution by cold dust in thermal equilibrium to the total infrared luminosity; and equilibrium temperature of cold dust in the ambient ISM. . . 159
Chapter 1
Introduction
One of the greatest scientific breakthroughs of the last century was the discovery by Edwin Hubble, in 1925, that the Milky Way is not the only galaxy in the Uni-verse. Until then, it was believed that the Universe did not extend beyond our own Galaxy, and observed external galaxies were thought to be diffuse ‘nebulae’ within the Galaxy. Hubble (1925) measured the distance to these ‘nebulae’ and realised that some of the observed nebulae were in fact too distant to be part of the Milky Way. Moreover, based on their distance and angular size on the sky, he concluded that these objects had similar sizes to our Galaxy and therefore they could be stellar systems of the same kind as the Milky Way, i.e. galaxies. This discovery marked the start of the fascinating field of Extragalactic Astronomy.
1.1
Galaxy basics
To set the framework of this thesis, we first briefly summarize some essential facts about galaxies.
The morphology of galaxies. Galaxies exhibit a wide variety of shapes. Hubble com-piled observations of galaxies and elaborated a morphological classification scheme, the Hubble sequence (Hubble 1926), which is still widely used in modern Astro-physics (see also the revised Hubble sequence by de Vaucouleurs 1974). In this scheme, galaxies are classified as ‘ellipticals’ (E), ‘lenticulars’ (S0),‘spirals’ (S), ‘barred spirals’ (SB) and irregulars (Irr).
Fig. 1.1 summarizes this classification. Elliptical galaxies, as the name indicates, appear as ellipses, and show smooth light distributions. They are classified as En, where n is a measure of the ellipticity which varies between 0 (nearly circular) and 7 (very elongated). This quantity is computed from the observed major axis a and minor axis b as n = 10 × (a − b)/a. Elliptical galaxies represent only about 20 per cent of the total number of galaxies in the local Universe, but they represent 50 per cent of the total mass. Spiral galaxies are the most numerous type in the local Universe. They present a flat disc with spiral arms and a central spherical bulge. These galaxies are divided in two types: normal spirals and barred spirals, depending on the existence of a central bar. In each of these types, galaxies are classified from ‘types’ (Sa and SBa) to ‘late-types’ (Sc and SBc). From early-to late-types, the relative size of the bulge relative early-to the disc decreases, the spirals arms become more separated, and the amount of gas and dust in the interstellar medium (ISM), as well as the number of young blue stars increases. Lenticular
Figure 1.1: The ‘tuning fork’ diagram describing the morphological galaxy classi-fication scheme by Hubble. Figure credits: Fahad Suleria, www.novacelestia.com (Astronomical illustrations and space art).
galaxies are an intermediate type between ellipticals and spirals. They present an important bulge, but also a disc component. The disc of a lenticular galaxy is very different from that of a spiral galaxy, with typically very little gas and almost no star formation occurring. Finally, irregular galaxies are galaxies with no regular structure, i.e. they do not exhibit a clear spherical or disc component.
An interesting property of the Hubble sequence is that galaxies are found to form not only a morphological sequence, but also a sequence in physical properties such as the integrated colour and the amount of gas in the interstellar medium (see Roberts & Haynes 1994 for a review). We will see in Section 1.3.3 that the properties of galaxies along the Hubble sequence can be explained by different histories of star formation (see also Sandage 1986; Kennicutt 1998a). However, current models of galaxy formation cannot yet fully explain how the galaxies we see today have formed and evolved.
The expanding Universe. After having established that galaxies are extragalactic objects, Hubble made an observation that revolutionised Cosmology. He observed that the light emitted by distant galaxies was shifted towards longer wavelengths, and that this ‘redshift’ was proportional to the distance to the galaxies. Based on the Doppler effect1, he concluded that galaxies are moving away from the Milky Way, and that their recession velocities increase with distance (Hubble 1929; Hubble
1
The Doppler effect, or Doppler shift, is the change in frequency and wavelength of a wave for an observer moving relative to the source of the wave. The received frequency is higher than the emitted frequency when the source approaches the observer and is lower than the emitted frequency when the source is moving away from the observer.
1.1. Galaxy basics 3
& Humason 1931). This has become known as the Hubble law, which can be written
cz = H0d , (1.1)
where cz is the recession velocity of the galaxy (c designates the speed of light and z the cosmological ‘redshift’), H0 is the ‘Hubble constant’ and d is the dis-tance to the galaxy. The Hubble constant is a fundamental cosmological parame-ter. The best modern estimates place the value of this parameter between 70 and 75 km s−1 Mpc−1. The observed cosmological redshift z quantifies the amount by which the radiation emitted by a galaxy is shifted towards longer wavelengths: z = λobs− λem
λem
. (1.2)
The observed cosmological redshift is a widely used tool in Extragalactic Astronomy, as it provides a way of determining distances to galaxies.
An important cosmological consequence of Hubble’s law is that the Universe is expanding. Aleksander Friedmann had demonstrated that an expanding universe was one possible solution of Einstein’s equations in the framework of General Rel-ativity. However, until Hubble’s discovery, cosmologists preferred the solution of a static Universe. Georges Lemaitre, based on Friedmann’s equations and on Hub-ble’s observations, has set the basis of modern cosmology theories of the ‘Big Bang’. These theories aim at explaining the evolution of the Universe as it expands from a hot and dense initial state.
Galaxy formation and evolution. One of the most important challenges of modern Astrophysics is to explain the formation and evolution of galaxies in the framework of current cosmological theories.
Observations of the cosmic microwave background radiation and of the large scale distribution of galaxies show that the Universe is homogeneous and isotropic on large scales. However, detailed studies of the cosmic microwave background radiation using observations from the Cosmic Background Explorer (COBE; Smoot et al. 1992) have shown that very small density fluctuations existed in the early universe. Theories of structure growth explain that the structures we observe in the present-day Universe, such as galaxies and clusters of galaxies, have evolved from these primordial density fluctuations. In the current picture, as the Universe expanded and cooled down, over-dense clumps of matter condensed and grew by attracting gravitationally more dark matter and baryonic matter. These structures formed the first galaxies.
While modern cosmological simulations can successfully explain the gravita-tional evolution of dark matter in the Universe and reproduce the large-scale dis-tribution of dark matter, the detailed evolution of baryonic matter is still unclear. Much remains to be explained on how galaxies have formed stars and metals inside dark matter haloes throughout the history if the Universe. To investigate this, the physical processes governing the evolution of baryonic matter in galaxies (i.e. stars,
Figure 1.2: The nearby spiral galaxy M 51 imaged at optical (left) and infrared wavelengths (right). Image credits: Visible image: Digitized Sky Survey; Infrared image: NASA/JPL-Caltech/R. Kennicutt (University of Arizona).
gas and dust) need to be understood in detail. This requires observations of large samples of galaxies at different evolutionary stages of the Universe (i.e. different redshifts). In addition, to relate these observations to theories of galaxy forma-tion, we need models to interpret the light emitted by galaxies in terms of physical parameters such as star formation rate, metallicity and dust content.
1.2
The spectral energy distributions of galaxies
Galaxies emit radiation across the full electromagnetic spectrum. Most of the en-ergy is emitted in the ultraviolet, optical and infrared spectral ranges. This emission originates primarily from stellar radiation, either direct or reprocessed by gas and dust in the ISM. Observations at different wavelengths probe these different com-ponents in different ways. As an example, in Fig. 1.2, we compare the optical image of a well-known nearby spiral galaxy, M 51, with an image taken at infrared wave-lengths. The optical image (on the left) reveals the direct radiation from stars. This image also evidences large dusty clouds in the galaxy spiral arms, which absorb the light radiated by stars. These dust clouds shine in the infrared image (right-hand side of Fig. 1.2), because they reradiate ultraviolet and optical light absorbed from stars at these longer wavelengths. Hence, the relative distribution of spectral energy at ultraviolet, optical and infrared wavelengths contains valuable information about the production of starlight in a galaxy and its absorption by dust. In Fig. 1.3, we show an example of spectral energy distribution of a galaxy forming stars at a rate of 1 M⊙/yr
−1
. The shape of the spectral energy distribution depends on both the radiation emitted by the stellar population of the galaxy and the interaction of this
1.2. The spectral energy distributions of galaxies 5
Figure 1.3: Example of the ultraviolet-to-infrared spectral energy distribution of a typical galaxy forming stars at a rate of 1 M⊙ yr−1. The continuum emission was computed using the models described in Chapter 2 of this thesis. The nebu-lar emission lines were computed consistently using the prescription of Charlot & Longhetti (2001).
radiation with the gas and dust in the ISM of the galaxy.
In the past, when only ground-based telescopes were available, observations of galaxies were limited to optical and near-infrared wavelengths. Only in the past few decades have ultraviolet and infrared observations become available thanks to improvements of observational technology and the launch of stratospheric and space telescopes. These observatories have brought new insights into the physical processes occurring in galaxies. Nowadays, observations at ultraviolet, optical and infrared wavelengths are becoming available for large samples of galaxies. These include:
• ultraviolet observations from space by the Galaxy Evolution Explorer (GALEX, Martin et al. 2005);
• optical ground-based observations by the Two-degree Field Galaxy Red-shift Survey (Colless et al. 2001) and the Sloan Digital Sky Survey (SDSS, Stoughton et al. 2002);
• near-infrared ground-based observations by the Two Micron All Sky Survey (2MASS, Skrutskie et al. 1997);
• space-based observations in the mid- and far-infrared by the Infrared Astro-nomical Satellite (IRAS, Beichman et al. 1988), the Infrared Space
Observa-tory (ISO, Kessler et al. 1996) and the Spitzer Space Telescope (Werner et al. 2004);
Extracting constraints on the stellar populations and ISM of galaxies from these multi-wavelength observations requires the consistent modelling of the emission by stars, gas and dust.
A standard approach to model consistently the emission from stars and dust in galaxies has been to solve the radiative transfer equation for idealised (bulge + disc) spatial distributions of stars and dust (e.g. Rowan-Robinson 1980; Efstathiou & Rowan-Robinson 1990; Gordon et al. 2001; Misselt et al. 2001; Popescu et al. 2000; Misiriotis et al. 2001). More sophisticated models couple the radiative transfer through a dusty ISM and the spectral evolution of stellar populations (Silva et al. 1998; Dopita et al. 2005). This type of model is useful in interpreting in detail the emission from individual galaxies in terms of constraints on stellar populations and the spatial distribution and physical properties of the dust. However, because of the complexity of radiative transfer computations, these models are not optimised to derive statistical constraints from observations of large samples of galaxies.
A model optimised to constrain the physical properties of large samples of galax-ies is a necessity in the era when deeper and wider surveys are gathering multi-wavelength observations of large numbers of galaxies at different redshifts. Ex-ample of such surveys are the Great Observatories Origins Deep Survey (GOODS; Dickinson & GOODS Legacy Team 2001), the Cosmic Evolution Survey (COSMOS; Scoville et al. 2007) and the The All-Wavelength Extended Groth Strip International Survey (AEGIS; Davis et al. 2007), and planned surveys including far-infrared ob-servations with the future Herschel Space Telescope (e.g Latter, NHSC & HSC Teams 2007), such as the ATLAS wide-field survey (P.I. Stephen Eales) or the The Herschel Multi-tiered Extragalactic Survey (HerMES; P.I. Seb Oliver). To take full advantage of the richness of these data sets, we need to be able to make the link between the observations and the physical parameters of the galaxies. More specifi-cally, we need a model to interpret consistently the multi-wavelength emission from galaxies in terms of physical parameters, such as star formation rate, stellar mass and dust content. This will enable us to exploit the new observational surveys to set the best constraints on galaxy formation and evolution scenarios.
Our primary goal in this thesis is to build such a model. We present a sim-ple and versatile prescription to interpret the mid- and far-infrared spectral energy distributions of galaxies consistently with the emission at ultraviolet, optical and near-infrared wavelengths. This model is easily applicable to large samples of ob-served galaxies and allows us to derive statistical estimates of physical parameters such a star formation rate, stellar mass, dust content and dust properties from combined ultraviolet, optical and infrared galaxy spectra. We exemplify this by deriving median-likelihood estimations of the physical parameters of local samples. We find important correlations between galaxy properties which can provide insight into the relation between the star formation and dust content of galaxies.
1.3. The production of starlight in galaxies 7
galaxies and its transfer in the interstellar medium. We provide the basic elements to interpret the spectra energy distributions of galaxies, from which we build the model presented in the next chapter.
1.3
The production of starlight in galaxies
In this section, we review the stellar emission of galaxies. This emission dominates the galactic spectral energy distributions at ultraviolet, optical and near-infrared wavelengths. The total stellar spectrum of a galaxy is a result of the contribution by all the individual stars it comprises. Therefore, to interpret observed galactic spectra, we need to understand the stellar population of a galaxy (composed of stars of different masses, chemical compositions and ages) and follow the evolution of the different stars with time.
1.3.1 Stellar populations in galaxies
The first classification of stellar populations in galaxies was made in the 1940’s by Walter Baade when analysing photographs of unprecedented quality of Andromeda and other nearby galaxies. These observations allowed, for the first time, to resolve individual stars of external galaxies (Baade 1944). Baade distinguished two types of stars:
• Population I stars, which have solar-like metallicities and are distributed in the discs of galaxies, with low velocity dispersions; the brightest stars of this population are blue, young, hot and massive;
• Population II stars, which tend to be red, old and cool, have low metallicities and are distributed in the bulges and halos of galaxies, with high velocity dispersions.
Baade also noticed that Population I stars tend to populate the same region of the Hertzprung-Russel (H-R) diagram2 as open clusters, whereas Population II stars occupy the same region as globular clusters in this diagram. Moreover, he remarked that early-type galaxies (ellipticals and lenticulars) are dominated by Population II stars, while in late-type galaxies (spiral and irregulars), the two populations of stars are found.
Since the pioneer work of Baade, the improvement in observational techniques has revealed that, in reality, stellar populations in galaxies are not optimally clas-sified using discrete classes. Instead, stars in a galaxy present a continuous distri-bution of properties, which result from the history of star formation and chemical enrichment of the galaxy. Therefore, we can use the emission from the stellar populations to trace star formation history and the chemical evolution of galaxies.
2
The Hertzprung-Russal diagram shows the relation between the bolometric luminosity and the effective temperature of stars.
We can perform studies of this type to interpret the emission from stellar popula-tions of galaxy samples at different redshifts. The results of such studies provide constraints on galaxy formation and evolution scenarios. However, when studying distant galaxies, the individual stars cannot be resolved. Therefore, we need tools that allow us to extract the stellar population properties of distant galaxies from the integrated light we observe. In the next section, we describe such models in more detail.
1.3.2 Stellar population synthesis models
The first attempts to interpret integrated galaxy spectra in terms of the stellar content of galaxies reproduced the observed spectra using linear combinations of individual stellar spectra of various types (e.g. Spinrad & Taylor 1971; Faber 1972; O’Connell 1976; Turnrose 1976). This approach was soon abandoned because the number of free parameters was too large to be constrained by typical observed galaxy spectra. More recent, widely-used models are based on the evolutionary population synthesis technique (e.g. Tinsley 1978; Bruzual 1983; Arimoto & Yoshii 1987; Guiderdoni & Rocca-Volmerange 1987; Buzzoni 1989; Bruzual & Charlot 1993; Bressan, Chiosi & Fagotto 1994; Worthey 1994; Leitherer & Heckman 1995; Fioc & Rocca-Volmerange 1997; Maraston 1998; Vazdekis 1999; Bruzual & Charlot 2003). The main adjustable parameters in these ‘stellar population synthesis mod-els’ are the initial mass function (IMF), the star formation rate (ψ) and, in some cases, the chemical enrichment rate.
Throughout this thesis, we use the evolutionary synthesis models by Bruzual & Charlot (Charlot & Bruzual 1991; Bruzual & Charlot 1993, 2003, Charlot & Bruzual, in preparation) to compute the spectral evolution of stellar populations in galaxies. These models are based on the isochrone synthesis technique, which builds on the property that stellar populations with any star formation history can be expanded in series of instantaneous bursts, named ‘simple stellar populations’ (SSPs). In this approach, the spectral energy distribution at time t of a stellar population characterized by a star formation rate ψ(t) and a metal-enrichment law ζ(t) can be written as Lλ(t) = Z t 0 dt′ ψ(t − t′ ) Sλ[t′, ζ(t − t′)] , (1.3)
where Sλ[t′, ζ(t − t′)] is the power radiated per unit wavelength per unit initial stellar mass by a SSP of age t′
and metallicity ζ(t − t′
), assuming that the initial mass function (IMF) remains constant with time.
The emission from the simple stellar population Sλ[t′, ζ(t − t′)] is computed as the sum of the spectra of the stars defining its isochrone (which defines the position of stars of different masses in the H-R diagram at a time t′
), at metallicity ζ(t − t′ ) and at age t′
1.3. The production of starlight in galaxies 9
1.3.2.1 Stellar evolution
It is worth giving a very brief summary of the main features of stellar evolution to appreciate the spectral analysis technique presented later in this thesis. The shape of the spectrum of a SSP, Sλ[t′, ζ(t−t′)], depends mainly on the total luminosity and effective temperature of the stars which compose the SSP at a given age. The higher the bolometric luminosity of a star, the more the emission of the star contributes to the total spectrum. Moreover, the effective temperature of a star determines the wavelength at which the star radiates most of the energy. Therefore, it is crucial to understand the evolution of stars in the H-R diagram to interpret the total emission from galaxies.
The evolution of a star depends mainly on its initial mass: this determines the rate at which the star has to produce energy in order to balance the gravitational force and remain in hydrostatic equilibrium. The higher the initial mass of star, the higher the energy production rate it requires to remain in equilibrium. Therefore, higher-mass stars have higher luminosities. These stars run out of fuel for the production of energy quicker than lower-mass stars. As a consequence, the lifetimes of high-mass stars are shorter than those of lower-mass stars. In Fig. 1.4, we show three examples of evolutionary tracks in the H-R diagram of stars with different initial masses: a low-mass star (1 M⊙), an intermediate-mass star (5 M⊙) and a high-mass star (25 M⊙), from Iben (1991). We now summarize the main stages of the evolution of stars of different initial masses after the zero-age main sequence.3 Very low-mass stars (. 0.25 M⊙). Stars with masses between 0.08 and 0.25 M⊙ have a very slow evolution; they can reach lifetimes of more than 13 Gyr. These stars have convective interiors. Therefore, the core is continuously being recycled with hydrogen coming from the outer layers, and they can convert all the initial hydrogen in helium. When H is exhausted in the stars, they start contracting. Because of the low stellar mass, the gravitational energy released during the contraction is not enough to make the central temperature reach sufficiently high values to start He-burning reactions. With no other source of energy available, these stars cool down and become white dwarves.
Low-mass stars (. 2 M⊙). A star with initial mass around 1 M⊙ spends about 10 Gyr on the main sequence, radiating most of the energy at optical wavelengths. During this time, the temperature in the core increases gradually and the stars expands slightly.
When H in the nucleus runs out, the star starts burning H in a shell around the He core. The core contracts, heating up the surrounding H-burning layer. This causes an increase in the production of energy which heats up the outer envelope of the star and makes it expand. Consequently, the radius of the star increases, and
3
The main sequence is, by definition, the period during which a star produces energy by burning hydrogen in the core. The zero-age main sequence marks the beginning of the main sequence phase: it is the time when H-burning reactions start in the core.
Figure 1.4: Evolutionary tracks in the Hertzprung-Russel diagram for three model stars with low (1 M⊙), intermediate (5 M⊙) and high (25 M⊙) initial masses. The effective temperature Te is given in K, and the bolometric luminosity, L, is in solar luminosity units. The tracks stars at the zero-age main sequence and end at remnant stage. The heavy portions of each curve define locations where major nuclear burning phases occur. Figure taken from Iben (1991).
the effective temperature decreases, shifting the peak of the stellar emission towards longer wavelengths. The temperature drop increases the opacity, and convection starts to provide an effective transport of energy from the stellar interior (first dredge-up). At this point, the star cannot expand any further, and therefore the luminosity starts increasing – the star moves up the ‘red giant branch’ (RGB). RGB stars have high luminosities and they radiate mainly at near-infrared wavelengths due to their cool temperatures. We will see in Section 1.3.2.3 that these stars dominate the spectral energy distributions of SSPs at old ages.
During the red giant phase, the He core keeps contracting and increasing in mass due to infall of He being produced in the circumnuclear shell. The core is
1.3. The production of starlight in galaxies 11
so dense that the electrons become a degenerate gas; the pressure of degenerate gas depends only on the density (not the temperature) and counterbalances the gravitational force. As the core contracts, the temperature rises, reaching eventually the minimum temperature to start burning He (i.e. about 108 K). Once He starts burning in a part of the core, the resulting heat propagates quickly by conduction through the whole core. The increase in temperature does not make the core expand, since the core is made of degenerate gas; instead, the rate of He-burning reactions increases, producing an ‘helium flash’. These quick reactions increase the core temperature until the gas becomes non-degenerate, allowing for the core to expand and cool down. After the helium flash, the outer layers of the star contract, causing the radius and luminosity to decrease, and the effective temperature to increase gradually. The star moves downward and to the left in the H-R diagram (Fig. 1.4). At this stage, the star burns He steadily in the core and H in a shell surrounding the core.
When He is exhausted in the core, the fusion continues in a shell around a core of carbon and oxygen which has contracted and increased in density until the gas has become degenerate. The star moves up the ‘asymptotic giant branch’ (AGB) in the H-R diagram, which is parallel to the RGB, but with even faster energy generation (therefore this phase lasts for a shorter time). Although the AGB phase is relatively short, it is crucial to understand this stage of stellar evolution in order to interpret the spectral energy distributions of star-forming galaxies, since AGB stars contribute significantly to the near-infrared emission of galaxies.
The ‘thermally-pulsating AGB’ (TP-AGB) phase begins when the He shell around the core runs out of fuel. When that happens, the main energy source of the star becomes the H-burning shell around it. The He-burning reactions are very sensitive to changes in temperature, and therefore the He shell switches on periodically in violent pulses in which huge amounts of energy are generated, alter-nated with more quiet phases of energy production in the H-burning shell. During this phase, the star pulsates and the luminosity varies. In each pulse, huge amounts of energy are produced and transported outward through convection. Strong stellar winds triggered by the pulsations expel gas rich in heavy elements from the star, causing an enrichment of the ISM. The gas in the outer layers of the star forms an expanding shell which cools down as it moves away from the star, allowing for dust particles and molecules to form. The strong stellar winds eventually provide enough kinetic energy for the outer layers to be ejected, forming a planetary nebula. At the center of this nebula remains the core of the star which, for a star of 1 M⊙ initial mass, never reaches high enough temperature to start burning carbon, and cools down to become a white dwarf. The nebula keeps expanding until it dissipates in the interstellar medium.
Intermediate-mass stars (∼ 2 − 7 M⊙). A star with initial mass around 5 M⊙needs to produce more energy than a solar-mass star while on the main sequence to remain in hydrostatic equilibrium. Therefore, it burns H in the center at a faster rate and
the effective temperature and luminosity are higher. The H in the core is rapidly exhausted, and the star leaves the main sequence at a much younger age than a solar-mass star.
When the star leaves the main sequence, the core contracts and H-burning reac-tions start in a shell around the He core, which supports the weight of the material above it for some time. When this equilibrium ends, the core contracts more rapidly and its temperature increases, causing the energy production in the H-burning shell to increase and the outer layers of the star to expand. The surface temperature decreases, and the star moves to the right in the H-R diagram (Fig. 1.4). Then, convection starts being effective in transporting energy from the deepest layers (first dredge-up), and the luminosity of the star increases, making the star ascend the RGB. During this phase, the central temperature of the star continues to rise due to the core contraction, until the ignition of He-burning reactions in the non-degenerate core.
When He is exhausted in the center, the carbon core contracts, and He keeps burning in a shell around the core (which is also surrounded by the H-burning shell). The core contracts and heats, the outer layers expand and the effective temperature decreases, until the star reaches the AGB stage. We will see in Section 1.3.2.3 that these luminous AGB stars dominate the near-infrared light of a SSP at intermediate ages (i.e. around 100 Myr). As in the case of solar-mass stars, thermal pulses cause strong stellar winds and the star loses a large part of its mass. During this time, the carbon core keeps contracting and heating until the gas becomes degenerate. If the temperature reaches high enough values to ignite carbon, the star will undergo a ‘carbon flash’, leading to a supernova explosion. If the temperature of the degenerate core is too low, the star loses its outer layers as a planetary nebula and the core cools down as a white dwarf. The initial mass and chemical composition of the star, and the total mass lost during its evolution, determine which of the two scenarios occurs. In either case, the star returns material to the interstellar medium at the end of its life.
High-mass stars (& 7 M⊙). The evolution of the most massive stars is extremely rapid. These very hot stars radiate huge amounts of energy during their short lifetimes of typically a few Myr. The ultraviolet radiation originating from these stars has important effects on the spectra of galaxies. The radiation from massive stars dominates the emission of a SSP at young ages (Section 1.3.2.3) and ionizes the gas in the surrounding ISM (Section 1.4). High-mass stars lose a large part of their initial mass due to strong stellar winds during the main sequence evolution. Such important mass losses make the evolution of these stars very complex to model.
In a star of initial mass around 25 M⊙, after central H is consumed, the core starts contracting and the outer envelope expands – the star becomes a ‘red super-giant’. The central temperature rapidly reaches high enough values to start burning He in a non-degenerate core surrounded by a H-burning shell. At this stage, the effective temperature of the star increases and the star becomes a ‘blue supergiant’.
1.3. The production of starlight in galaxies 13
After all the central He has been converted into C, the core contracts again until it reaches high enough central temperatures to start burning carbon: the star becomes a red supergiant again. Because of its high mass, the star can reach high enough temperatures for the C-burning reactions to begin before the core becomes degenerate. When the central C gets exhausted, the core contracts again and the next reactions, burning O, Mg and Ne all the way to Fe, occur very quickly until the star consists of a compact core of iron with surrounding shells burning successively lighter elements. The nucleus of the Fe atom has a much higher binding energy than lighter elements, and the star cannot produce energy through its fusion (in fact, the Fe fusion reactions require an input of energy). Therefore, the star is incapable of continuing to produce energy in the core, and the core collapses gravitationally to extremely high density and explodes violently as a supernova. The outer layers of the star are returned to the interstellar medium, and the core remains as a neutron star.
1.3.2.2 The stellar initial mass function
As we have seen in the previous section, the initial mass of a star determines the way it produces and radiates energy. This has a crucial impact on the study of the integrated emission from galaxies. Stars of different initial masses dominate the energy output at different wavelengths and at different ages. When adding up the spectra of all stars of a SSP, it is important to get the right proportions of stars of different masses. Therefore, the initial mass function is a fundamental ingredient in stellar population synthesis models.
The initial mass function has been investigated by many since the Salpeter’s (Salpeter 1955) pioneering study (e.g. Scalo 1986; Kroupa 2001; Chabrier 2003). Such studies aim at determining the proportions of stars of different masses in nearby environments, such as stellar clusters and the solar neighbourhood, to get the present-day mass function of stars, and then correcting for the number of stars that have already evolved out of the main sequence for a given formation time. However, the accurate determination of the IMF is complex due to factors such as the evolution of stars, the mixing of different stellar populations (with different ages) and the conversion from observed stellar luminosities to stellar masses.
In all applications in this thesis, we assume the Chabrier (2003) single-star IMF of the Galactic disc, described by:
φ[log(m)] ∝
exph−(log m−log mc)2
2σ2 i , for m ≤ 1 M⊙, m−1.3 , for m > 1 M⊙, (1.4)
with mc= 0.08 M⊙ and adopt lower and upper mass cut-offs 0.1 M⊙ and 100 M⊙, respectively. This IMF is physically motivated and fits well the counts of low-mass stars and brown dwarfs in the Galactic disc, providing more accurate mass-to-light ratio determinations (Chabrier 2003).
Figure 1.5: Comparison between the Salpeter 1955 (in red) and Chabrier 2003 (in purple) initial mass functions. (a) Comparison between the two IMFs (both are normalised to φ[log(m = 1 M⊙)] = 0; (b) Comparison between the mass-to-light ratios (i.e. total stellar mass divided by the total V-band luminosity) given by the two IMFs.
Salpeter (1955) IMF, which is described by φ[log(m)] ∝ m−1.35. In panel (a), it is clear that the Salpeter IMF produces a higher number of low-mass stars than the Chabrier IMF. This causes the systematically higher mass-to-light ratio for the Salpeter IMF, plotted in panel (b), since the bulk of stellar mass in galaxies is contributed by low-mass stars. In fact, the Salpter IMF produces stellar masses of model galaxies which are about 1.6 times higher than the Chabrier IMF.
1.3.2.3 Spectral evolution of a simple stellar population
We now describe the spectral evolution of a simple stellar population. This corre-sponds to computing the term Sλ[t′, ζ(t − t′)] in equation (2.1). The basics ingredi-ents necessary to compute the spectral evolution of a SSP are:
• evolutionary tracks of stars of different initial masses and chemical composi-tions in the H-R diagram, provided by stellar evolution theory – these tracks allow us to compute isochrones, which define the positions of stars of different masses and metallicities in the H-R diagram at a given time;
• the initial mass function, which determines the proportions of stars of different masses in the SSP;
• libraries of stellar spectra, used to assign an ultraviolet-to-infrared spectrum to stars along the isochrone.
1.3. The production of starlight in galaxies 15
Figure 1.6: Example of isochrones with solar metallicity computed using the latest version of the ‘Padova 1994’ stellar evolution prescription (Marigo et al. 2008). The isochrones show the location on the H-R diagram of the stars of a SSP at a given age. Here we plot 12 ages from 4 × 10⁶ (green) to 8 × 10⁹ yr (red). At the youngest age, most of the stars are in the main sequence, except the very massive ones; as the age of the SSP increases (towards red isochrones), less massive stars evolve out of the main sequence. The effective temperature of a star determines at which wavelengths it radiates most of its emission. The higher the bolometric luminosity of a star, the more it contributes to the integrated stellar spectral energy distribution of the galaxy.
To model the stellar emission from galaxies, we must include the evolution of the full range of possible initial stellar masses. In stellar population synthesis models, a detailed stellar evolution prescription defines how stars of different masses and chemical compositions evolve. In practice, this is done by providing stellar evolutionary tracks which describe the evolution of stars of different masses in the H-R diagram.