Publisher’s version / Version de l'éditeur:
RADIATIVE TRANSFER - VI. Proceedings of the 6th International Symposium on Radiative Transfer, 2010, 2010
READ THESE TERMS AND CONDITIONS CAREFULLY BEFORE USING THIS WEBSITE.
https://nrc-publications.canada.ca/eng/copyright
Vous avez des questions? Nous pouvons vous aider. Pour communiquer directement avec un auteur, consultez la
première page de la revue dans laquelle son article a été publié afin de trouver ses coordonnées. Si vous n’arrivez pas à les repérer, communiquez avec nous à PublicationsArchive-ArchivesPublications@nrc-cnrc.gc.ca.
Questions? Contact the NRC Publications Archive team at
PublicationsArchive-ArchivesPublications@nrc-cnrc.gc.ca. If you wish to email the authors directly, please see the first page of the publication for their contact information.
NRC Publications Archive
Archives des publications du CNRC
This publication could be one of several versions: author’s original, accepted manuscript or the publisher’s version. / La version de cette publication peut être l’une des suivantes : la version prépublication de l’auteur, la version acceptée du manuscrit ou la version de l’éditeur.
For the publisher’s version, please access the DOI link below./ Pour consulter la version de l’éditeur, utilisez le lien DOI ci-dessous.
https://doi.org/10.1615/ICHMT.2010.RAD-6
Access and use of this website and the material on it are subject to the Terms and Conditions set forth at
The importance of thermal radiation transfer in laminar diffusion flames at normal and microgravity
Liu, Fengshan; Smallwood, Gregory J.; Kong, Wenjun
https://publications-cnrc.canada.ca/fra/droits
L’accès à ce site Web et l’utilisation de son contenu sont assujettis aux conditions présentées dans le site LISEZ CES CONDITIONS ATTENTIVEMENT AVANT D’UTILISER CE SITE WEB.
NRC Publications Record / Notice d'Archives des publications de CNRC:
https://nrc-publications.canada.ca/eng/view/object/?id=f26beaa6-6c5f-465c-bbe9-4a99f9205fd4 https://publications-cnrc.canada.ca/fra/voir/objet/?id=f26beaa6-6c5f-465c-bbe9-4a99f9205fd4
THE IMPORTANCE OF THERMAL RADIATION TRANSFER IN LAMINAR DIFFUSION FLAMES AT NORMAL AND MICROGRAVITY
Fengshan Liu*, Gregory J. Smallwood*, and Wenjun Kong**
*National Research Council
1200 Montreal Road, Ottawa, Ontario, Canada K1A 0R6
**Chinese Academy of Sciences
P.O. Box 2706, Beijing 100190, China
ABSTRACT. The importance of radiation heat loss in laminar and turbulent diffusion flames at normal gravity has been relatively well recognized. There is currently lack of quantitative understanding on the importance of radiation heat loss in relatively small scale laminar diffusion flames at microgravity. The effects of radiation heat transfer and radiation absorption on the structure and soot formation characteristics of a coflow laminar ethylene/air diffusion flame at normal- and micro-gravity were numerically investigated. Numerical calculations were conducted using relatively detailed combustion chemistry and complex thermal and transport properties, an acetylene based soot formation model, and a statistical narrow-band correlated-k non-grey gas radiation model. Radiation heat transfer and radiation absorption in the microgravity flame were found to be much more important than its counterpart at the normal gravity.
INTRODUCTION
Thermal radiation is often the dominant heat transfer mode in many systems involving large scale and high temperature, such as furnaces and combustors, and fire spread. The importance of radiation transfer in combustion and flame processes has drawn increased attention over the last few decades. Even in relatively small sized laminar discussion flames radiation heat transfer can still be important to influence various flame processes, such as extinction at low stretch [1] and soot formation [2,3]. This is because radiation heat transfer affects the flame temperature, which in turn alters various kinetically controlled phenomena due to the strong temperature dependence of such processes. The strong coupling between radiation and soot kinetics in sooting flames at earth gravity was first recognized by Kaplan et al. [4] and Sivathanu and Gore [5] in their numerical studies using crude combustion chemistry based on either the one-step reaction model or the state relationship. The importance of radiation heat transfer in laminar diffusion flames at earth gravity was later numerically investigated in several studies by Liu et al. [2,3,6] using detailed combustion chemistry, a semi-empirical (acetylene based) soot model, and the statistical narrow-band correlated-k (SNBCK) gas radiation model. These studies revealed that even in such fairly small flames thermal radiation loss can still be important and should be accounted for in numerical modeling of laminar flames, especially for the 64 mm tall laminar coflow ethylene/air diffusion flame [2] and the oxygen enriched ethylene counterflow diffusion flame [3], where the soot loading is relatively high. On the other hand, however, radiation absorption can be important or relatively unimportant, depending on flame configuration (counterflow or coflow), flame
size, and soot loading. The strong coupling between flame temperature, soot formation, and NOx
emission and thermal radiation due to gas and soot in propane-fuelled oxygen-enriched turbulent jet diffusion flames was more recently investigated by Wang [7] using advanced soot formation and non-grey gas radiation models. Their study once again found that accurate modeling of thermal radiation
due to both non-grey gas and soot is very important for accurate predictions of soot and NOx formation.
It is worth pointing out that it is essential to employ an accurate non-grey gas radiation model in an overall flame model for the validation of either a combustion chemistry mechanism or a soot formation
model against experimental data, since inaccurate calculations of radiation loss from the flame could lead to false conclusions.
Microgravity combustion has received renewed interests since the late 1980’s due to the availability of improved microgravity facilities (drop tower and manned space activities) and the needs to understand fire spread in microgravity for fire safety in spacecrafts and to advance our fundamental understanding of combustion science in general. The intrusion of buoyancy force is a greater impediment to combustion science due to the existence of large temperature and density differences. The existence of buoyancy on earth can prevent the observation of many important flame phenomena. For example, the existence of stable spherical premixed flames [8] and the extinction of counterflow low-stretched diffusion flame [1] were both observed in microgravity environment. In microgravity diffusion flames the residence time of a fluid parcel is much longer than that in their normal gravity counterparts due to the absence of buoyancy induced flow acceleration. In addition, microgravity coflow diffusion flames are in general larger due to the enhanced role of diffusion in both the radial and streamwise directions and sootier as a result of prolonged residence time available for soot surface growth. Consequently, radiation heat transfer becomes significantly more important in microgravity than in normal earth gravity. Although the enhanced importance of radiation heat loss in microgravity has been recognized [9], adequate quantitative understanding of the effects of thermal radiation transfer on laminar coflow diffusion flames is still lacking. A very recent numerical study by Kong and Liu [10] demonstrated that radiation transfer in microgravity laminar coflow methane/air diffusion flame can be so important that the flame temperature is lowered by more than 800 K due to radiation heat loss and the flame experiences partial extinction in the centerline region under certain conditions of their study. It is noticed that the flame investigated by Kong and Liu is relatively large, being about 9 cm tall at microgravity. The importance of radiation absorption in microgravity flames, however, was not investigated in the study of Kong and Liu [10].
This study attempts to gain further understanding of the importance of thermal radiation transfer and radiation absorption, in a laminar coflow ethylene/air diffusion flame at both normal- and micro-gravity. The objectives of the present work are to gain quantitative understanding of the effects of radiation heat loss and radiation absorption in flame temperature and soot loading through numerical modelling. Numerical calculations of the coflow laminar ethylene/air diffusion flame were conducted using relatively detailed gas-phase reaction mechanism, the SNBCK non-grey gas radiation model, and the acetylene based simplified soot formation model employed in previous studies [2,6,10].
NUMERICAL METHOD
The elliptic governing equations of mass, momentum, energy and species in the low Mach number limit and in axisymmetric cylindrical coordinates (r, z) described in [11,12] are solved. The gravitational term is included in the momentum equation along z (vertically upwards) direction. The effects of buoyancy on the flame structure and soot formation characteristics under different gravity levels can be easily modelled by varying the value of the gravitational acceleration, which is 980
cm/s2 at 1g and 0 cm/s2 at microgravity or 0g. The method of correction diffusion velocity
described in [13] was employed to ensure that the net diffusion flux of all species sums to zero in both r and z directions. Note that the correction velocity accounts for the thermophoretic velocity of soot. The interaction between the soot chemistry and the gas-phase chemistry was accounted for
through the reaction rates of the species related to soot formation and oxidation, namely C2H2, CO,
H2, O2, O, H, and OH in the present context. Only the thermal diffusion velocities of H2 and H were
taken into account using the expression given in [13]. The source term in the energy equation due to radiation heat transfer was included and calculated using the method described below.
A modified version of the semi-empirical two-equation formulation of soot kinetics proposed by Leung et al. [14] was used to model soot nucleation, surface growth and oxidation. In this
simplified soot nucleation and growth model, it is assumed that acetylene is the only soot nucleation
and growth species and soot nucleation and surface growth proceed respectively via C2H2 → 2C(S)
+ H2 and C2H2 + nC(S) → (n+2)C(S) + H2. The rates of nucleation and surface growth are written
as R1=k T C H1( )[ 2 2] (kmol/m3/s) and R2=k T A2( ) s0.5[C H2 2] (kmol/m3/s), where As=π(6/π)2/3ρC(S)−2/3
Ys2/3 ρN1/3 is the soot surface area per unit volume and [C2H2] is the mole concentration of
acetylene. The nucleation and growth rate constants used in the present calculations were taken
from a previous study [2]: k1 = 1000exp(−16103/T) [1/s] and k2 = 1750exp(−10064/T) [m0.5/s]. The
density of soot ρC(S) is assumed to be 1.9 g/cm3. It is noted that the soot surface growth rate is
assumed to be proportional to the square root of the soot surface area based on the recommendation
of Leung et al. [14]. Soot oxidation was assumed to proceed through the following reactions: O2 +
0.5C(S) → CO, OH + C(S) → CO + H, and O + C(S) → CO. Further details of the governing
equations and soot model can be found in [2].
The radiation source term in the energy equation was calculated using the discrete-ordinates method
(DOM) in axisymmetric cylindrical geometry. The corresponding T3 quadrature given in [6] was
used for the angular discretisation. Spatial discretisation of the radiative transfer equation was achieved using the finite volume method along with the central difference scheme. The efficient implementation approach of the statistical narrow-band correlated-k (SNBCK) based wide band model described by Liu and Smallwood [15] was employed to obtain the absorption coefficients of
the combustion products containing CO, CO2, H2O, and soot at each wide band. In this model, the
radiative properties of CO, CO2, and H2O are evaluated using the SNB parameters of Soufiani and
Taine [16], while the spectral absorption coefficient of soot was obtained by Rayleigh’s theory for
small particles and assumed to be 5.5 fν λwith fv being the soot volume fraction and λ the
wavelength at the band centre.
The density of the mixture (including soot) was calculated using the ideal gas state equation. Gas-phase combustion chemistry was modeled using the GRI-Mech 3.0 mechanism [17], which was
optimized for methane combustion, with the removal of species and reactions related to NOx
formation (except N2). This simplified GRI-Mech 3.0 mechanism contains 36 species and 219
reactions. Thermal and transport properties of species and the mixture were obtained from CHEMKIN subroutines and the GRI-Mech 3.0 database. To allocate the flame front where the mixture fraction is stoichiometric, the mixture fraction field was calculated using the definition of Bilger et al. [18].
The fully coupled transport equations were discretized by the standard finite volume method. The SIMPLE algorithm for pressure-velocity coupling was employed. The discretized equations of momentum, pressure correction, temperature, soot mass fraction, and soot number density were solved using the tri-diagonal matrix algorithm. Transport equations of gas-phase species were solved simultaneously using a direct solver at each control volume to ensure convergence.
This simplified soot model, when used in conjunction with the GRI-Mech 3.0 mechanism [17], has
been shown to perform quite well in the prediction of laminar coflow C2H4/air [2] and CH4/air [6]
diffusion flames at normal gravity in terms of the visible flame height and the peak soot volume fraction against available experimental data. In addition, the effect of gravity on soot formation is a physical phenomenon, rather than a chemical one. For these reasons, it is adequate to use this simplified soot formation model for the purposes of the present study.
RESULTS AND DISCUSSION
The laminar ethylene/air flame investigated in this study is generated using an axisymmetric coflow diffusion flame burner in which the fuel stream is delivered through the central fuel pipe of 10.9
mm internal diameter (0.9 mm thickness) while the coflowing air stream is delivered through the co-annular region between the fuel pipe and an outer pipe of 26 cm inner diameter. The fuel tube size considered in this study is identical to that of the Gülder burner [19] and very similar to that of the popular Santoro burner [20] (11.1 mm i.d.). Uniform inlet temperatures of 300 K are assumed for both the fuel and air streams. The temperature at the burner rim is also kept at 300 K. The
velocity distribution at the exit of the fuel pipe is assumed uniform at the mean velocity vF . The
mean fuel stream velocity is fixed at νF = 3.26 cm/s throughout this study. The inlet velocity at the
air stream remains uniform at the specified velocity outside the boundary layer of the outer surface of the fuel pipe. A boundary layer type velocity distribution close to the outer surface of the fuel pipe is assumed. The air stream velocity outside the boundary layer of the outer surface of the fuel
pipe was kept at vA = 5 cm/s in all the calculations.
Non-uniform grids were used in both r and z directions to provide greater resolution in the large gradient regions without an excessive increase in the computing time. Fine grids were placed in the
r direction between 0 and 1 cm with a grid resolution of about 0.16 mm. In the streamwise
direction, fine grids were used in the burner exit region and the grid gradually became coarser as the distance from the burner exit increased. The dimensions of the solution domain were 9.78 cm in the streamwise direction and 13 cm in the radial direction. In total, the computational domain was divided into 251 (z) × 135 (r) control volumes. Inlet conditions were specified for the fuel and air streams at the z = 0 boundary. Symmetry conditions were used at the centerline, i.e., r = 0. Free slip conditions were assumed for the velocity at the outer r = 13 cm boundary. Zero-gradient conditions were enforced at the top exit boundary. In the calculation of radiation heat transfer, all the boundaries were assumed to be cold at 300 K and black.
Comparison of the flame structure and soot field at 1g and 0g To appreciate the enhanced role
of radiation heat transfer in laminar diffusion flames at microgravity, it is useful to first compare the flame structure and soot distribution of the ethylene/air diffusion flame at 1g and 0g. To highlight the variation in the flame structure when the gravity level is changed from 1g to 0g, several representative quantities are displayed in Figs. 1 and 2 for comparison. In both cases, the flame
location, characterized by the stoichiometric mixture fraction of fst = 0.0634, is indicated by the
black line on Figs. 1(b) and 2(b). Several observations can be made between the flame at 1g and 0g. First, the axial velocities at 0g, Fig. 2(a), are much lower than those at 1g, Fig. 1(a), due to the absence of buoyancy induced acceleration. The largest velocities at 0g occur low in the flame, as a result of flow acceleration due to heat release. The much lower axial velocities at 0g results in much longer residence times available for diffusion, thermal radiation, and soot surface growth and oxidation. Secondly, the flame becomes taller and much wider at 0g, which is attributed to the enhanced role of diffusion and prolonged residence times. Thirdly, the flame tip is closed at 1g, but open at 0g. This is indicated by the OH mass fraction distributions shown in Figs. 1(c) and 2(c). Consequently, the flame at 1g does not emit soot, i.e., soot is completely oxidized, but emits soot at 0g. This point will be further discussed later. As a result of the emission of soot from the flame at
0g, the mass fractions of CO2 at the centerline region in the upper portion of the flame are much
lower than those at 1g. The mass fractions of H2O remain more or less unchanged when the gravity
0 1 2 r, cm 0 1 2 3 4 5 6 7 8 z, cm U 200 192 184 176 168 160 152 144 136 128 120 112 104 96 88 80 72 64 56 48 40 32 24 16 8 0 (a) u-velo, cm/s Peak: 224 cm/s 0 1 2 r, cm 0 1 2 3 4 5 6 7 8 z, c m Temper 1950 1884 1818 1752 1686 1620 1554 1488 1422 1356 1290 1224 1158 1092 1026 960 894 828 762 696 630 564 498 432 366 300 (b) Temperature Peak: 1978.6 K 0 1 2 r, cm 0 1 2 3 4 5 6 7 8 z, cm CO2 0.225 0.216 0.207 0.198 0.189 0.18 0.171 0.162 0.153 0.144 0.135 0.126 0.117 0.108 0.099 0.09 0.081 0.072 0.063 0.054 0.045 0.036 0.027 0.018 0.009 0 (d) CO2 Peak: 0.226 0 1 2 r, cm 0 1 2 3 4 5 6 7 8 z, cm OH 2.00 1.92 1.84 1.76 1.68 1.60 1.52 1.44 1.36 1.28 1.20 1.12 1.04 0.96 0.88 0.80 0.72 0.64 0.56 0.48 0.40 0.32 0.24 0.16 0.08 0.00 (c) OH x 1.0E3 Peak: 2.756E-3 0 1 2 r, cm 0 1 2 3 4 5 6 7 8 z, cm H2O 0.085 0.0816 0.0782 0.0748 0.0714 0.068 0.0646 0.0612 0.0578 0.0544 0.051 0.0476 0.0442 0.0408 0.0374 0.034 0.0306 0.0272 0.0238 0.0204 0.017 0.0136 0.0102 0.0068 0.0034 0 (e) H2O Peak: 0.086
Fig. 1 Distributions of axial velocity, temperature, OH mass fraction, CO2 mass fraction, and H2O
mass fraction at 1g with full radiative transfer.
0 1 2 r, cm 0 1 2 3 4 5 6 7 8 z, cm U 20 19.2 18.4 17.6 16.8 16 15.2 14.4 13.6 12.8 12 11.2 10.4 9.6 8.8 8 7.2 6.4 5.6 4.8 4 3.2 2.4 1.6 0.8 0 (a) u-velo, cm/s Peak: 20.94 cm/s 0 1 2 r, cm 0 1 2 3 4 5 6 7 8 z, cm Temper 1800 1740 1680 1620 1560 1500 1440 1380 1320 1260 1200 1140 1080 1020 960 900 840 780 720 660 600 540 480 420 360 300 (b) Temperature Peak: 1863.7 K 0 1 2 r, cm 0 1 2 3 4 5 6 7 8 z, c m OH 2.00 1.92 1.84 1.76 1.68 1.60 1.52 1.44 1.36 1.28 1.20 1.12 1.04 0.96 0.88 0.80 0.72 0.64 0.56 0.48 0.40 0.32 0.24 0.16 0.08 0.00 (c) OH x 1.0E3 Peak: 1.952E-3 0 1 2 r, cm 0 1 2 3 4 5 6 7 8 z, cm CO2 0.225 0.216 0.207 0.198 0.189 0.18 0.171 0.162 0.153 0.144 0.135 0.126 0.117 0.108 0.099 0.09 0.081 0.072 0.063 0.054 0.045 0.036 0.027 0.018 0.009 0 (d) CO2 Peak: 0.194 0 1 2 r, cm 0 1 2 3 4 5 6 7 8 z, cm H2O 0.085 0.0816 0.0782 0.0748 0.0714 0.068 0.0646 0.0612 0.0578 0.0544 0.051 0.0476 0.0442 0.0408 0.0374 0.034 0.0306 0.0272 0.0238 0.0204 0.017 0.0136 0.0102 0.0068 0.0034 0 (e) H2O Peak: 0.086
Fig. 2 Distributions of axial velocity, temperature, OH mass fraction, CO2 mass fraction, and H2O
mass fraction at 0g with full radiative transfer.
To illustrate how gravity affects quantities related to soot, Figs. 3 and 4 display the distributions of
C2H2 mass fraction, soot volume fraction, soot nucleation rate (in g cm-3 s-1), and soot surface
growth rate (in g cm-3 s-1) at 1g and 0g, respectively. It is first noticed that the concentrations of
C2H2 become much lower when the gravity is lowered from 1g to 0g, especially in the centerline
region. The distribution of soot volume fraction at 0g exhibits distinct features from that at 1g. First, soot exists only in a narrow co-annular region around the burner rim radially. This is due to the lack of radially inward flow associated with the absence of buoyancy induced flow acceleration at 0g and the lack of soot nucleation at the centerline region as a result of radiation heat loss. Secondly, the soot volume fractions are much higher at 0g (with a peak value more than 90 ppm vs. a peak value of 8.85 ppm at 1g) and soot escapes from the flame, Fig. 4(b), as mentioned above, instead of being fully oxidized with the flame at 1g, Fig. 3(b). It is interesting to observe that both the soot nucleation and surface growth rates at 0g are actually lower than those at 1g, compare Figs. 4(c) and 4(d) with Figs. 3(c) and 3(d). It is therefore evident that the enhanced soot loading at 0g can be attributed to the combined effect of prolonged residence times, as a result of much lower axial velocity shown in Fig. 2(a), and the almost absence of soot oxidation by OH. The latter point can be appreciated by noticing that the region of high OH concentration does not intersect or overlap with the path along which soot is transported. On the other hand, the high OH concentration region fully envelops the sooting region with a closed tip at 1g. This is why the flame at 1g does not emit soot.
0 1 2 r, cm 0 1 2 3 4 5 6 7 8 z, cm R1 4.00 3.84 3.68 3.52 3.36 3.20 3.04 2.88 2.72 2.56 2.40 2.24 2.08 1.92 1.76 1.60 1.44 1.28 1.12 0.96 0.80 0.64 0.48 0.32 0.16 0.00 (c) R1x 1.0E7 Peak: 4.817E-7 0 1 2 r, cm 0 1 2 3 4 5 6 7 8 z, c m R2 7 6.72 6.44 6.16 5.88 5.6 5.32 5.04 4.76 4.48 4.2 3.92 3.64 3.36 3.08 2.8 2.52 2.24 1.96 1.68 1.4 1.12 0.84 0.56 0.28 0 (d) R2x1.0E4 Peak: 6.974E-4 0 1 2 r, cm 0 1 2 3 4 5 6 7 8 z, cm C2H2 0.05 0.048 0.046 0.044 0.042 0.04 0.038 0.036 0.034 0.032 0.03 0.028 0.026 0.024 0.022 0.02 0.018 0.016 0.014 0.012 0.01 0.008 0.006 0.004 0.002 0 (a) C2H2 Peak: 0.0576 0 1 2 r, cm 0 1 2 3 4 5 6 7 8 z, cm Soot 8 7.68 7.36 7.04 6.72 6.4 6.08 5.76 5.44 5.12 4.8 4.48 4.16 3.84 3.52 3.2 2.88 2.56 2.24 1.92 1.6 1.28 0.96 0.64 0.32 0 (b) Soot vol. frac.
Peak: 8.852 ppm
Fig. 3 Distributions of C2H2 mass fraction, soot volume fraction, soot nucleation rate (in g cm-3 s-1),
and soot surface growth rate (in g cm-3 s-1) at 1g with full radiative transfer.
0 1 2 r, cm 0 1 2 3 4 5 6 7 8 z, cm Soot 40 38.4 36.8 35.2 33.6 32 30.4 28.8 27.2 25.6 24 22.4 20.8 19.2 17.6 16 14.4 12.8 11.2 9.6 8 6.4 4.8 3.2 1.6 0 (b) Soot vol. frac.
Peak: 92.2 ppm 0 1 2 r, cm 0 1 2 3 4 5 6 7 8 z, c m R1 2.50 2.40 2.30 2.20 2.10 2.00 1.90 1.80 1.70 1.60 1.50 1.40 1.30 1.20 1.10 1.00 0.90 0.80 0.70 0.60 0.50 0.40 0.30 0.20 0.10 0.00 (c) R1x 1.0E7 Peak: 2.512E-7 0 1 2 r, cm 0 1 2 3 4 5 6 7 8 z, cm R2 3 2.88 2.76 2.64 2.52 2.4 2.28 2.16 2.04 1.92 1.8 1.68 1.56 1.44 1.32 1.2 1.08 0.96 0.84 0.72 0.6 0.48 0.36 0.24 0.12 0 (d) R2x1.0E4 Peak: 3.262E-4 0 1 2 r, cm 0 1 2 3 4 5 6 7 8 z, cm C2H2 0.05 0.048 0.046 0.044 0.042 0.04 0.038 0.036 0.034 0.032 0.03 0.028 0.026 0.024 0.022 0.02 0.018 0.016 0.014 0.012 0.01 0.008 0.006 0.004 0.002 0 (a) C2H2 Peak: 0.0407
Fig. 4 Distributions of C2H2 mass fraction, soot volume fraction, soot nucleation rate (in g cm-3 s-1),
and soot surface growth rate (in g cm-3 s-1) at 0g with full radiative transfer.
Effect of radiation heat loss To quantify the importance of radiation heat loss in the laminar
colfow ethylene/air diffusion flame, calculations at both 1g and 0g were also conducted with the radiative source term removed from the energy equation, i.e., without radiation heat loss. A quantitative understanding of the importance of radiation heat transfer in this flame at 1g and 0g can then be gained by comparing the results with and without radiation heat transfer. Figs. 5 and 6
display the distributions of axial velocity, temperature, OH mass fraction, CO2 mass fraction, and
H2O mass fraction at 1g and 0g, respectively. Similarly, Figs. 7 and 8 show the distributions of
C2H2 mass fraction, soot volume fraction, soot nucleation rate, and soot surface growth rate.
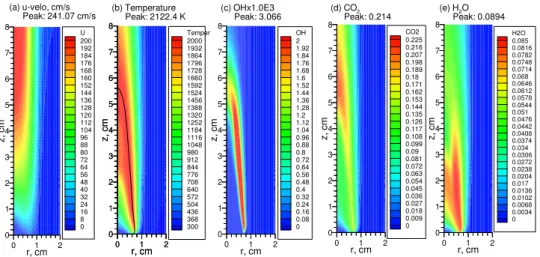
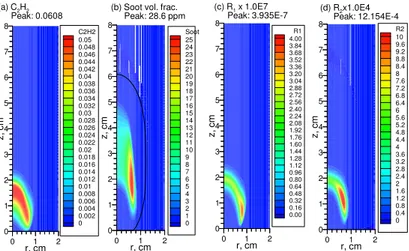
Although radiation heat loss has significant impact on the flame structure and soot field in this flame at 1g, compare Figs. 5 and 7 with Figs. 1 and 3, it has a much stronger influence at 0g. At 1g, radiative heat loss lowers the flame temperature by about 144 K and increases the visible flame height from about 4.5 cm to about 6 cm. At 0g, radiation heat loss reduces the peak flame temperature by as much as 240 K, compare Fig. 6(b) with Fig. 2(b), and the flame changes from an open-tipped to a close-tipped, and from a non-smoking one to a smoking (soot-emitting) one, compared Fig. 8(b) to Fig. 4(b). In both cases (1g and 0g), radiation heat loss lowers the temperatures in the centerline region the most, especially at 0g where the flame temperatures in the upper portion of the flame around z = 6 cm is lowered by more than 1000 K due to radiation heat loss. The corresponding temperature drops at 1g are about 300 K. The much stronger effect of radiation heat loss at 0g than that at 1g is similar to that shown recently by Kong and Liu [10].
0 1 2 r, cm 0 1 2 3 4 5 6 7 8 z, c m U 200 192 184 176 168 160 152 144 136 128 120 112 104 96 88 80 72 64 56 48 40 32 24 16 8 0 (a) u-velo, cm/s Peak: 241.07 cm/s 0 1 2 r, cm 0 1 2 3 4 5 6 7 8 z, c m Temper 2000 1932 1864 1796 1728 1660 1592 1524 1456 1388 1320 1252 1184 1116 1048 980 912 844 776 708 640 572 504 436 368 300 (b) Temperature Peak: 2122.4 K 0 1 2 r, cm 0 1 2 3 4 5 6 7 8 z, c m OH 2 1.92 1.84 1.76 1.68 1.6 1.52 1.44 1.36 1.28 1.2 1.12 1.04 0.96 0.88 0.8 0.72 0.64 0.56 0.48 0.4 0.32 0.24 0.16 0.08 0 (c) OHx1.0E3 Peak: 3.066 0 1 2 r, cm 0 1 2 3 4 5 6 7 8 z, c m CO2 0.225 0.216 0.207 0.198 0.189 0.18 0.171 0.162 0.153 0.144 0.135 0.126 0.117 0.108 0.099 0.09 0.081 0.072 0.063 0.054 0.045 0.036 0.027 0.018 0.009 0 (d) CO2 Peak: 0.214 0 1 2 r, cm 0 1 2 3 4 5 6 7 8 z, c m H2O 0.085 0.0816 0.0782 0.0748 0.0714 0.068 0.0646 0.0612 0.0578 0.0544 0.051 0.0476 0.0442 0.0408 0.0374 0.034 0.0306 0.0272 0.0238 0.0204 0.017 0.0136 0.0102 0.0068 0.0034 0 (e) H2O Peak: 0.0894 0 1 2 r, cm 0 1 2 3 4 5 6 7 8 z, c m
Fig. 5 Distributions of axial velocity, temperature, OH mass fraction, CO2 mass fraction, and H2O
mass fraction at 1g without radiative transfer.
0 1 2 r, cm 0 1 2 3 4 5 6 7 8 z, c m U 20 19.2 18.4 17.6 16.8 16 15.2 14.4 13.6 12.8 12 11.2 10.4 9.6 8.8 8 7.2 6.4 5.6 4.8 4 3.2 2.4 1.6 0.8 0 (a) u-velo, cm/s Peak: 21.37 cm/s 0 1 2 r, cm 0 1 2 3 4 5 6 7 8 z, cm OH 2 1.92 1.84 1.76 1.68 1.6 1.52 1.44 1.36 1.28 1.2 1.12 1.04 0.96 0.88 0.8 0.72 0.64 0.56 0.48 0.4 0.32 0.24 0.16 0.08 0 (c) OHx1.0E3 Peak: 2.488 0 1 2 r, cm 0 1 2 3 4 5 6 7 8 z, cm CO2 0.225 0.216 0.207 0.198 0.189 0.18 0.171 0.162 0.153 0.144 0.135 0.126 0.117 0.108 0.099 0.09 0.081 0.072 0.063 0.054 0.045 0.036 0.027 0.018 0.009 0 (d) CO2 Peak: 0.229 0 1 2 r, cm 0 1 2 3 4 5 6 7 8 z, c m H2O 0.085 0.0816 0.0782 0.0748 0.0714 0.068 0.0646 0.0612 0.0578 0.0544 0.051 0.0476 0.0442 0.0408 0.0374 0.034 0.0306 0.0272 0.0238 0.0204 0.017 0.0136 0.0102 0.0068 0.0034 0 (e) H2O Peak: 0.102 0 1 2 r, cm 0 1 2 3 4 5 6 7 8 z, cm Temper 2000 1932 1864 1796 1728 1660 1592 1524 1456 1388 1320 1252 1184 1116 1048 980 912 844 776 708 640 572 504 436 368 300 (b) Temperature Peak: 2103.2 K 0 1 2 r, cm 0 1 2 3 4 5 6 7 8 z, cm
Fig. 6 Distributions of axial velocity, temperature, OH mass fraction, CO2 mass fraction, and H2O
mass fraction at 0g without radiative transfer.
0 1 2 r, cm 0 1 2 3 4 5 6 7 8 z, c m R1 7.00 6.72 6.44 6.16 5.88 5.60 5.32 5.04 4.76 4.48 4.20 3.92 3.64 3.36 3.08 2.80 2.52 2.24 1.96 1.68 1.40 1.12 0.84 0.56 0.28 0.00 (c) R1x 1.0E7 Peak: 7.091E-7 0 1 2 r, cm 0 1 2 3 4 5 6 7 8 z, c m R2 10 9.6 9.2 8.8 8.4 8 7.6 7.2 6.8 6.4 6 5.6 5.2 4.8 4.4 4 3.6 3.2 2.8 2.4 2 1.6 1.2 0.8 0.4 0 (d) R2x1.0E4 Peak: 13.751E-4 0 1 2 r, cm 0 1 2 3 4 5 6 7 8 z, c m Soot 9 8.64 8.28 7.92 7.56 7.2 6.84 6.48 6.12 5.76 5.4 5.04 4.68 4.32 3.96 3.6 3.24 2.88 2.52 2.16 1.8 1.44 1.08 0.72 0.36 0 (b) Soot vol. frac.
Peak: 9.115 ppm 0 1 2 r, cm 0 1 2 3 4 5 6 7 8 z, cm C2H2 0.075 0.072 0.069 0.066 0.063 0.06 0.057 0.054 0.051 0.048 0.045 0.042 0.039 0.036 0.033 0.03 0.027 0.024 0.021 0.018 0.015 0.012 0.009 0.006 0.003 0 (a) C2H2 Peak: 0.0753
Fig. 7 Distributions of C2H2 mass fraction, soot volume fraction, soot nucleation rate (in g cm-3 s-1),
0 1 2 r, cm 0 1 2 3 4 5 6 7 8 z, c m R2 10 9.6 9.2 8.8 8.4 8 7.6 7.2 6.8 6.4 6 5.6 5.2 4.8 4.4 4 3.6 3.2 2.8 2.4 2 1.6 1.2 0.8 0.4 0 (d) R2x1.0E4 Peak: 12.154E-4 0 1 2 r, cm 0 1 2 3 4 5 6 7 8 z, c m R1 4.00 3.84 3.68 3.52 3.36 3.20 3.04 2.88 2.72 2.56 2.40 2.24 2.08 1.92 1.76 1.60 1.44 1.28 1.12 0.96 0.80 0.64 0.48 0.32 0.16 0.00 (c) R1x 1.0E7 Peak: 3.935E-7 0 1 2 r, cm 0 1 2 3 4 5 6 7 8 z, cm Soot 25 24 23 22 21 20 19 18 17 16 15 14 13 12 11 10 9 8 7 6 5 4 3 2 1 0 (b) Soot vol. frac.
Peak: 28.6 ppm 0 1 2 r, cm 0 1 2 3 4 5 6 7 8 z, cm C2H2 0.05 0.048 0.046 0.044 0.042 0.04 0.038 0.036 0.034 0.032 0.03 0.028 0.026 0.024 0.022 0.02 0.018 0.016 0.014 0.012 0.01 0.008 0.006 0.004 0.002 0 (a) C2H2 Peak: 0.0608
Fig. 8 Distributions of C2H2 mass fraction, soot volume fraction, soot nucleation rate (in g cm-3 s-1),
and soot surface growth rate (in g cm-3 s-1) at 0g without radiative transfer.
Effect of radiation absorption The importance of radiation absorption is also quantified by
conducting additional calculations with the absorption term in the radiative source term removed, i.e., emission only. This is equivalent to the optically thin approximation. Due to space limitation,
results for the axial velocity, temperature, mass fractions of OH, CO2, and H2O are not shown.
Overall the effect of radiation absorption was found relatively small. It alters the flame structure only quantitatively at both 1g and 0g, but not qualitatively as the radiation heat loss does at 0g. The effect of radiation absorption at 1g is similar to that shown in a previous study [2]. At 0g, however, the effect of absorption is enhanced as indicated by (i) the peak flame temperature is further lowered from 1863.7 K to 1851.4 K, (ii) the flame height is further increased from 7.2 cm to 7.8 cm, and (iii) the temperatures in the centerline region in the upper portion of the flame around z = 7
cm are further lowered by about 100 K. Results for C2H2 mass fraction, soot volume fraction, soot
nucleation rate, and soot surface growth rate at 1g and 0g are displayed in Figs. 9 and 10, respectively. The effects of radiation absorption on these quantities at 1g and 0g can be observed by comparing Fig. 9 to Fig. 3 and Fig. 10 to Fig. 4, respectively. At 1g the effects of absorption on these quantities are fairly small, consistent with the above discussion for the other five quantities. At 0g, however, radiation absorption affects the flame height and the soot loading significantly. The peak soot volume fraction is reduced from 92 ppm to 76.7 ppm when radiation absorption is neglected. 0 1 2 r, cm 0 1 2 3 4 5 6 7 8 z, cm R2 7 6.72 6.44 6.16 5.88 5.6 5.32 5.04 4.76 4.48 4.2 3.92 3.64 3.36 3.08 2.8 2.52 2.24 1.96 1.68 1.4 1.12 0.84 0.56 0.28 0 (d) R2x1.0E4 Peak: 6.703E-4 0 1 2 r, cm 0 1 2 3 4 5 6 7 8 z, c m R1 4.00 3.84 3.68 3.52 3.36 3.20 3.04 2.88 2.72 2.56 2.40 2.24 2.08 1.92 1.76 1.60 1.44 1.28 1.12 0.96 0.80 0.64 0.48 0.32 0.16 0.00 (c) R1x 1.0E7 Peak: 4.729E-7 0 1 2 r, cm 0 1 2 3 4 5 6 7 8 z, cm C2H2 0.05 0.048 0.046 0.044 0.042 0.04 0.038 0.036 0.034 0.032 0.03 0.028 0.026 0.024 0.022 0.02 0.018 0.016 0.014 0.012 0.01 0.008 0.006 0.004 0.002 0 (a) C2H2 Peak: 0.0564 0 1 2 r, cm 0 1 2 3 4 5 6 7 8 z, c m Soot 8 7.68 7.36 7.04 6.72 6.4 6.08 5.76 5.44 5.12 4.8 4.48 4.16 3.84 3.52 3.2 2.88 2.56 2.24 1.92 1.6 1.28 0.96 0.64 0.32 0 (b) Soot vol. frac.
Peak: 8.724 ppm
Fig. 9 Distributions of C2H2 mass fraction, soot volume fraction, soot nucleation rate (in g cm-3 s-1),
0 1 2 r, cm 0 1 2 3 4 5 6 7 8 z, cm C2H2 0.05 0.048 0.046 0.044 0.042 0.04 0.038 0.036 0.034 0.032 0.03 0.028 0.026 0.024 0.022 0.02 0.018 0.016 0.014 0.012 0.01 0.008 0.006 0.004 0.002 0 (a) C2H2 Peak: 0.0399 0 1 2 r, cm 0 1 2 3 4 5 6 7 8 z, cm Soot 40 38.4 36.8 35.2 33.6 32 30.4 28.8 27.2 25.6 24 22.4 20.8 19.2 17.6 16 14.4 12.8 11.2 9.6 8 6.4 4.8 3.2 1.6 0 (b) Soot vol. frac.
Peak: 76.69 ppm 0 1 2 r, cm 0 1 2 3 4 5 6 7 8 z, c m R1 2.50 2.40 2.30 2.20 2.10 2.00 1.90 1.80 1.70 1.60 1.50 1.40 1.30 1.20 1.10 1.00 0.90 0.80 0.70 0.60 0.50 0.40 0.30 0.20 0.10 0.00 (c) R1x 1.0E7 Peak: 2.399E-7 0 1 2 r, cm 0 1 2 3 4 5 6 7 8 z, cm R2 3 2.88 2.76 2.64 2.52 2.4 2.28 2.16 2.04 1.92 1.8 1.68 1.56 1.44 1.32 1.2 1.08 0.96 0.84 0.72 0.6 0.48 0.36 0.24 0.12 0 (d) R2x1.0E4 Peak: 3.008E-4
Fig. 10 Distributions of C2H2 mass fraction, soot volume fraction, soot nucleation rate
(in g cm-3 s-1), and soot surface growth rate (in g cm-3 s-1) at 0g without radiative absorption.
CONCLUSIONS
Detailed numerical modelling of a laminar coflow ethylene/air diffusion flame was conducted at both normal and microgravity with three radiation transfer treatments. The effects of radiation heat loss were found to be significantly more important at microgravity than at normal gravity. For the flame investigated in this study, radiation heat loss completely alters the flame structure at microgravity from a tip-closed one to a tip-open one and flame a non-smoking one to a smoking one. Although radiation heat loss was found also important at normal gravity, especially in the upper portion of the flame, its effect is much smaller compared to that at microgravity. Radiation absorption was also found to be more important at microgravity than at normal gravity. This study once again demonstrates that it is essential to model radiative heat transfer accurately in laminar diffusion flame modelling at microgravity.
ACKNOWLEDGEMENTS
Wenjun Kong would like to acknowledge the financial support from National Natural Science Foundation of China (NSFC) under grant No. 50936005.
REFERENCES
1. Maruta, K., Yoshida, M., Guo, H., Ju, Y., and Niioka, T., Extinction of Low-Stretched Diffusion Flame in Microgravity, Combust. Flame, Vol. 112, pp. 181-187, 1998.
2. Liu, F., Guo, H., Smallwood, G. J. and Gülder, Ö. L., Effects of Gas and Soot Radiation on Soot Formation in a Coflow Laminar Ethylene Diffusion Flame, JQSRT, Vol. 73, pp. 409-421, 2002. 3. Liu, F., Guo, H., Smallwood, G. J., and Gülder, Ö. L., Effects of Gas and Soot Radiation on Soot
Formation in Counterflow Ethylene Diffusion Flames, JQSRT, Vol. 84, pp. 501-511, 2004.
4. Kaplan, C. R., Baek, S. W., Oran, E. S., and Ellzey, J. L., Dynamics of a Strongly Radiating Unsteady Ethylene Jet Diffusion Flame, Combust. Flame, Vol. 96, pp. 256-263, 1997.
5. Sivathanu, Y. R., and Gore, J. P., Coupled Radiation and Soot Kinetics Calculations in Lamminar Acetylene/Air Diffusion Flames, Combust. Flame, Vol. 97, pp. 1-21, 1994.
6. Liu, F., Guo. H., and Smallwood, G. J., Effects of Radiation Model on the Modeling of a Laminar Coflow Methane/Air Diffusion Flame, Combust. Flame, Vol. 138, pp. 136-154, 2004.
7. Wang, L., Haworth, D. C., Turns, S. R., and Modest, M. F., Interactions among Soot, Thermal Radiation, and NOx Emissions in Oxygen-Enriched Turbulent Nonpremixed Flames: a Computational Fluid Dynamics Modeling Study, Combust. Flame, Vol. 141, pp. 170-179, 2005.
8. Ronney, P. D., Near-Limit Flame Structures at Low Lewis Number, Combust. Flame, Vol. 82, pp. 1-14, 1990.
9. Shu, Z., Choi, C. W., Aggarwal, S. K., Katta, V. R. and Puri, I. K., Gravity Effects on Steady Two-Dimensional Partially Premixed Methane-Air Flames, Combust. Flame, Vol. 118, pp. 91-107, 1999.
10. Kong, W. and Liu, F., Numerical Study of the Effects of Gravity on Soot Formation on Lamminar Coflow Methane/Air Diffusion Flames under Different Air Stream Velocities, to appear in
Combust. Theory Modelling, 2009.
11. Liu, F., Guo, H., Smallwood, G. J., and Gülder, Ö. L., Numerical Moddelling of Soot Formation and Oxidation in Laminar Coflow Non-Smoking and Smoking Ethylene Diffusion Flames, Combust. Theory Modelling, Vol. 7, pp. 301-315, 2003.
12. Guo, H., Liu, F., Smallwood, G. J., and Gülder, Ö. L., The Flame Preheating Effect on Numerical Modelling of Soot Formation in a Two-Dimensional Laminar Ethylene-Air Diffusion Flame, Combust. Theory Modelling, Vol. 6, pp. 173-187, 2002.
13. Kee, R. J., Grcar, J. F., Smooke, M. D., and Miller, J. A., A Fortran Program for Modeling Steady Laminar One-Dimensional Premixed Flames, Report No., SAND85-8240, Sandia National Laboratories, 1985.
14. Leung, K. M., Lindstedt, R. P., and Jones, W. P., A Simplified Reaction Mechanism for Soot Formation in Nonpremixed Flames, Combust. Flame, Vol. 87, pp. 289-305, 1991.
15. Liu, F. and Smallwood, G. J., An Efficient Approach for the Implementation of the SNB based Correlated-k Method and Its Evaluation, JQSRT, Vol. 84, pp. 465-475, 2004.
16. Soufiani, A. and Taine, J., High Temperature Gas Radiative Property Parameters of Statistical
Narrow-Band Model for H2O, CO2 and CO, and Correlated-K Model for H2O and CO2, Int. J.
Heat Mass Transfer, Vol. 40, pp. 987-991, 1997.
17. Smith, G. P., Golden, D. M., Frenklach, M., Moriarty, N. W., Eiteneer, B., Goldenberg, M., Bowman, C. T., Hanson, R. K., Song, S., Gardiner Jr., W. C., Lissianski, V. V., and Qin, Z.,
http://www.me.berkeley.edu/gri_mech/.
18. Bilger, R. W., Stårner, S. H., and Kee, R. J., On Reduced Mechanisms for Methane-Air Combustion in Nonpremixed Flames, Combust. Flame, Vol. 80, pp. 135-149, 1990.
19. Gülder, Ö. L., Snelling, D. R., and Sawchuk, R. A., Influence of Hydrogen Addition to Fuel on Temperature Field and Soot Formation in Diffusion Flames, Proc. Combust. Inst. Vol. 26, pp. 2351-2358, 1996.
20. Santoro, R. J., Yeh, T. T., Horvath, J. J., and Semerjian, H. G., The transport and growth of soot particles in laminar diffusion flames, Combust. Sci. Tech., Vol. 53, pp. 89-115, 1987.